USIG - Implications Of An Inverted Yield Curve For U.S. Bond Returns
2023-06-12 22:12:00 ET
Summary
- The US Treasury yield curve is at its most inverted since the 1980s.
- An inverted yield curve has been in place for five of the past six recessions.
- Fixed income has historically shown positive returns during recessionary periods.
By Matt Brill, Head of North American Investment Grade; Todd Schomberg, Senior Portfolio Manager
The US Treasury market is the largest and most liquid government bond market in the world. The shape of the Treasury yield curve provides valuable information about how investors view monetary policy, risk and the direction of the economy.
Normally the yield curve is upward-sloping with longer maturity bonds offering a yield premium to shorter-dated bonds. However, occasionally the yield curve inverts, and short-term rates exceed longer term rates.
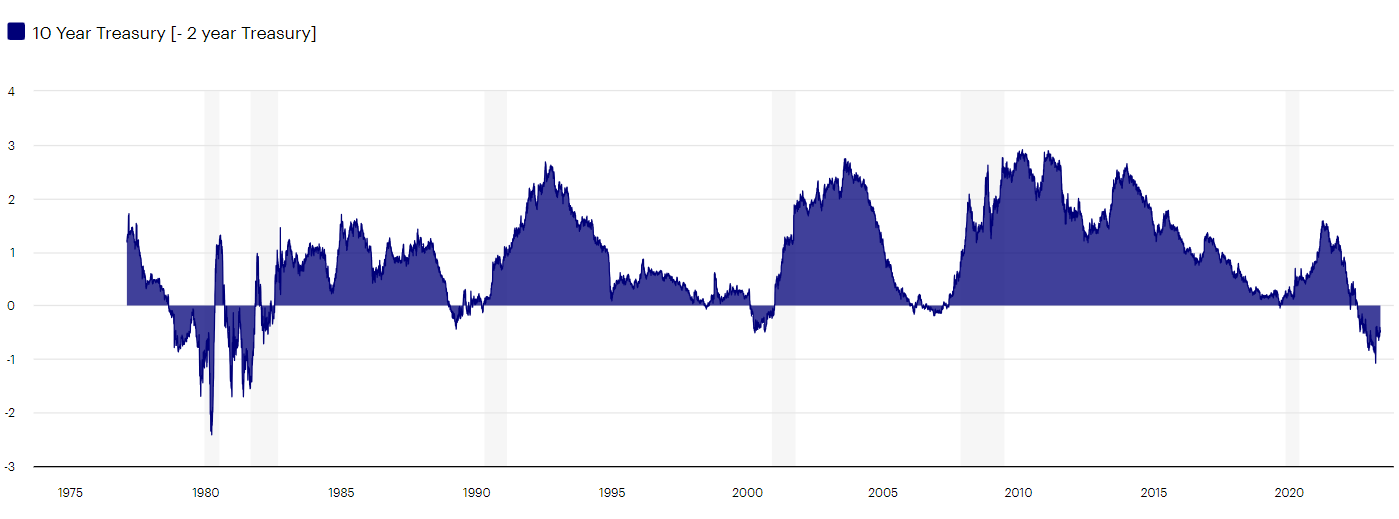
An inverted yield curve is viewed as a strong signal the economy may be heading for a recession. A yield curve inversion has preceded every recession since the 1970s — other than the COVID-driven event in 2020 — by about a year.
An inverted yield curve has been a historical indicator of recessions
Source: Macrobond. Inverted yield curve represented by the spread between the 10-year US Treasury yield and the 2-year US Treasury yield. Grey bars highlight periods of recession. An investment cannot be made in an index. Past performance is not a guarantee of future results.
During a recession, investors tend to reduce allocation to riskier assets and shift into instruments like bonds. A recession decreases growth and inflation expectations leading to lower interest rates, which further support bond markets. As more investors move into bonds, demand for bonds creates a virtuous cycle of price appreciation and even more demand. This pattern is consistently observed in corporate bond returns for the year following “peak” yield curve inversion during past recessions.
Corporate returns after peak inversion
| 2s/10s Inversion | Peak Inversion | Amount of Inversion at peak | Corporate Index Returns 12-months after peak |
|---|---|---|---|
| Aug 1978 – May 1980 | |||
| Mar 20, 1980 | |||
| -2.42 | |||
| 13.22% | |||
| Sept 1980 – Nov 1981 | |||
| Dec 17, 1980 | |||
| -1.71 | |||
| 2.95% | |||
| Jan 1982 – July 1982 | |||
| Feb 18, 1982 | |||
| -0.72 | |||
| 41.31% | |||
| Dec 1988 – Oct 1989 | |||
| Mar 29, 1989 | |||
| -0.44 | |||
| 11.79% | |||
| Feb 2000 – Dec 2000 | |||
| Apr 7, 2000 | |||
| -0.51 | |||
| 12.79% | |||
| Dec 2005 – June 2007 | |||
| Nov 27, 2006 | |||
| -0.19 | |||
| 3.44% |
Source: Macrobond. 2s/10s Inversion is when the yield on the 2-year Treasury exceeds the yield on the 10-year treasury. The corporate index shown is the Bloomberg US Corporate Bond Index. Returns are calculated monthly in the 12-month period following the point of peak inversion. An investment cannot be made in an index. Past performance is not a guarantee of future results.
Disclosures:
NA 2917410
Header image: Tara Romasanta Photography / Stocksy
Past performance is not a guarantee of future results.
This does not constitute a recommendation of any investment strategy or product for a particular investor. Investors should consult a financial professional before making any investment decisions.
All investing involves risk, including the risk of loss.
An investment cannot be made directly in an index.
Fixed-income investments are subject to credit risk of the issuer and the effects of changing interest rates. Interest rate risk refers to the risk that bond prices generally fall as interest rates rise and vice versa. An issuer may be unable to meet interest and/or principal payments, thereby causing its instruments to decrease in value and lowering the issuer’s credit rating.
The yield curve plots interest rates, at a set point in time, of bonds having equal credit quality but differing maturity dates to project future interest rate changes and economic activity. An inverted yield curve is one in which shorter-term bonds have a higher yield than longer-term bonds of the same credit quality. In a normal yield curve, longer-term bonds have a higher yield.
The opinions referenced above are those of the author as of May 25, 2023 . These comments should not be construed as recommendations, but as an illustration of broader themes. Forward-looking statements are not guarantees of future results. They involve risks, uncertainties and assumptions; there can be no assurance that actual results will not differ materially from expectations.
Implications of an inverted yield curve for US bond returns by Invesco US.
For further details see:
Implications Of An Inverted Yield Curve For U.S. Bond Returns