OXSQG - Income Investing Lessons Of 2022
Summary
- 2022 was a tough year for income investors, with large drawdowns and few places to hide.
- We discuss some of the key lessons and takeaways of the year.
- These include how to think about bond-stock diversification, using countercyclical allocation, the concept of opportunity cost, and other topics.
This article was first released to Systematic Income subscribers and free trials on Dec. 31 .
Outside of a handful of pockets, 2022 was a very difficult year for income assets. In this article, we review some of the key lessons and takeaways of this difficult year. Although it's unlikely we see a repeat of 2022 anytime soon, the lessons of the year will remain useful for income allocation going forward.
One important factor that made 2022 so unusually grim was the fact that both bonds and stocks had large drops this year. This breakdown in bond / stock diversification was particularly damaging.
At the end of 2021, we were asked about the PIMCO StocksPLUS Long Duration Fund ( PSLDX ) which was one of the darlings of the income world, having both a relatively high yield and a very impressive long-dated return of 17.6% from 2000 to the end of 2021. What drove this performance was the fund's leveraged position in both long-dated high-quality bonds and stocks. Year-to-date, the fund is down 43%.
At the end of 2021, our view was the following:
Systematic Income Chat
The key takeaway here is not to flog a warning that was borne out in spades, but instead to highlight how bond/stock diversification works so that a breakdown in the usual pattern of bond/stock returns does not catch investors by surprise next time around.
In short, if the shock to markets comes from fixed-income, whether through an inflation shock or a monetary policy mistake, stocks usually drop along with bonds. However, if the macro shock comes from stocks, such as through a drop in corporate earnings (due to a recession or otherwise), stocks usually drop but bonds (at least the high-quality variety) typically rise.
In 2022, the shock clearly came from bonds - more specifically, from a sharp jump in inflation that took many by surprise and, moreover, by the Fed that turned on a dime from a dovish to hawkish stance. This had the expected impact on stocks and risky assets more broadly, creating very few places to hide for investors and hurting diversified portfolios.
This dynamic shows that a shock that comes from bonds can be particularly damaging for diversified portfolios and is something that investors need to take into account in their allocation. Specifically, diversification needs to move beyond the bond / stock portfolio but also include shorter-maturity securities and higher-quality floating-rate securities , among others.
Another key lesson of 2022 was to highlight the benefits of countercyclical income allocation . Countercyclical, as opposed to procyclical, allocation simply means taking more exposure when valuations are attractive (i.e., when prices are lower) and dialing down risk exposure when valuations are not attractive (i.e., when prices are higher).
Countercyclical allocation stands in contrast to procyclical allocation which is a common strategy when investors reach for yield when yields drop in order to maintain a certain level of yield in their portfolio. This often causes investors to buy lower quality assets when valuations become more expensive.
There are many ways to keep tabs on valuations. One of our favorite ways is to do this along two dimensions - asset yields (x-axis) and discounts (y-axis). Periods of expensive valuations are marked by tight discounts and low asset yields (the upper-left quadrant below) and vice-versa. The chart shows that 2021 was marked by unusually expensive valuations and that by the second-half of 2022 the market migrated towards much more attractive valuations - from the upper-left quadrant to the lower-right quadrant - the latest reading of Dec-22 is marked with a red dot.
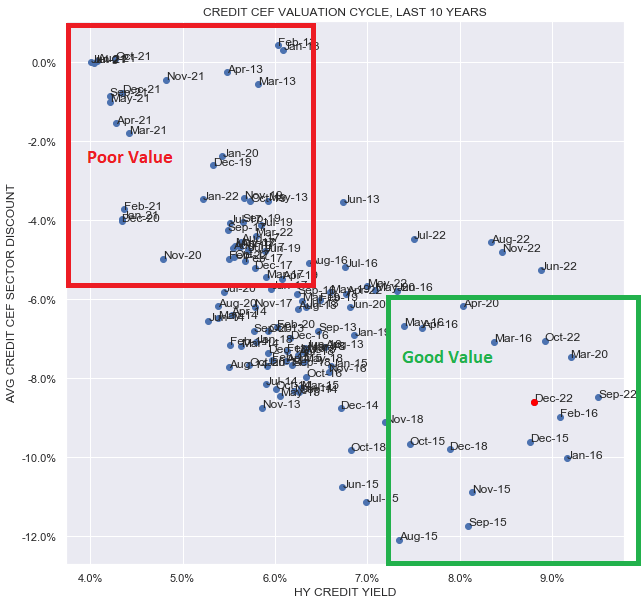
Investors who were patient enough to wait for improved valuations in 2021 by moving to lower-beta / more resilient securities were able to mitigate losses and keep more ballast for allocating to higher-beta income assets such as closed-end funds ("CEFs").
In our own High Income Portfolio, we significantly took down our CEF allocation by the end of 2021 and started to reallocate back to CEFs once discounts widened and yields increased in 2022. Obviously, in many cases, moving away from CEFs towards lower-beta / lower-yield securities such as shorter-maturity bonds does reduce the yield of the portfolio. However, the reduction in yield is often low and, when it happens, is typically worth the associated reduction in risk.
Systematic Income
How much of a yield reduction is worth taking when reducing risk brings us to the concept of opportunity cost which remains a good guide in quantifying when it makes sense to dial down risk exposure .
The chart below plots the additional yield generated by a typical high-yield corporate bond CEF over the yield of its unleveraged portfolio. The average over the last decade has been an additional yield of about 1.5%. In the second half of 2021, this number fell to less than 0.5% which made higher-beta income securities such as CEFs particularly unattractive in our view.
Systematic Income
The reason this happened was two-fold: underlying asset yields fell to very low levels - for example, high-yield corporate bonds offered a yield of just 4%. Plus, CEF discounts moved to expensive levels of around zero, as the following chart shows. Tight discounts limit how much additional yield investors can earn on CEFs.
Systematic Income CEF Tool
What this means is that the opportunity cost of avoiding CEFs in favor of exchange-traded funds ("ETFs") was very low - just 0.5% for long periods in 2021. CEFs can generate higher yield through additional leverage and discounts, but also expose investors to significant losses through both leverage and the potential discount widening. And these risks took their toll on CEFs, many of which significantly underperformed their open-end unleveraged counterparts.
By contrast, 2022 brought an investment environment where the same CEF offered an excess yield of around 2-3% - much more attractive additional compensation for bearing the risk of leverage and discount widening.
This brings us to the question of what options investors have for dialing down exposure to higher-beta securities such as CEFs when the opportunity cost is low, i.e., when the additional compensation generated by these higher-beta securities is low as was the case in 2021.
The securities that we turn to in this eventuality are what we call drier-powder securities and these securities mostly held up very well this year . We call them "drier"-powder because these securities can and do suffer some losses but their losses tend to be contained relative to their higher-beta counterparts such as CEFs.
There are different types of securities that fit within the drier-powder umbrella . Among them are term CEFs, shorter-maturity baby bonds, short-duration open-end funds and higher-quality floating-rate structured products.
We always have some exposure to these securities in our Income Portfolios, however, we up our allocation when valuations become expensive and vice-versa.
Our go-to list for ideas is a list of shorter-maturity bonds - an extract is shown below. This set of securities has an average total return of -3.7% this year, with many securities actually in the green such as our favorites ( AIC ) and ( OXSQL ), which we have held for across our Portfolios since their inception.
Systematic Income Portfolios Tool
The topic of drier-powder securities brings us to another important issue which was highlighted in 2022: that safety can be dangerous . In other words, what many investors perceive as "safe" securities took significant drawdowns this year.
For example, agency mortgages have no credit risk and a modest duration profile. For this reason they are viewed as very safe. However, agency mortgage real estate investment trusts ("REITs") were clobbered this year due to their leveraged exposure to agency MBS and due to a significant widening in agency valuations relative to Treasuries.
In the CEF space, "safe" assets like Munis, Limited Duration or Agency funds took large drawdowns from 20-30% this year due to discount widening and the back-up in Treasury yields.
Systematic Income
The key takeaway here is that investors should be cognizant of all risk factors of a given security. For example, an asset with low credit risk such as Munis can still bear significant duration risk. Assets with low duration such as Limited Duration funds can bear significant credit risk. Any kind of asset held within a CEF wrapper bears discount risk. As the chart above shows, all CEF sectors with lower NAVs also faced wider discounts - a very typical double-whammy pattern that many income investors are well aware of and one which makes CEFs bad choices for low-beta / drier-powder holdings.
So, if current valuations are finally pretty attractive in the income space in contrast to 2022, how do investors go about allocating to income securities? A key lesson here and something we pointed out repeatedly through the year is that investors should avoid BUTT-ing, or "backing up the truck", so to speak. Calls for investors to back up the truck makes good copy but is bad investment advice.
The chart below shows the CEF total return index. What our annotations show is that there were multiple bear market rallies or false dawns. These short-term rallies may have made the impression that the worst was over and that investors need to get all-in before the entire drawdown is erased.
Systematic Income
The reality is that drawdowns can be extended and that spending all of one's dry powder is more likely to prevent investors from taking advantage of even lower prices later on. Rather than chasing rallies and spending all of the dry powder in one go, it's better, in our view, to add on new lows and spend only some of the dry powder at the new low.
Overall, it is unlikely that we will soon see a repeat of the kind of terrible and broad-based performance across the income space anytime soon. At the same time, investors shouldn't forget the lessons of 2022 since they will be useful for income allocation for a long time to come.
For further details see:
Income Investing Lessons Of 2022