QQQX - Income Portfolio - 38 CEFs Worth Exploring
2023-10-17 00:31:01 ET
Summary
- The number of CEFs currently in the U.S. market is 440, each one acting as a spokesperson for the strategy and management philosophy of the houses that launched them.
- The reason why most investors are interested in CEFs is because they provide a steady stream of dividends, but not all have created value over time.
- Dividend-paying CEFs with positive NAV since inception now number only 38, which is less than 10%.
- These 38 CEFs should, in my opinion, attract the attention of the long-term investor interested in both periodic returns and capital growth.
San Gimignano and the Middle Ages
Halfway between Florence and Siena lies the small, fortified town of San Gimignano. In the collective imagination, San Gimignano is identified with the very idea of the Middle Ages. Indeed, over the centuries, the ancient village has miraculously preserved its unmistakable 13th-century urban and architectural physiognomy. Such was given to it when it was an important trading center along the Via Francigena, the great European medieval artery that led pilgrims to Rome.
Its widespread wealth is evidenced by the flourishing of towers, symbols of the affluence of the local merchant class, which still tower over the surrounding countryside. In Dante's time, the city had more than seventy towers (of which only fourteen remain), protected by a law forbidding their demolition unless more beautiful ones were to be built. The tower thus represented a display of prestige for wealthy families, who could flaunt their economic power in a contest to assert the superiority of their lineage.
Towers and Closed-End Funds
The history of mankind is peppered with "contests" to assert one's prestige, skills and authority through the construction of material works, the accomplishment of memorable feats or the management of economic resources. Investment houses do not escape this dynamic either, continually offering new products and services, seeking to secure ever larger slices of the market.
In San Gimignano, towers were being built. In the financial world, investment funds are being launched. In this article, I will deal only with Closed-End Funds, which represent the core of my income portfolio. The number of CEFs currently on the U.S. market is 440, soaring through the financial sky, each one acting as a spokesperson for the strategy and management philosophy of the houses that launched them.
But are we sure they are always winning strategies? I analyzed all the funds, one by one, and the result overall is not quite encouraging. Let's see why.
Is It Worth Investing in CEFs?
The answer is yes, but on the condition of making wise choices, selecting the funds that, even though two difficult years like 2022 and 2023, have maintained their value over time. That is, whose NAV shows a positive trend since inception. The analysis conducted today therefore acquires greater relevance, given the performance of the markets in the recent past.
In order to invest consciously, it therefore appears necessary to avoid those CEFs that show a constant loss of wealth. This loss is only partially offset by double-digit distributions on which the man on the street typically focuses. Of course this includes, at times, yours truly, who is not exempt from blunders like most investors, to the extent that even my CEF portfolio, created during 2020, shows only partially optimal choices in this respect. Let he who is without sin cast the first stone...
Based on the list published by the site StockMarketMBA.com Home (which, however, is no longer maintained), I extrapolated 440 CEFs currently active on the U.S. market and analyzed them, one by one, focusing on their Net Asset Value % change since inception, using the YCharts platform.
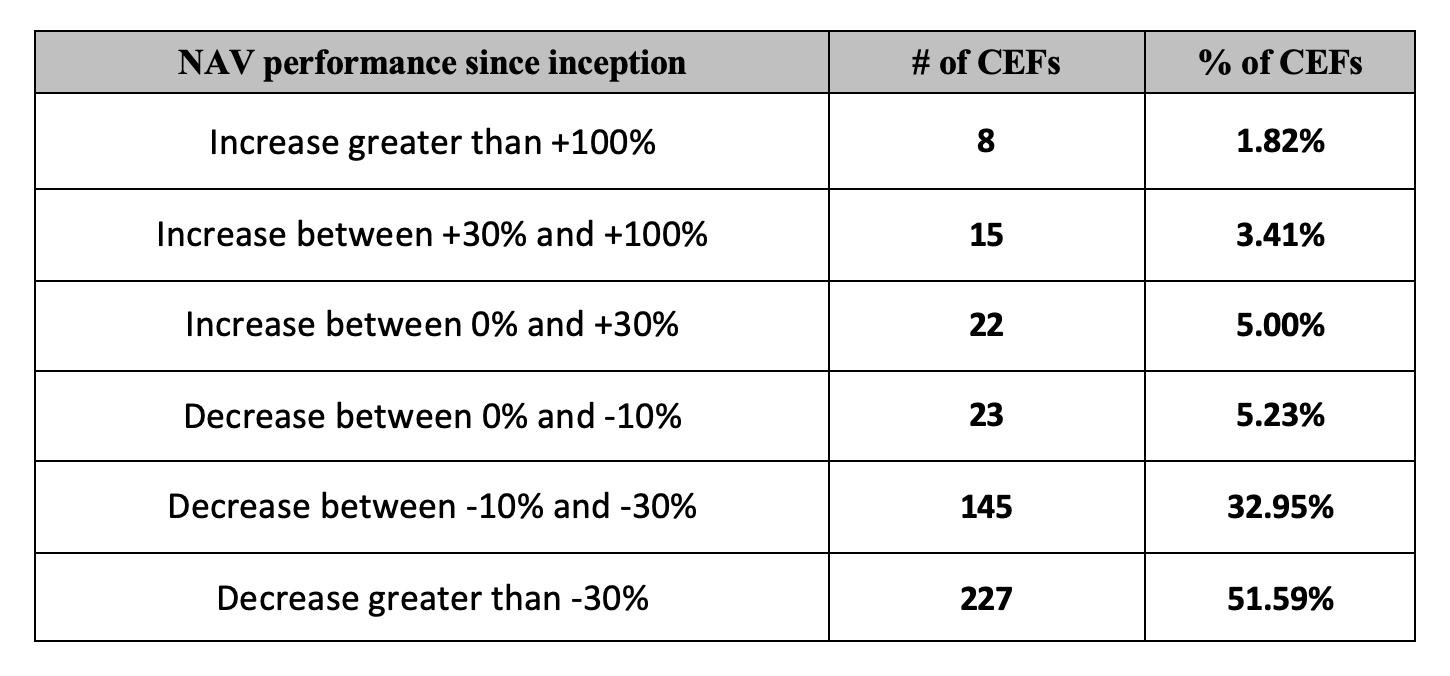
I divided all CEFs into six groups. This is the final result, updated to October 11, 2023 :
Note: Since it has taken me a few days to analyze all the 440 CEFs, it may be that in the meantime some funds have changed their performance, moving from one group to another. Some may also have changed their performance from negative to positive, thus remaining excluded from that list.
As can be seen from this summary table, as many as 395 CEFs, i.e., about 90 percent of all those currently on the market today, show a NAV that has lost value since inception. Of course, during this time there have been monthly or quarterly distributions that have affected the Total Return of each security. I have limited myself here to analyzing the sheer change in NAV, without taking into account either the cashflow generated by each fund or any reinvestment of dividends.
In practice, if at the time of their launch an investor had purchased any of the 395 CEFs which have decreased in value by merely cashing in the dividends since then, today he would have less invested capital than he had initially. This is because many of these stocks have seen their NAV drop, in some cases by as much as 70, 80 or 90 percent. (Since I am Italian, tax considerations related to the convenience of any loss-making transactions under U.S. taxation are beyond the scope of my analysis.)
Yes, with Due Caution
As I said, the answer as to whether it is worth investing in CEFs is yes, as long as one looks for quality. That is, selecting those funds that have increased the value of their assets over time, financing their distributions without depleting capital. Therefore, in this way creating a dual source of wealth: capital growth and dividends collected.
A virtuous circle, however, that affects less than 10 percent of the CEFs currently on the market, since 7 out of 45 funds with positive NAVs do not pay dividends. So the range of investment options for to those who follow a dividend strategy while also aiming for capital growth is further reduced.
The periodic distributions of these 38 CEFs vary in both amount and frequency, as does, of course, the appreciation of NAV from fund to fund. But, the message to be emphasized is that all 38 funds examined have over the years (albeit, in some cases, by a small amount) increased the face value of the initial capital, where purchased at launch, as well as, of course, paying dividends. Some of them have done much more, showing NAV growth even reaching double or triple digits.
A curious aspect that emerged during this analysis is that the vast majority of these funds quote at a discount, in many cases even in the double digits. In practice, one can buy at the flea market funds that have proven they can create value over time. Evidently, for mysterious reasons, value creation does not seem to have much appeal to the man on the street, as opposed to juicy distributions.
Let's look at the performance of these 38 CEFs in detail, grouped by frequency of distributions.
8 CEFs with Annual Distributions
Of the 38 dividend-paying CEFs with positive NAV since launch, 8 have distributions concentrated mainly in the year-end installment (represented mostly by capital gains, and therefore variable from year to year) although some of them pay quarterly or semiannual interim payments. In some cases, these are historical funds, having been launched last century, but they still enjoy excellent health, as can be seen from the graphs.
I am not personally interested in this type of CEF because of the excessive dilution of their distributions over time. This prevents me from framing them properly within the context of my income portfolio.
In any case, this is the list:
- Adams Diversified Equity Fund ( ADX )
- Central Securities Corporation ( CET )
- European Equity Fund ( EEA )
- Templeton Emerging Markets Fund ( EMF )
- General American Investors Company ( GAM )
- Eagle Capital Growth Fund ( GRF )
- Morgan Stanley India Investment Fund ( IIF )
- Adams Natural Resources Fund ( PEO )
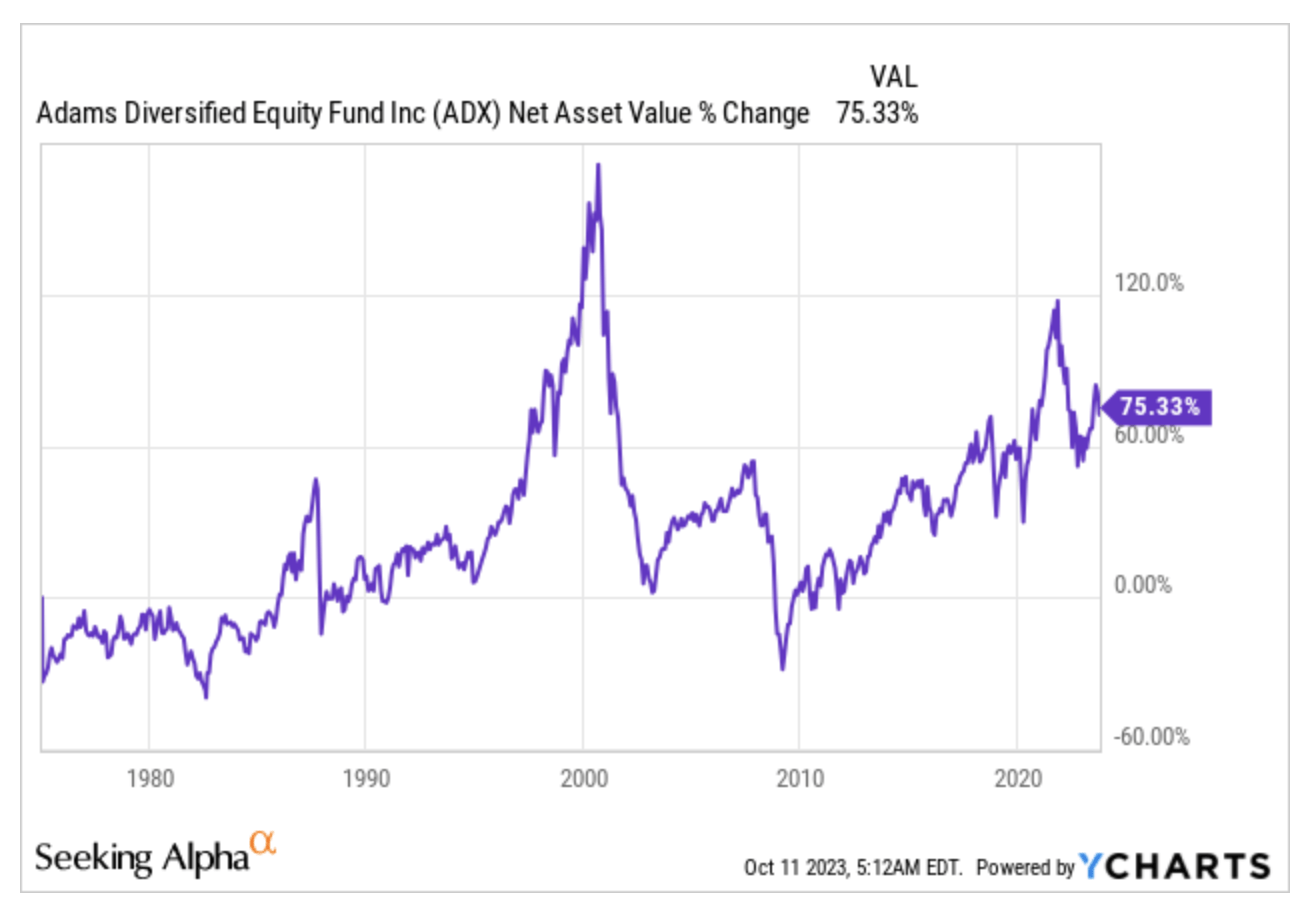
Adams Diversified Equity Fund
Morningstar Category: Large Blend
Market Value: $2.0 Bil
Total Leverage Ratio: 0.00%
Last Actual Disc/Prem: -15.05%
Total Dist. Rate: 1.19% (quarterly, plus year-end distribution)
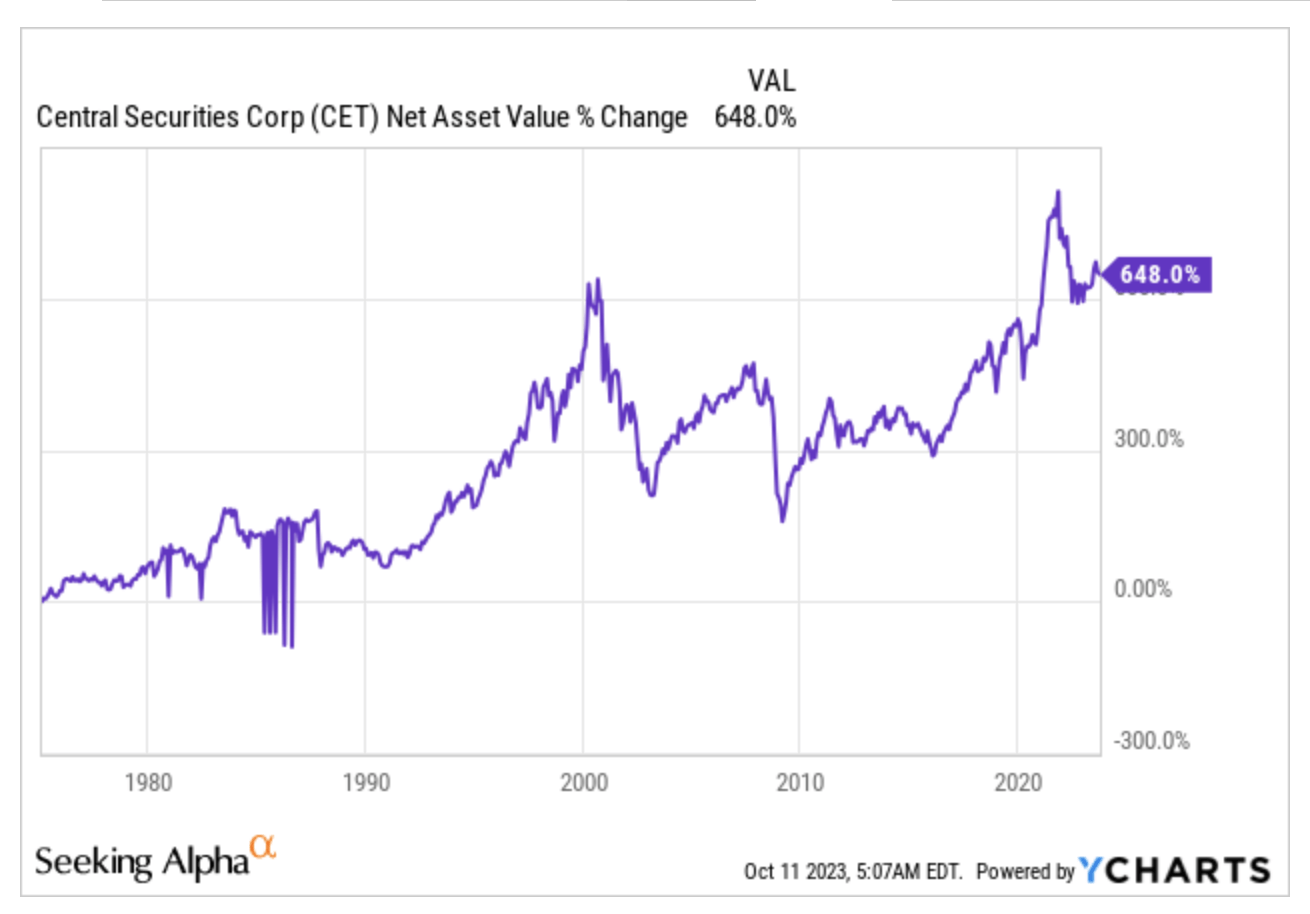
Central Securities Corporation
Morningstar Category: Large Blend
Market Value: $1.0 Bil
Total Leverage Ratio: 0.32%
Last Actual Disc/Prem: -17.50%
Total Dist. Rate: 1.11% (semi-annual, plus year-end distribution)
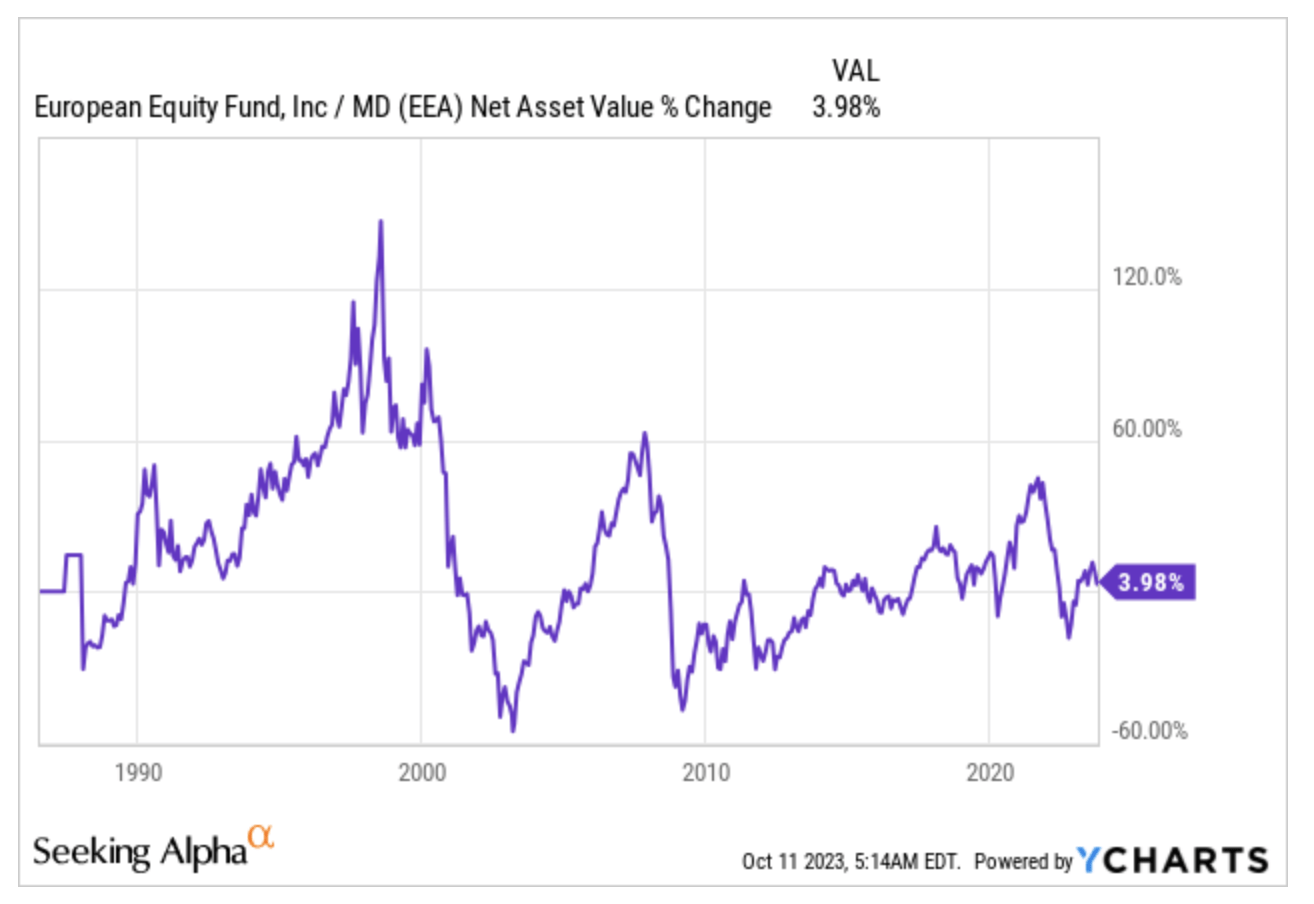
European Equity Fund
Morningstar Category: Europe Stock
Market Value: $55 Mil
Total Leverage Ratio: 2.38%
Last Actual Disc/Prem: -17.44%
Total Dist. Rate: 0.81% (semi-annual, plus year-end distribution)
Templeton Emerging Markets Fund
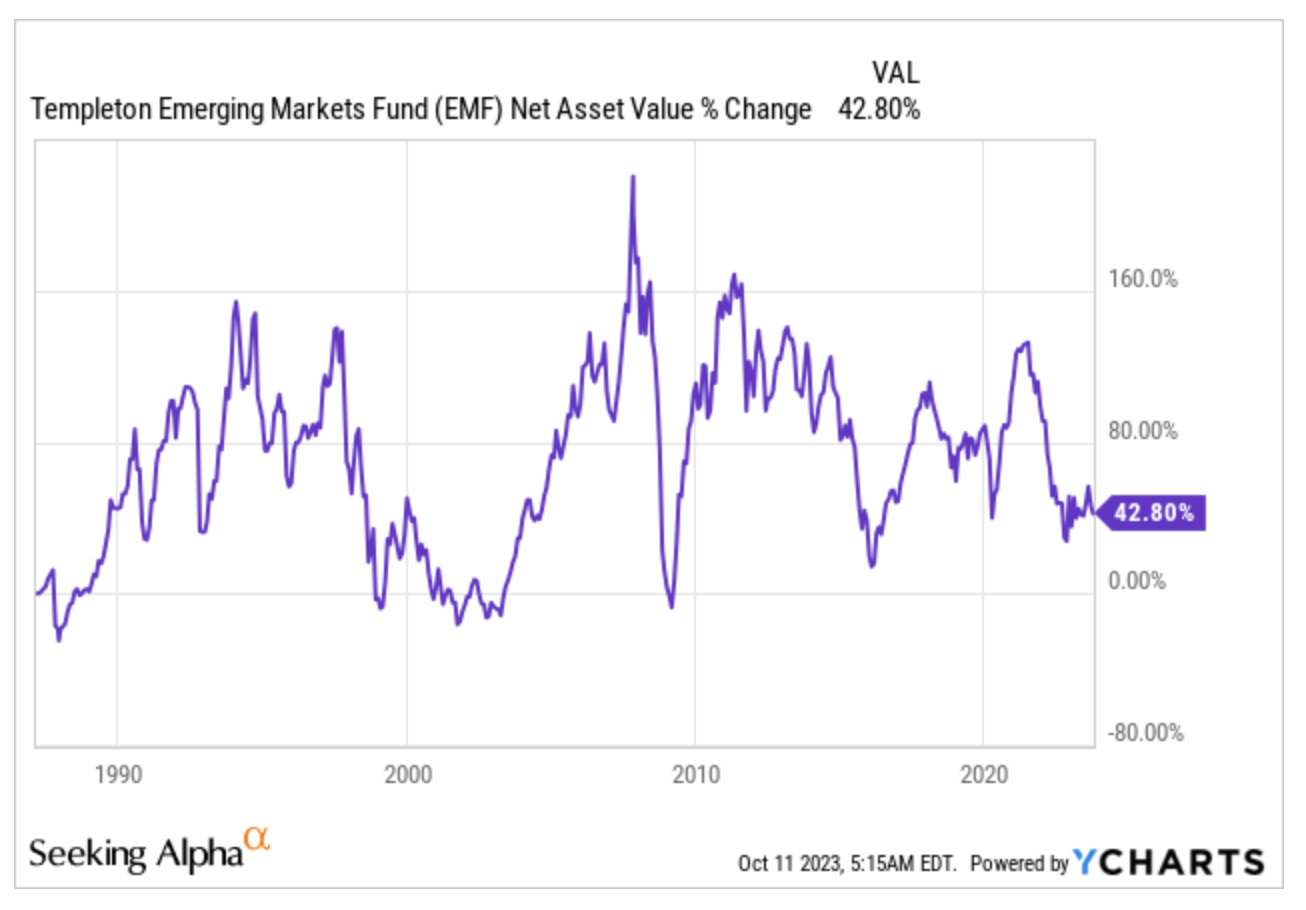
Morningstar Category: Diversified Emerging Mkts
Market Value: $177.1 Mil
Total Leverage Ratio: 4.57%
Last Actual Disc/Prem: -15.14%
Total Dist. Rate: 10.02% (2022 year-end distribution)
General American Investors Company
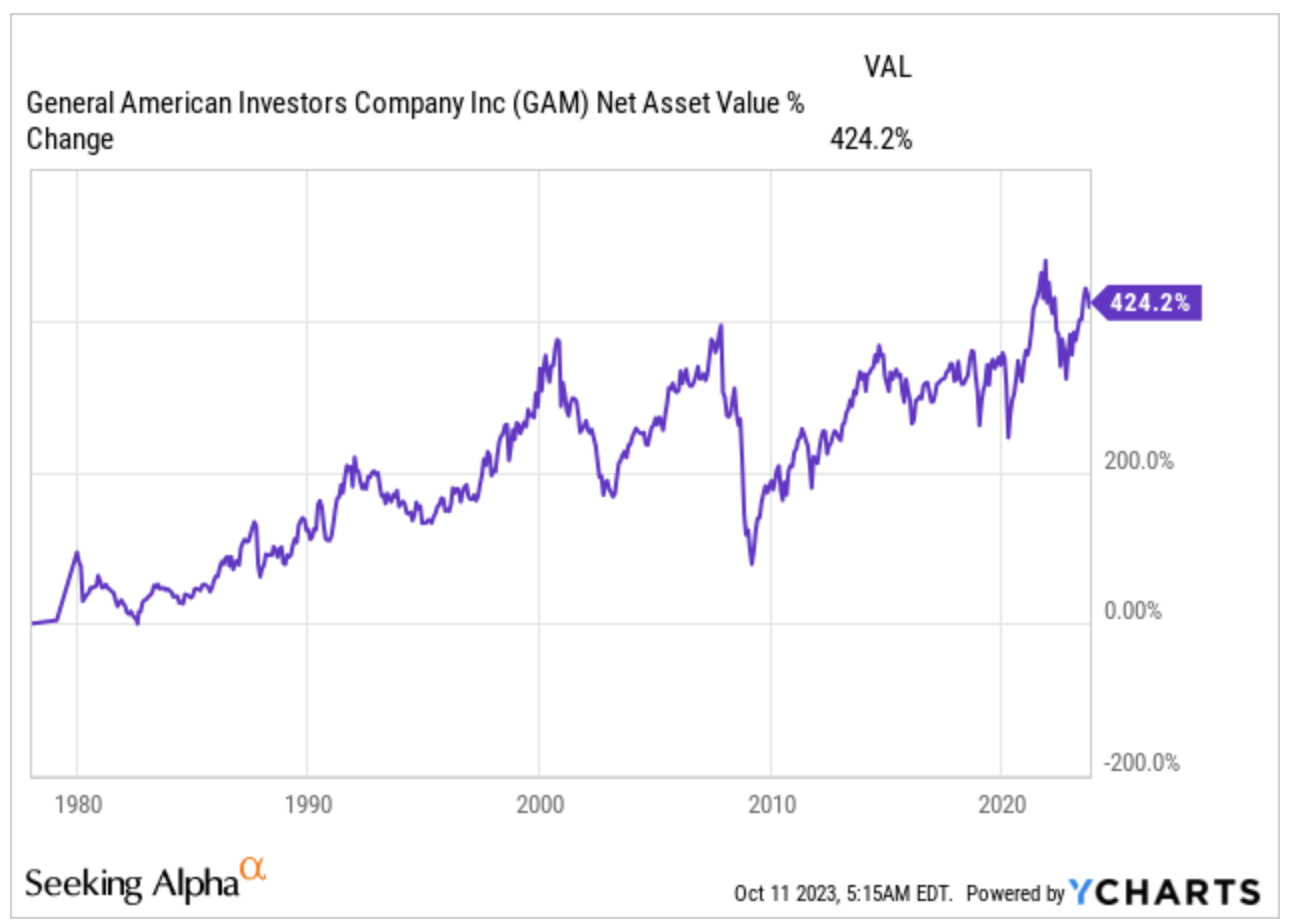
Morningstar Category: Large Blend
Market Value: $987.4 Mil
Total Leverage Ratio: 13.75%
Last Actual Disc/Prem: -17.17%
Total Dist. Rate: 2.41% (semi-annual, plus year-end distribution)
Eagle Capital Growth Fund
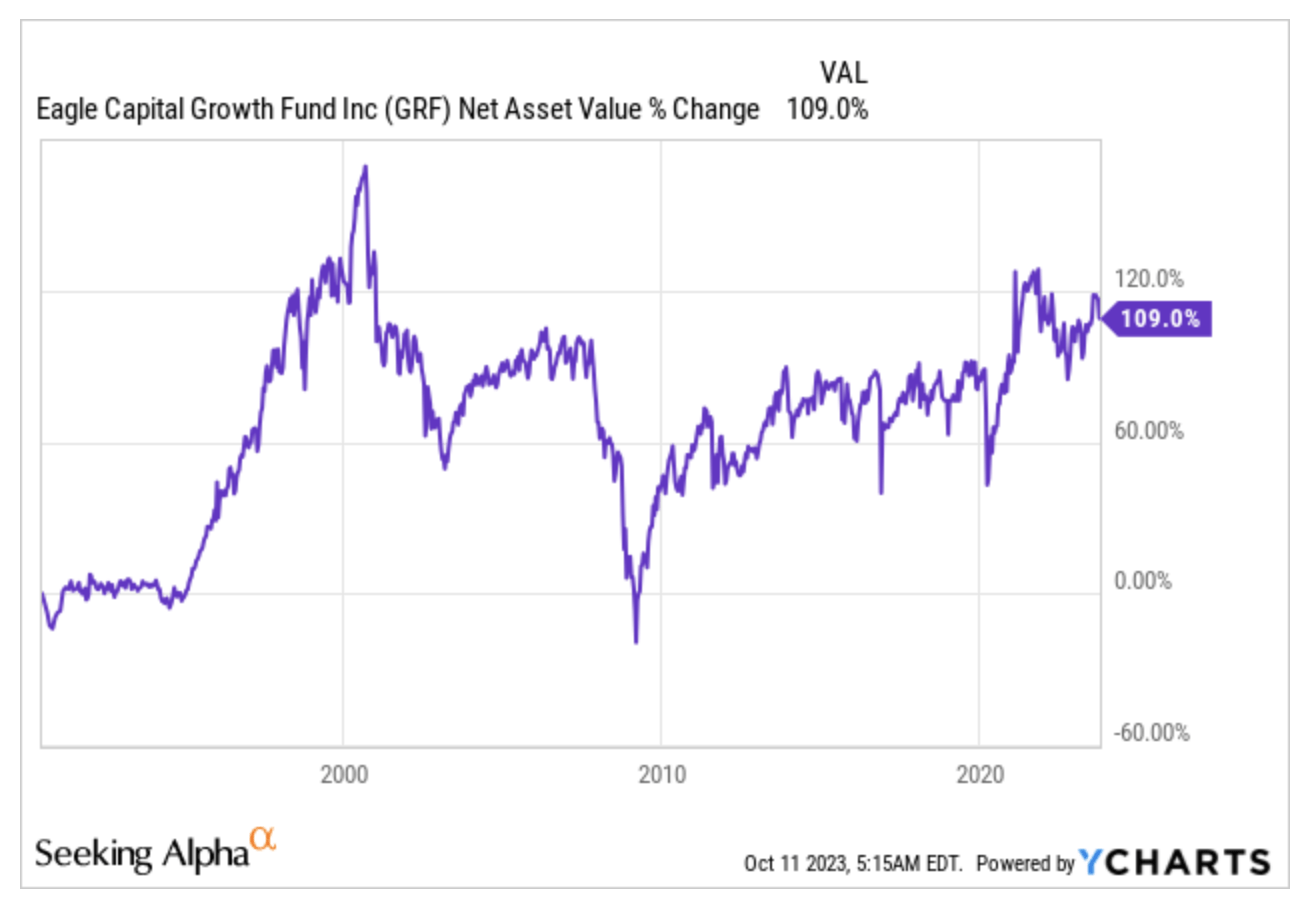
Morningstar Category: Large Blend
Market Value: $33.4 Mil
Total Leverage Ratio: -
Last Actual Disc/Prem: -18.65%
Total Dist. Rate: 4.39% (2022 year-end distribution)
Morgan Stanley India Investment Fund
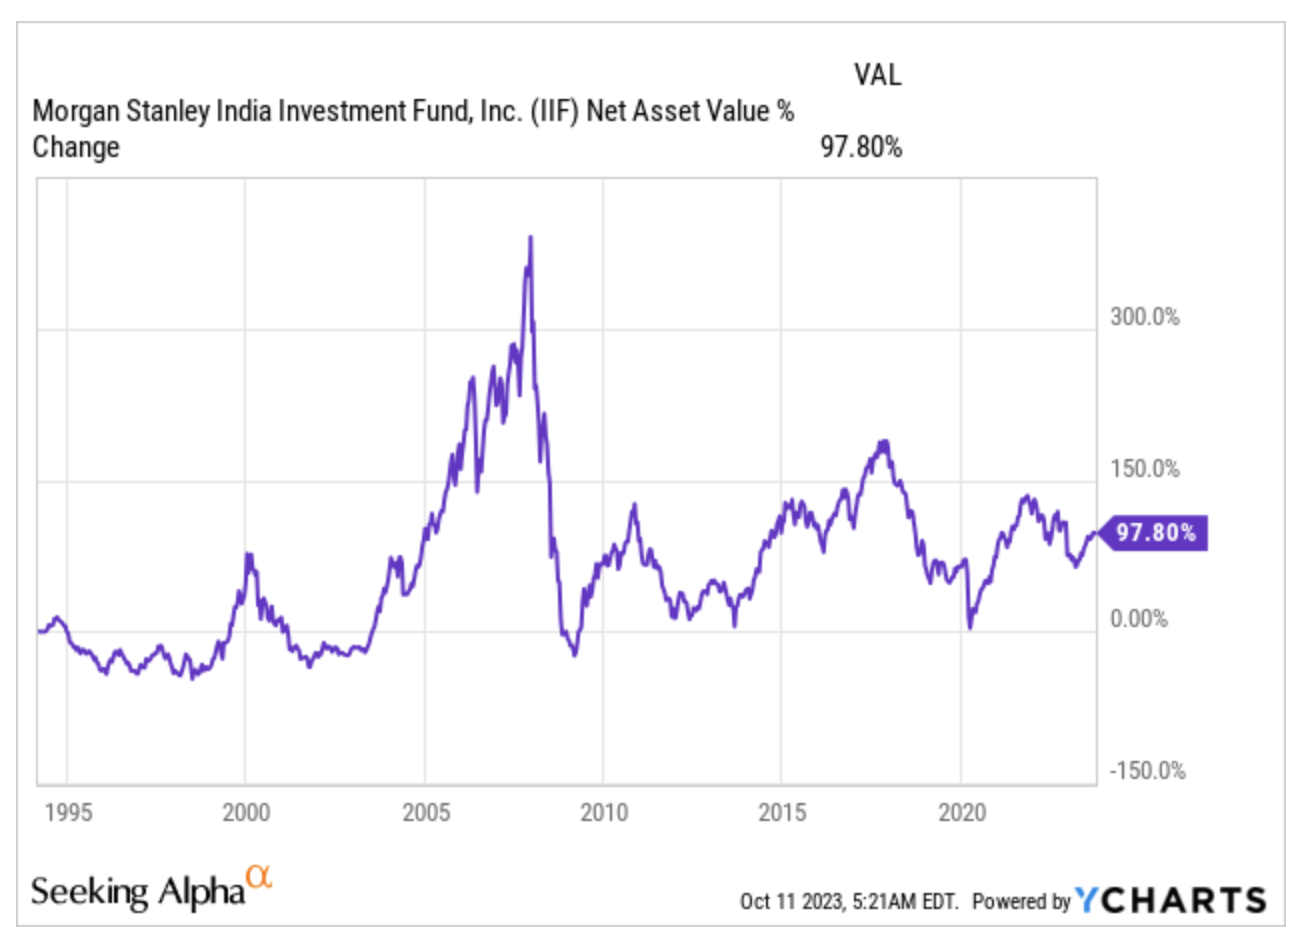
Morningstar Category: India Equity Blend
Market Value: $226.2 Mil
Total Leverage Ratio: -
Last Actual Disc/Prem: -19.70%
Total Dist. Rate: 17.86% (2022 year-end distribution)
Adams Natural Resources Fund
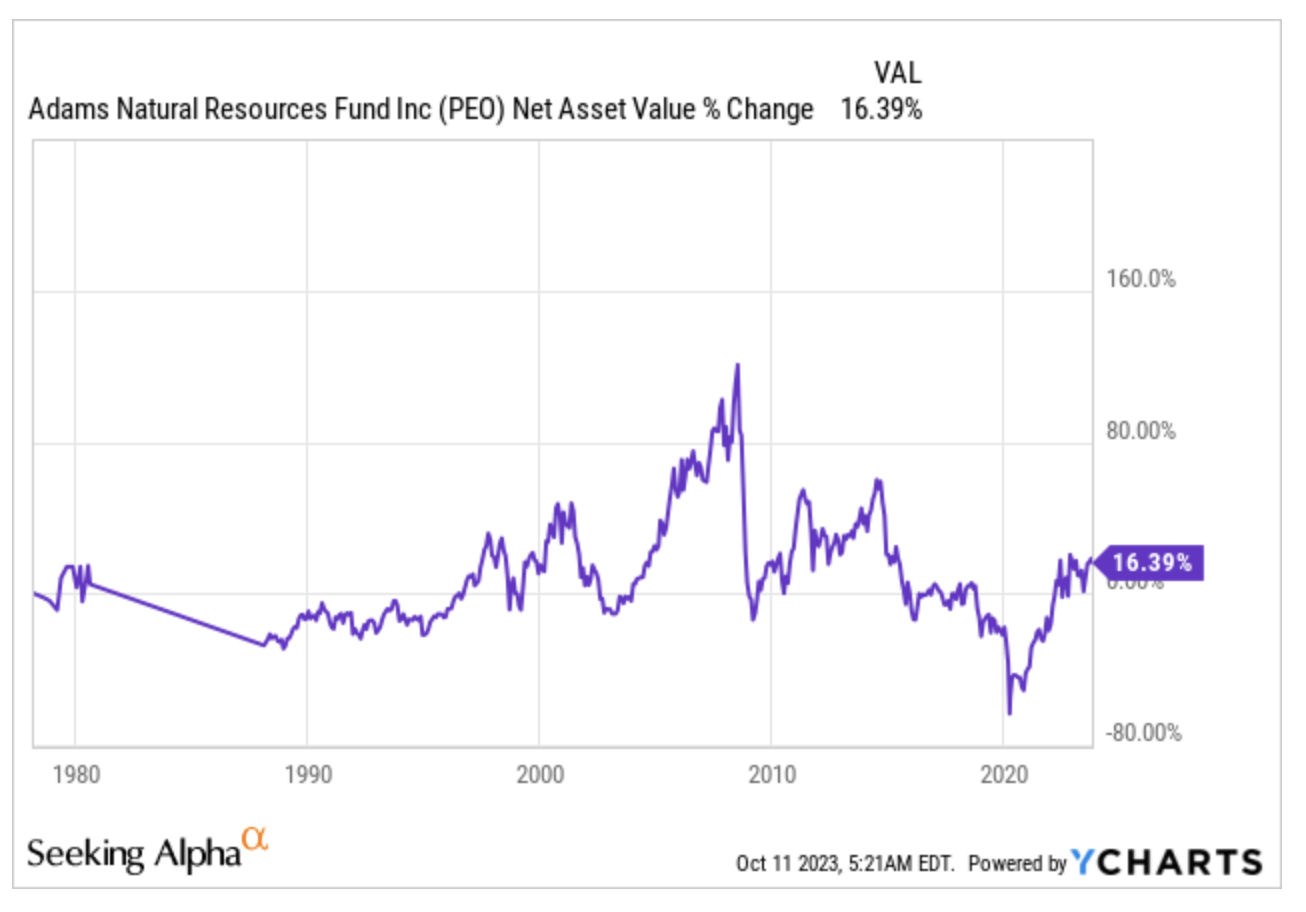
Morningstar Category: Equity Energy
Market Value: $551.0 Mil
Total Leverage Ratio: 0.70%
Last Actual Disc/Prem: -16.34%
Total Dist. Rate: 1.82% (quarterly, plus year-end distribution)
18 CEFs with Quarterly Distributions
Eighteen, on the other hand, are the quarterly distribution CEFs with a positive NAV since launch, which are a very interesting category even though the frequency of payment is of course deferred over time compared to monthly distribution.
Personally, I have never preferred them over CEFs with monthly distribution, all in all wrong, because after buying some stocks with quarterly frequency I realized how much more relaxing the approach is in these cases, compared to the psychological pressure given by the monthly renewal of distribution declarations. Who knows why, but I imagine their managers are less pressed by deadlines and have more time to think: silly details, I admit, but nuances can also have their weight.
This is the list:
- ClearBridge MLP and Midstream Fund ( CEM )
- Sprott Focus Trust ( FUND )
- Gabelli Global Small & Mid Cap Value Trust ( GGZ )
- Gabelli Healthcare & WellnessRx Trust ( GRX )
- Tekla Healthcare Investors ( HQH )
- Tekla Life Sciences Investors ( HQL )
- The India Fund ( IFN )
- Barings Corporate Investors ( MCI )
- Barings Participation Investors ( MPV )
- Mexico Fund ( MXF )
- PIMCO Energy & Tactical Credit Opportunities ( NRGX )
- Nuveen Nasdaq 100 Dynamic Overwrite Fund ( QQQX )
- Royce Micro-Cap Trust ( RMT )
- Royce Value Trust ( RVT )
- SRH Total Return Fund ( STEW )
- Columbia Seligman Premium Technology Growth Fund ( STK )
- Swiss Helvetia Fund ( SWZ )
- Tri-Continental Corporation ( TY )
ClearBridge MLP and Midstream Fund
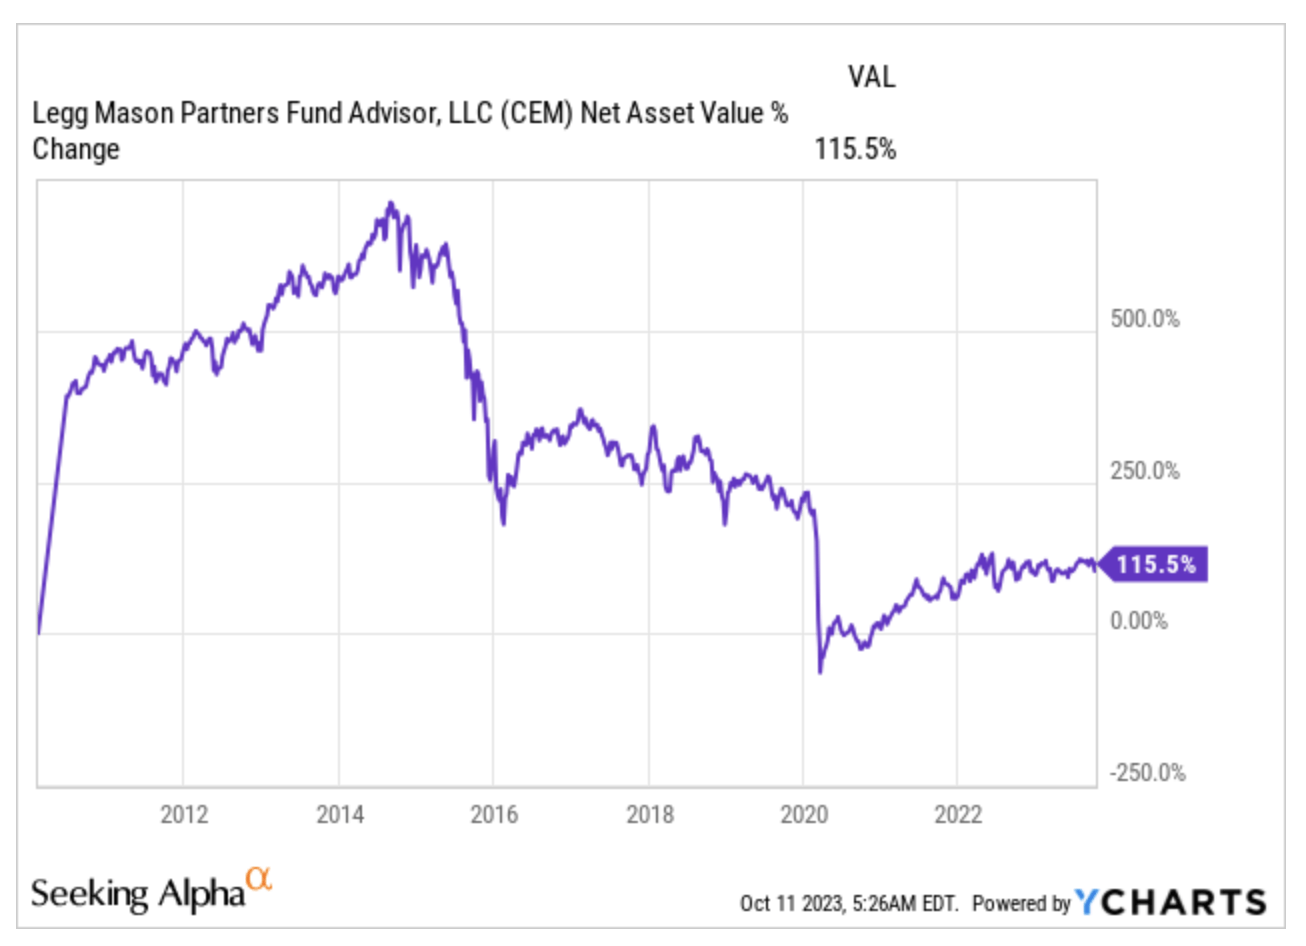
Morningstar Category: Energy Limited Partnership
Market Value: $476.3 Mil
Total Leverage Ratio: 31.35%
Last Actual Disc/Prem: -14.75%
Total Dist. Rate: 8.60%
Sprott Focus Trust
Morningstar Category: Mid-Cap Value
Market Value: $218.2 Mil
Total Leverage Ratio: 0.00%
Last Actual Disc/Prem: -9.21%
Total Dist. Rate: 6.74%
Gabelli Global Small & Mid Cap Value Trust
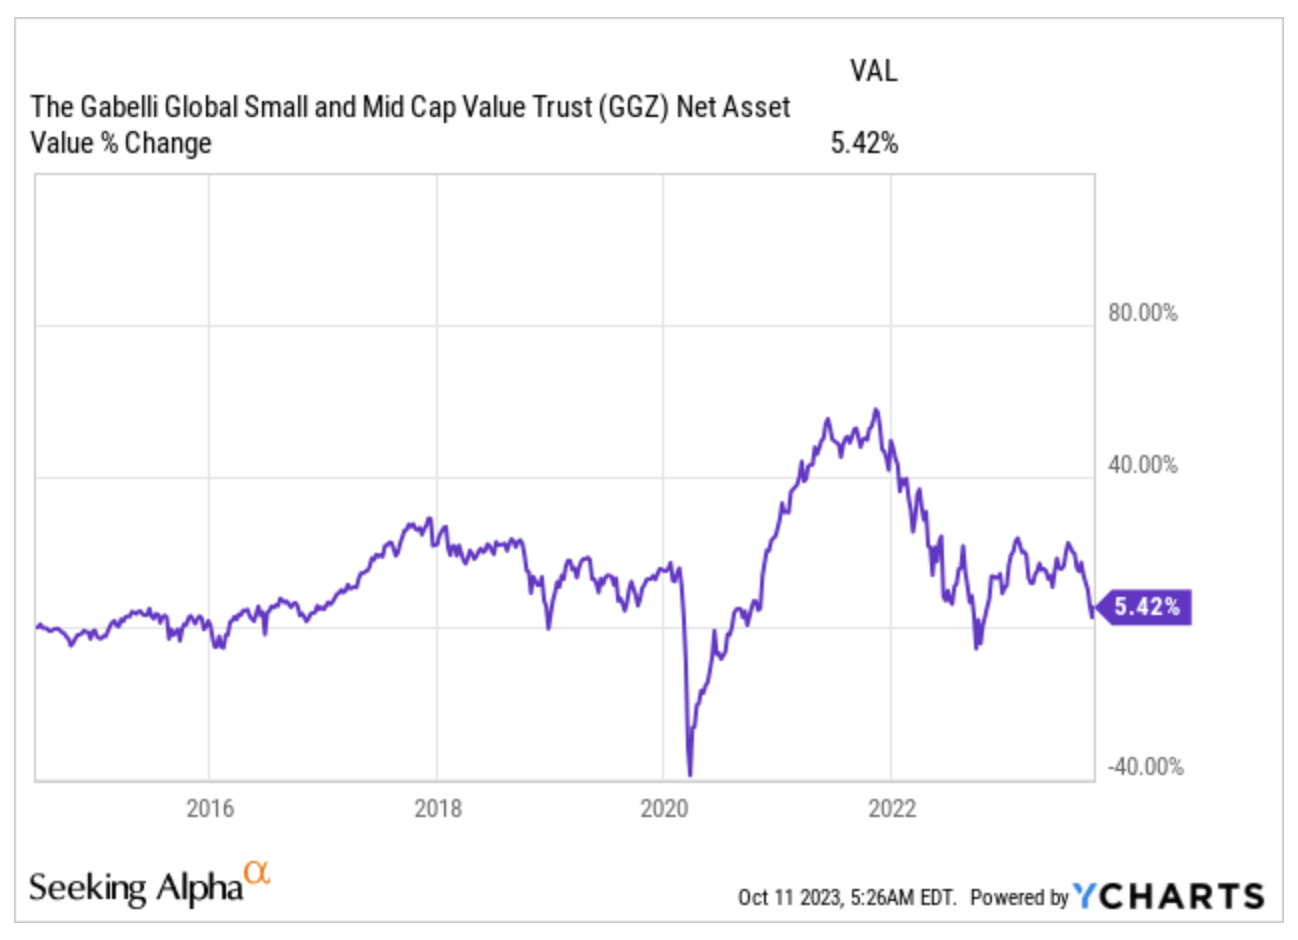
Morningstar Category: Global Small/Mid Stock
Market Value: $87.7 Mil
Total Leverage Ratio: 22.97%
Last Actual Disc/Prem: -18.31%
Total Dist. Rate: 6.29%
Gabelli Healthcare & WellnessRx Trust
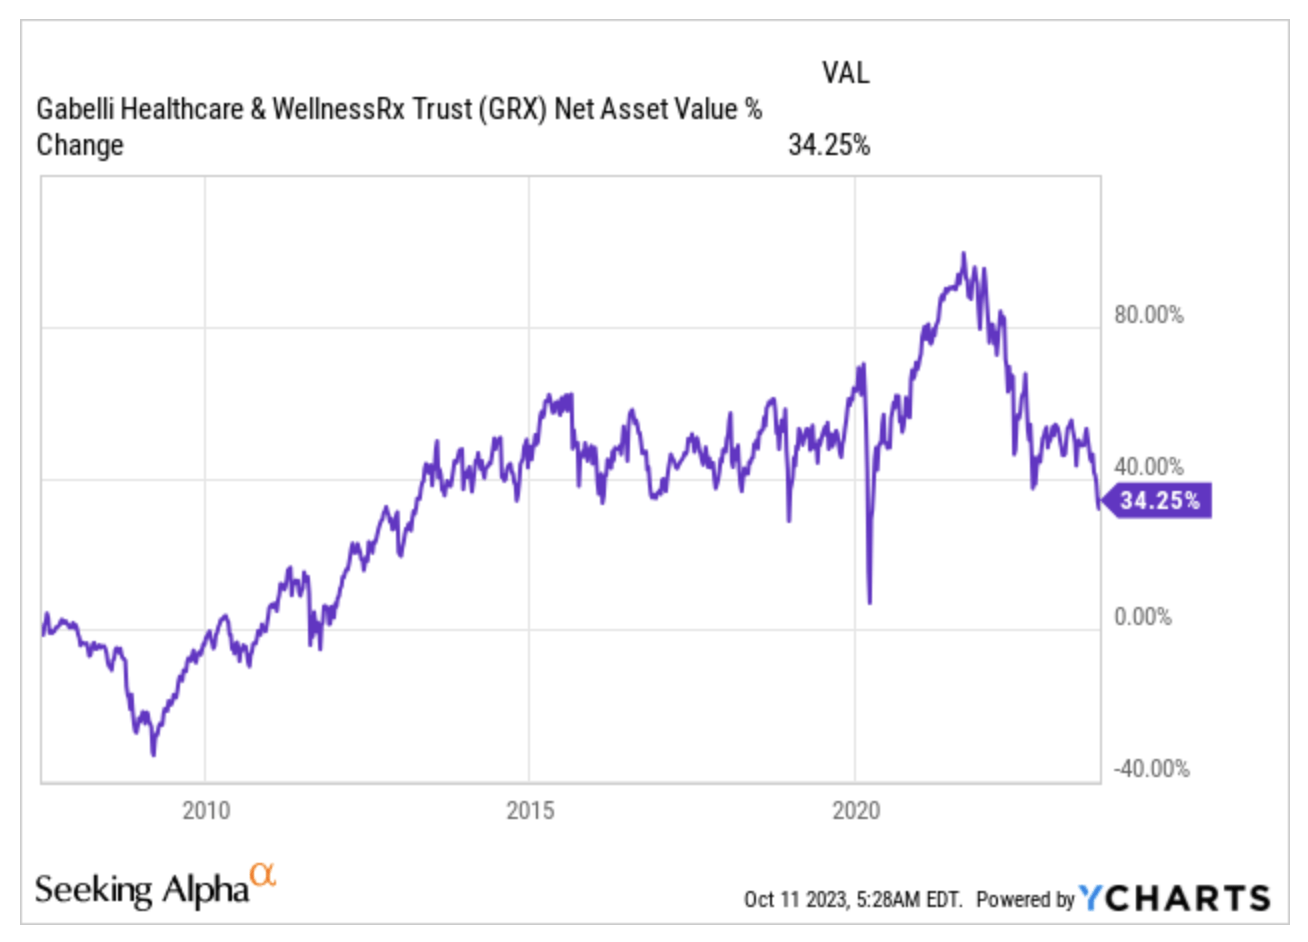
Morningstar Category: Health
Market Value: $138.1 Mil
Total Leverage Ratio: 27.22%
Last Actual Disc/Prem: -19.22%
Total Dist. Rate: 7.25%
Tekla Healthcare Investors
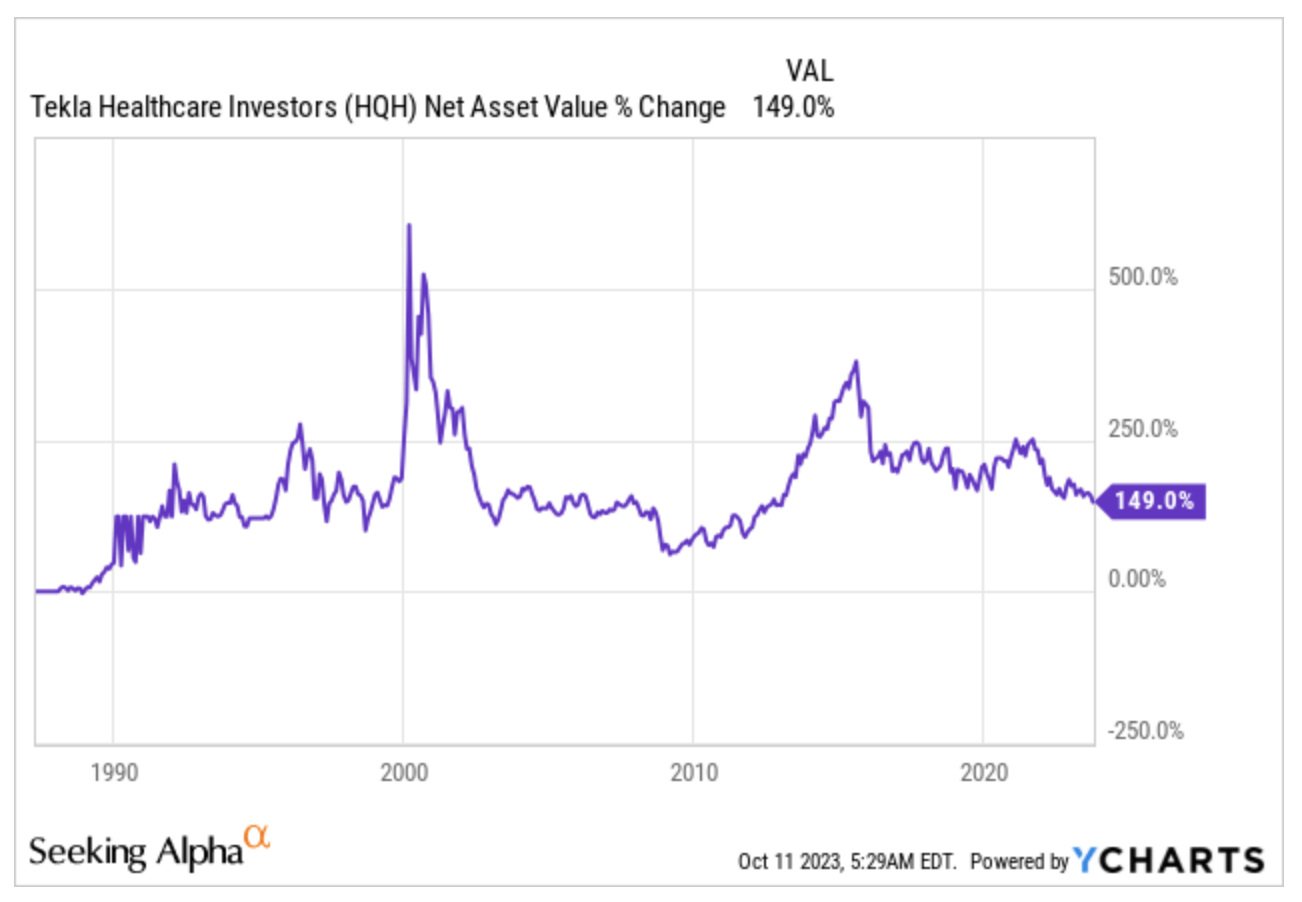
Morningstar Category: Health
Market Value: $765.4 Mil
Total Leverage Ratio: 1.11%
Last Actual Disc/Prem: -17.40%
Total Dist. Rate: 10.34%
Tekla Life Sciences Investors
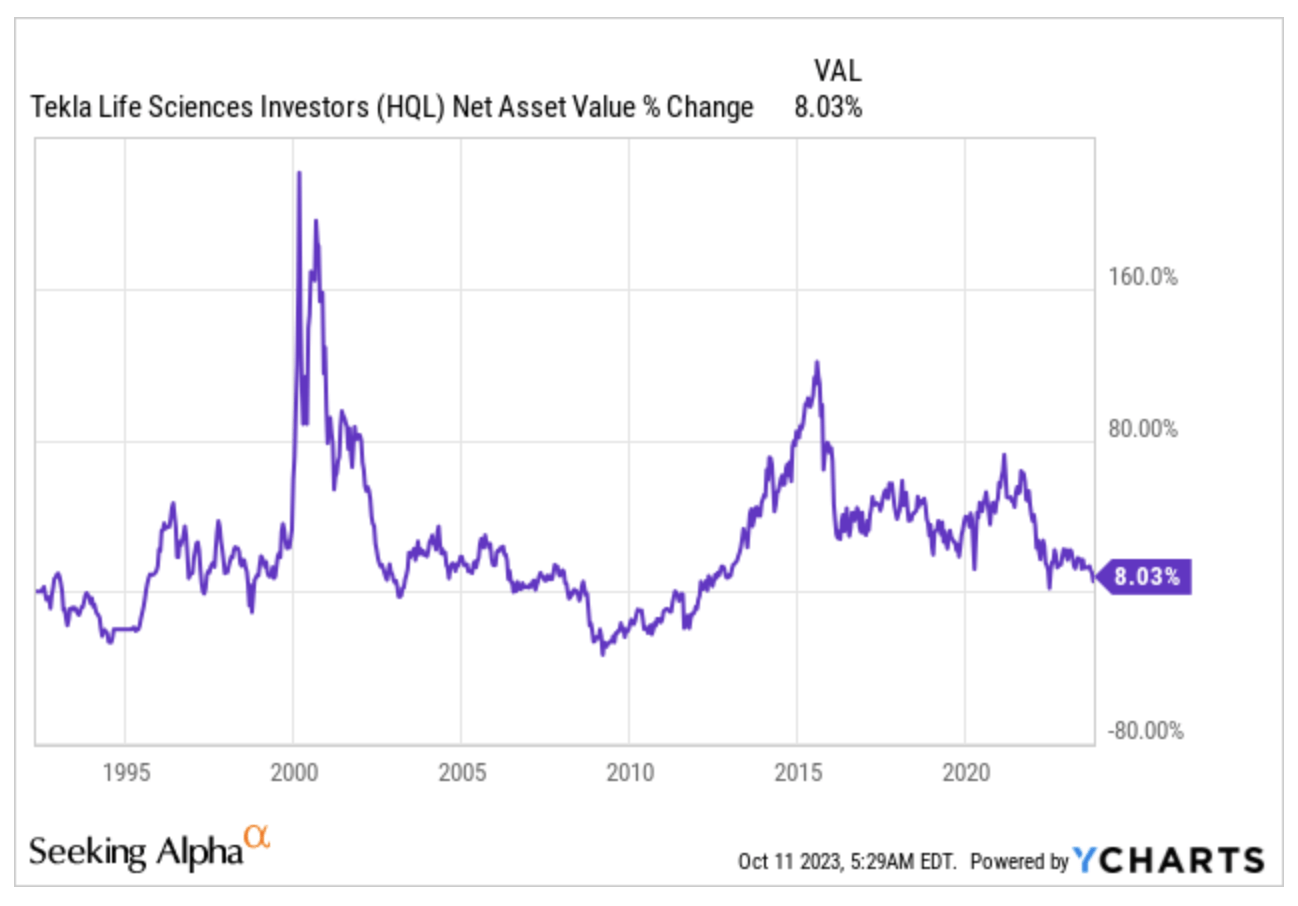
Morningstar Category: Health
Market Value: $328.7 Mil
Total Leverage Ratio: 2.28%
Last Actual Disc/Prem: -17.87%
Total Dist. Rate: 10.43%
The India Fund
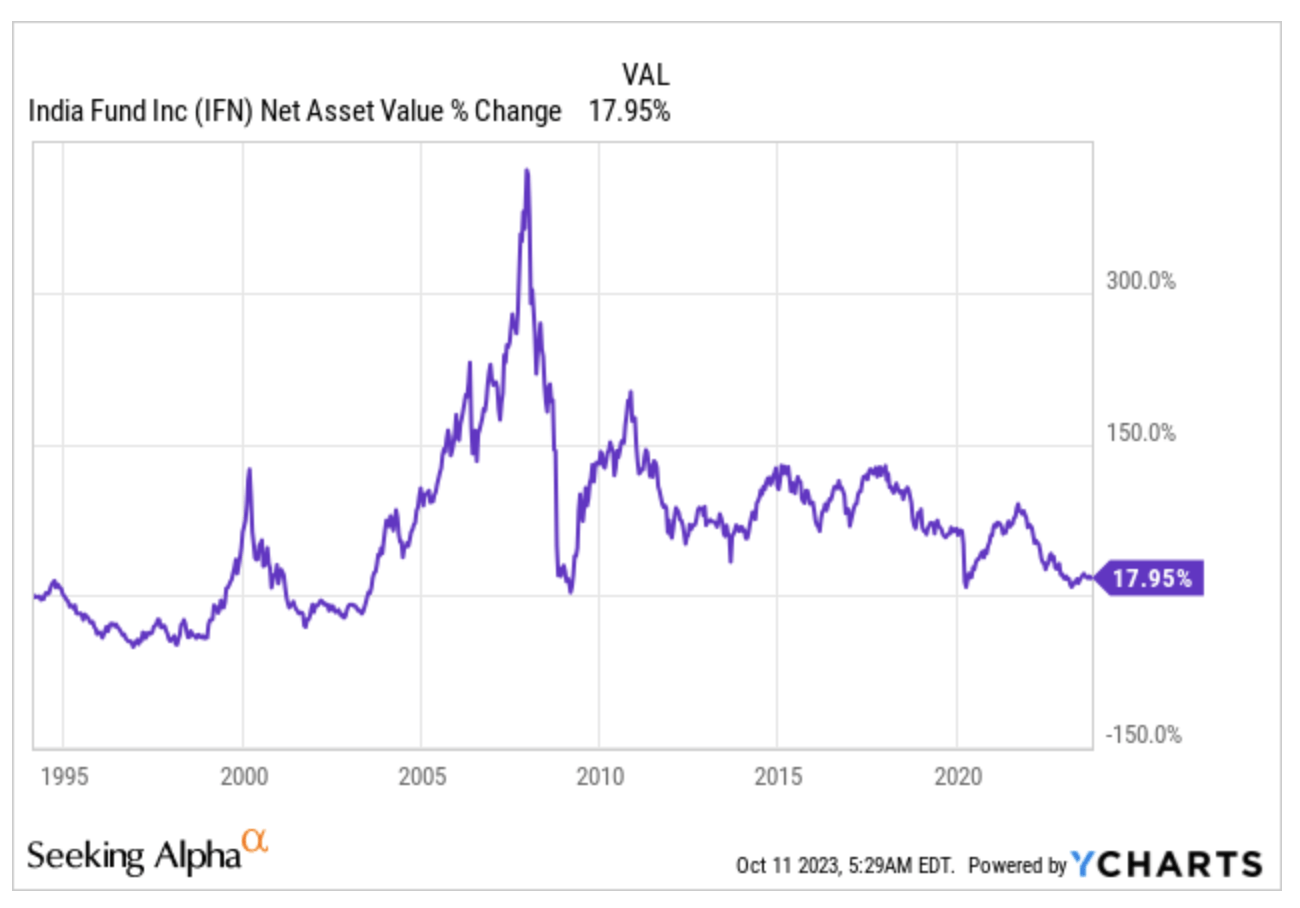
Morningstar Category: India Equity
Market Value: $515.8 Mil
Total Leverage Ratio: 0.28%
Last Actual Disc/Prem: 4.12%
Total Dist. Rate: 9.55%
Barings Corporate Investors
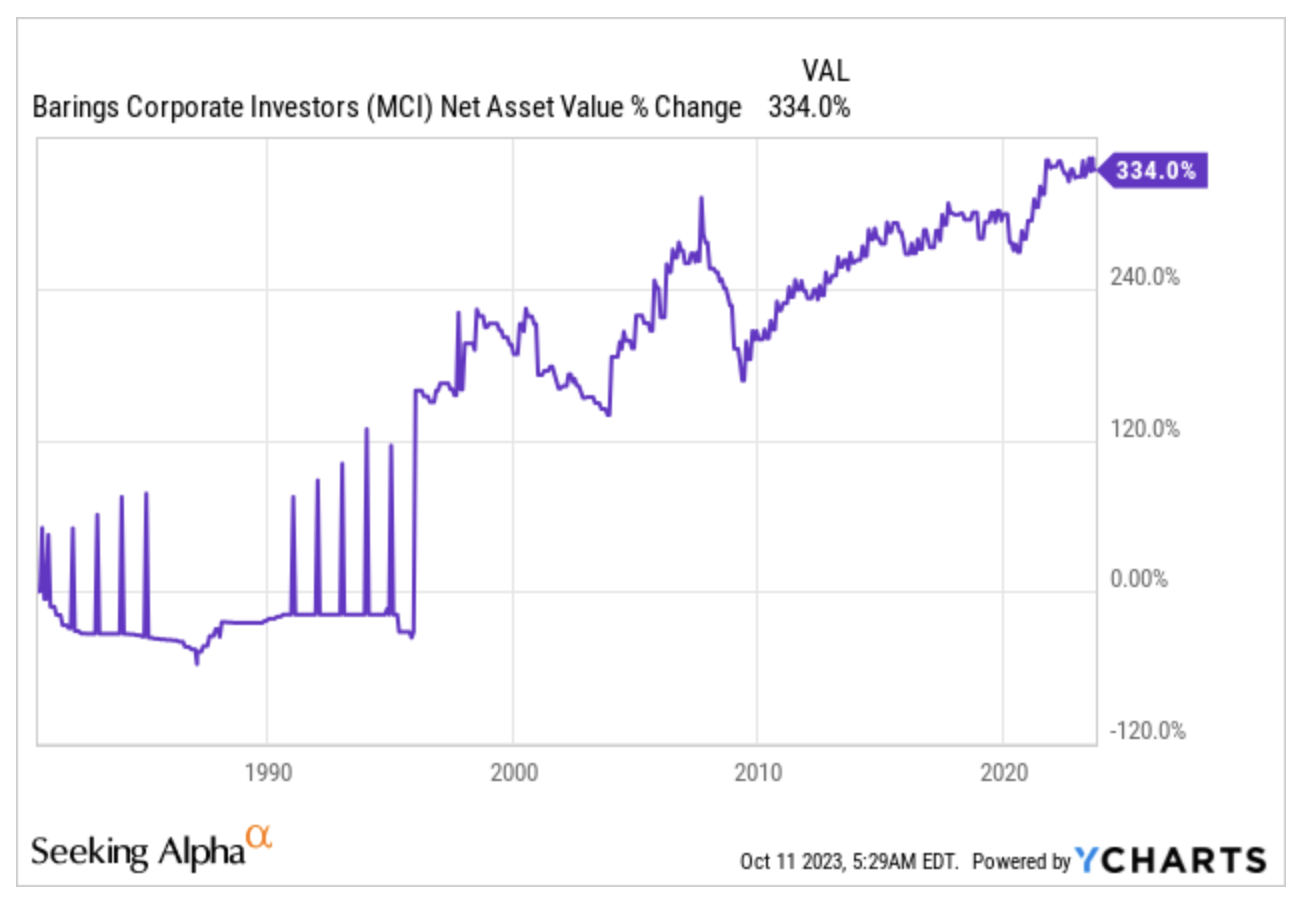
Morningstar Category: High Yield Bond
Market Value: $318.7 Mil
Total Leverage Ratio: 10.64%
Last Actual Disc/Prem: -5.13%
Total Dist. Rate: 9.41%
Barings Participation Investors
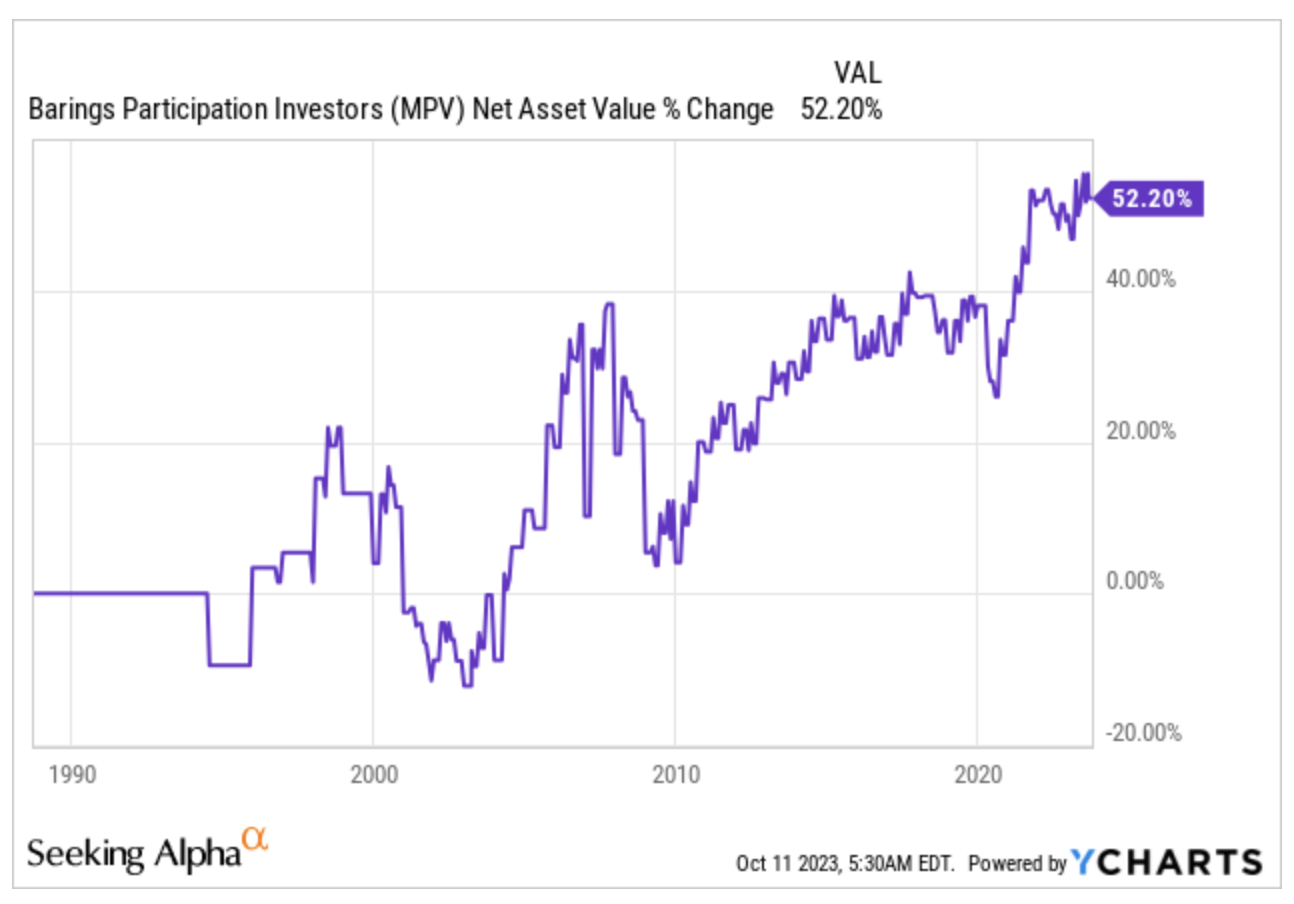
Morningstar Category: High Yield Bond
Market Value: $142.1 Mil
Total Leverage Ratio: 11.76%
Last Actual Disc/Prem: -11.96%
Total Dist. Rate: 10.15%
Mexico Fund
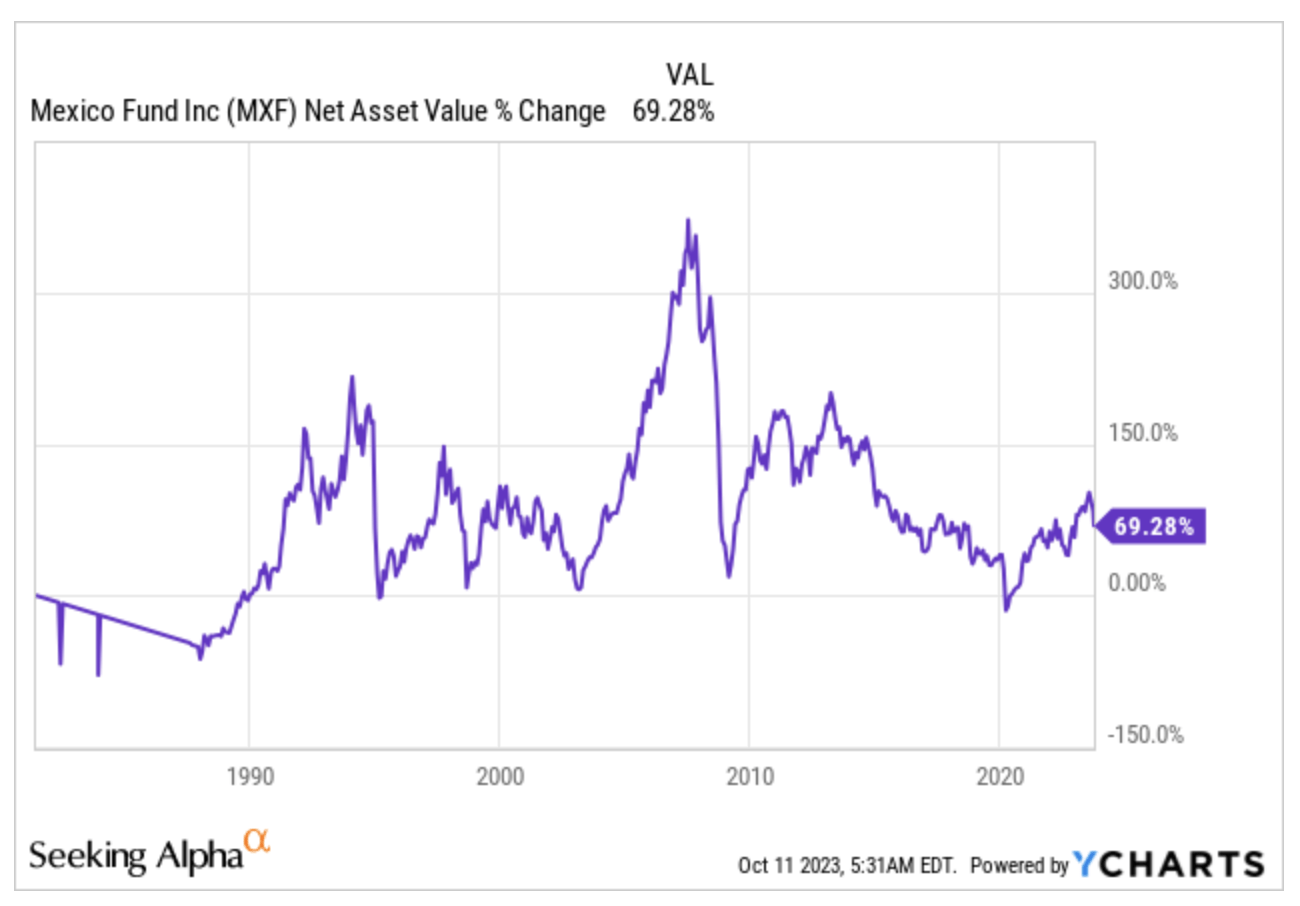
Morningstar Category: Miscellaneous Region
Market Value: $235.9 Mil
Total Leverage Ratio: -
Last Actual Disc/Prem: -19.14%
Total Dist. Rate: 5.09%
PIMCO Energy & Tactical Credit Opportunities
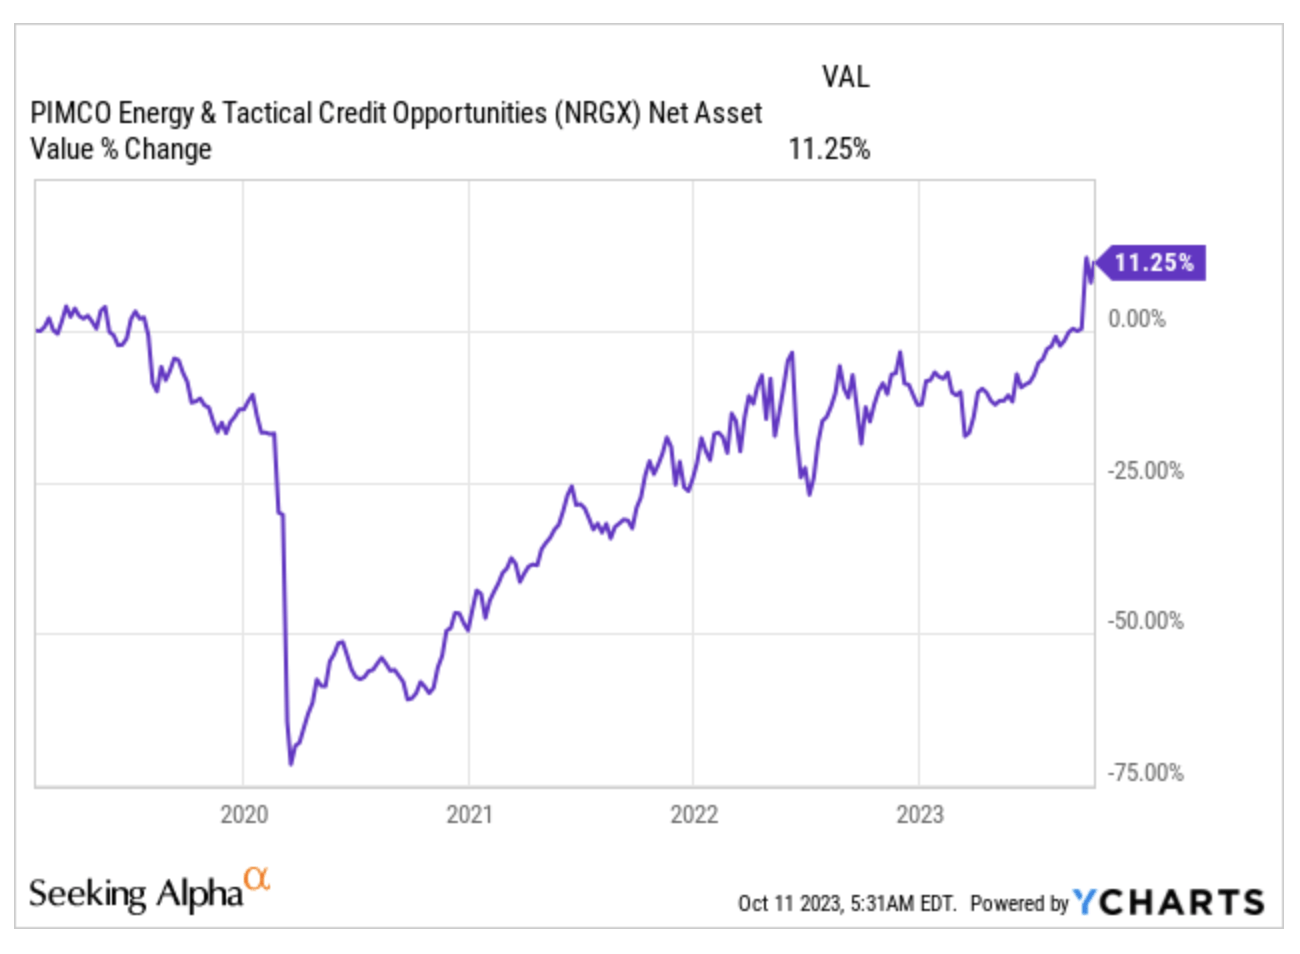
Morningstar Category: Energy Limited Partnership
Market Value: $844.1 Mil
Total Leverage Ratio: 13.22%
Last Actual Disc/Prem: -15.49%
Total Dist. Rate: 4.66%
Nuveen Nasdaq 100 Dynamic Overwrite Fund
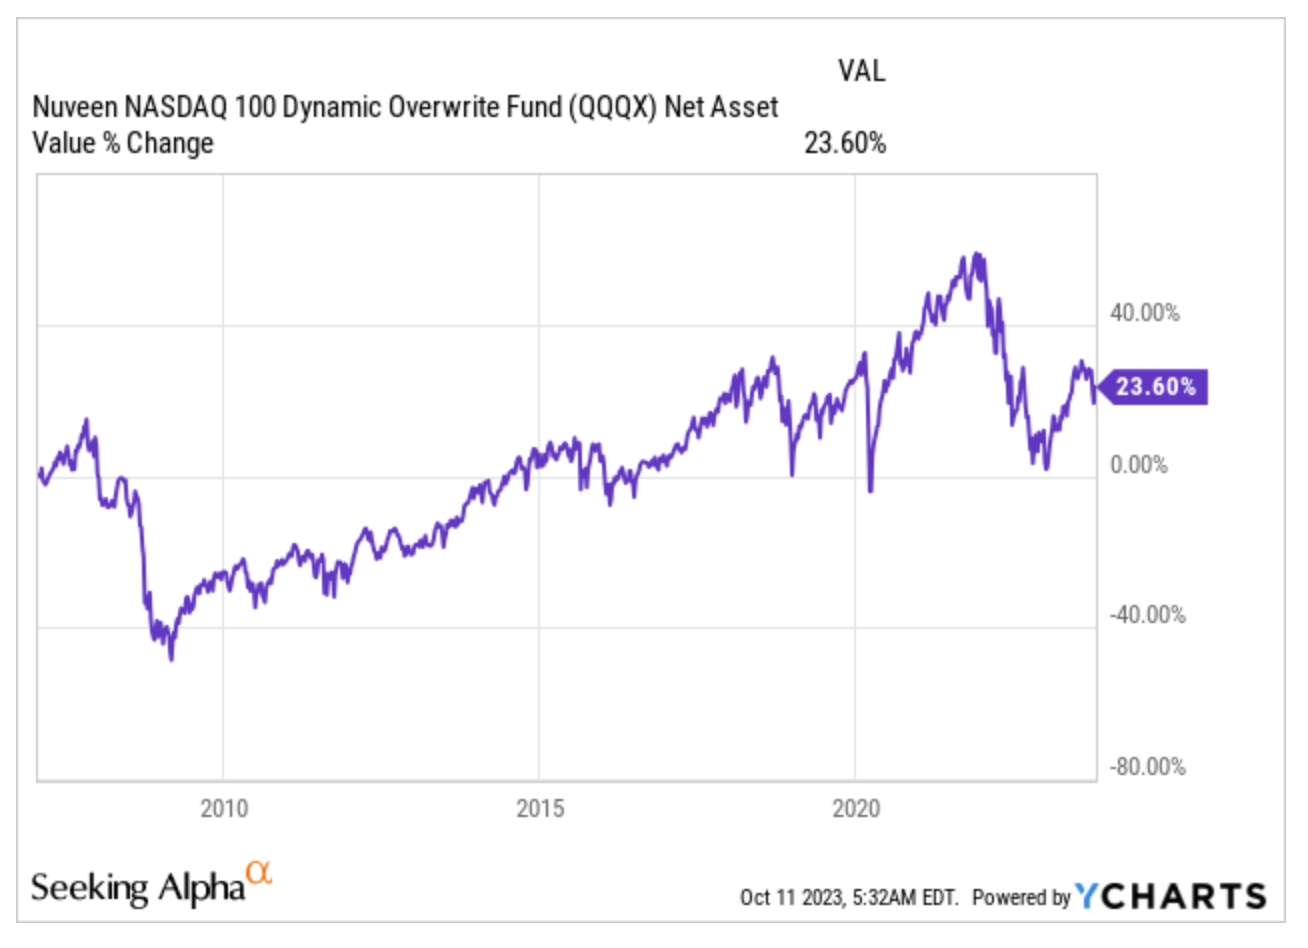
Morningstar Category: Derivative Income
Market Value: $1.1 Bil
Total Leverage Ratio: -
Last Actual Disc/Prem: -5.28%
Total Dist. Rate: 7.49%
Royce Micro-Cap Trust
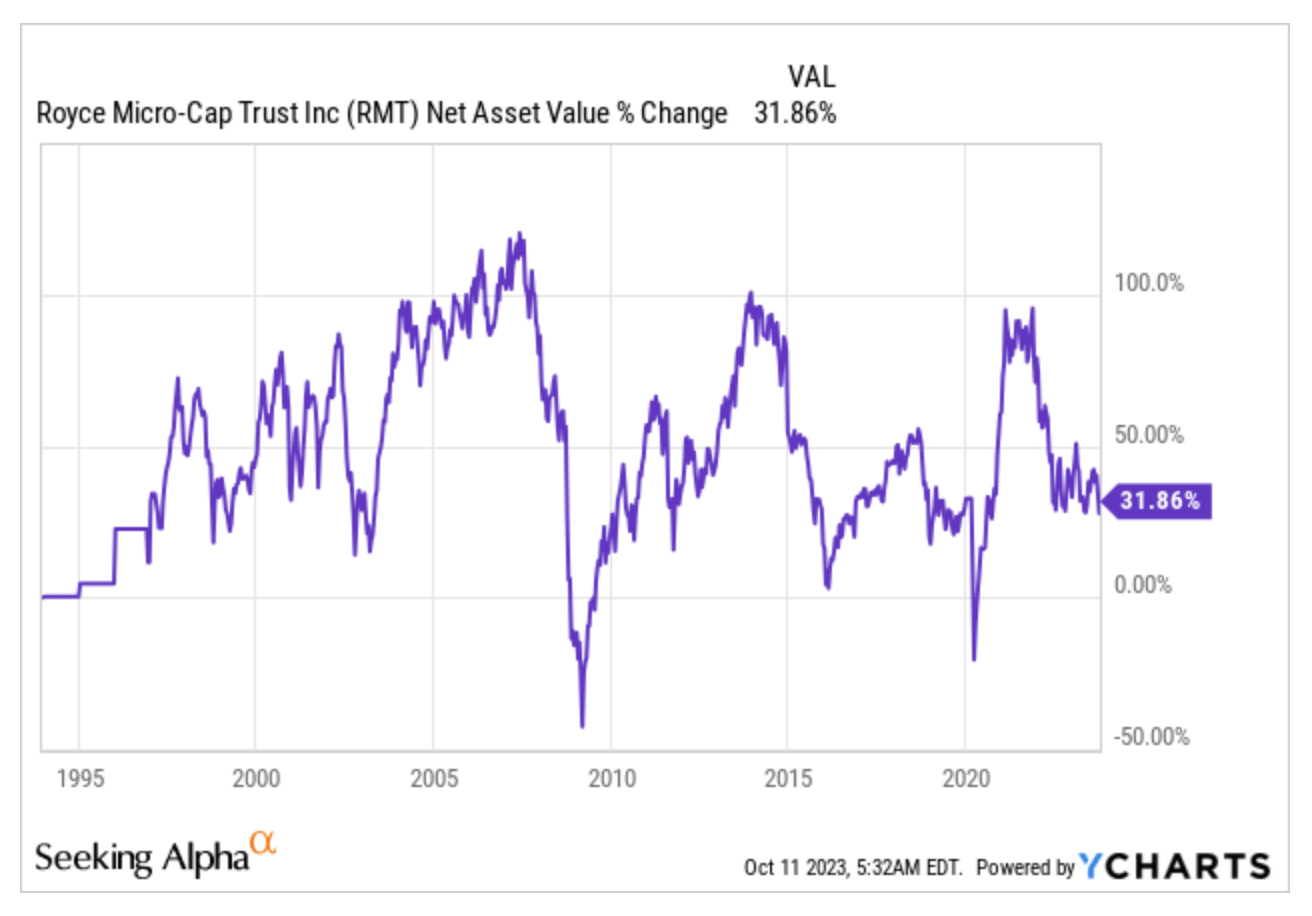
Morningstar Category: Small Blend
Market Value: $395.9 Mil
Total Leverage Ratio: 4.61%
Last Actual Disc/Prem: -13.03%
Total Dist. Rate: 8.35%
Royce Value Trust
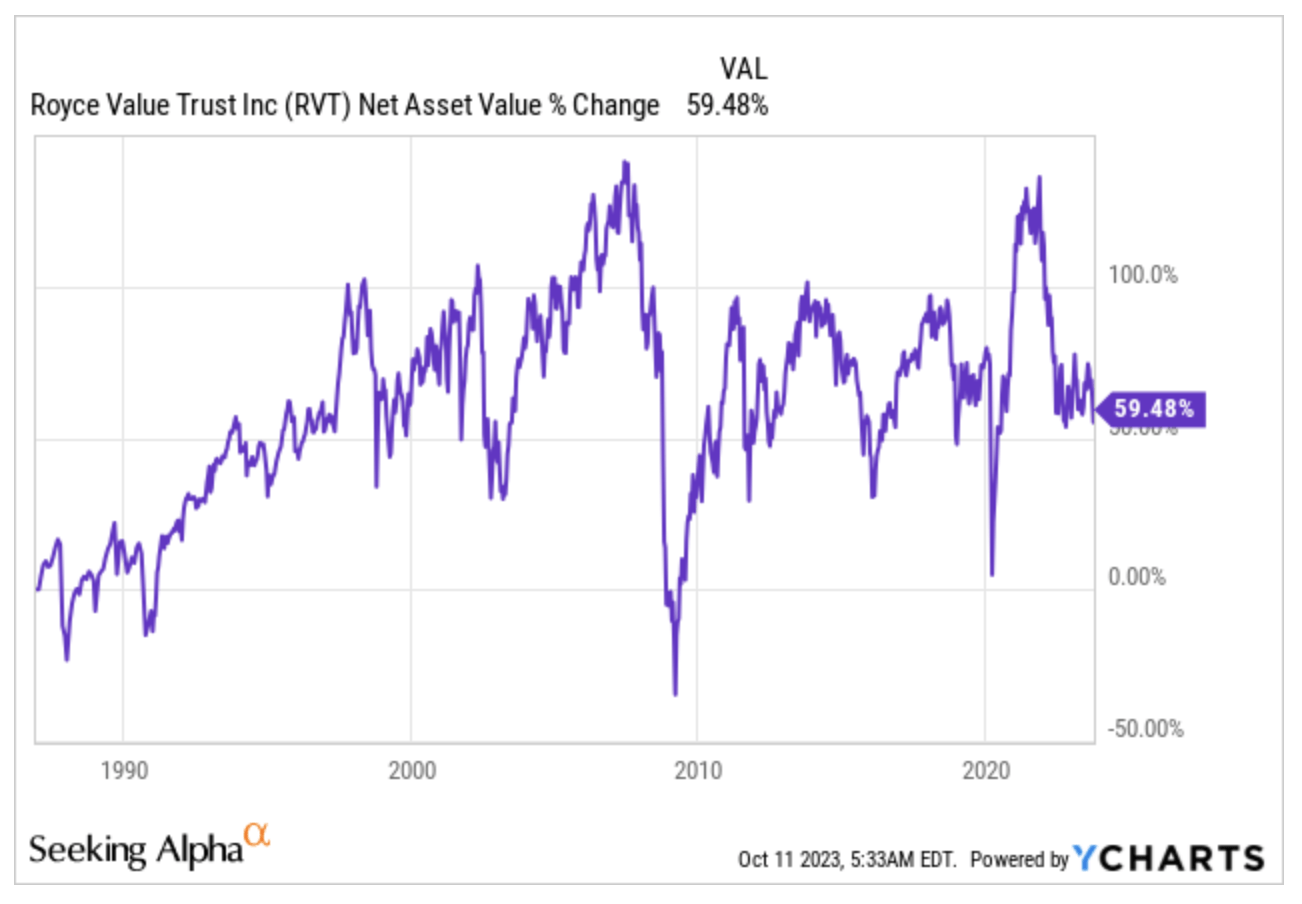
Morningstar Category: Small Blend
Market Value: $1.4 Bil
Total Leverage Ratio: 2.11%
Last Actual Disc/Prem: -13.40%
Total Dist. Rate: 8.25%
SRH Total Return Fund
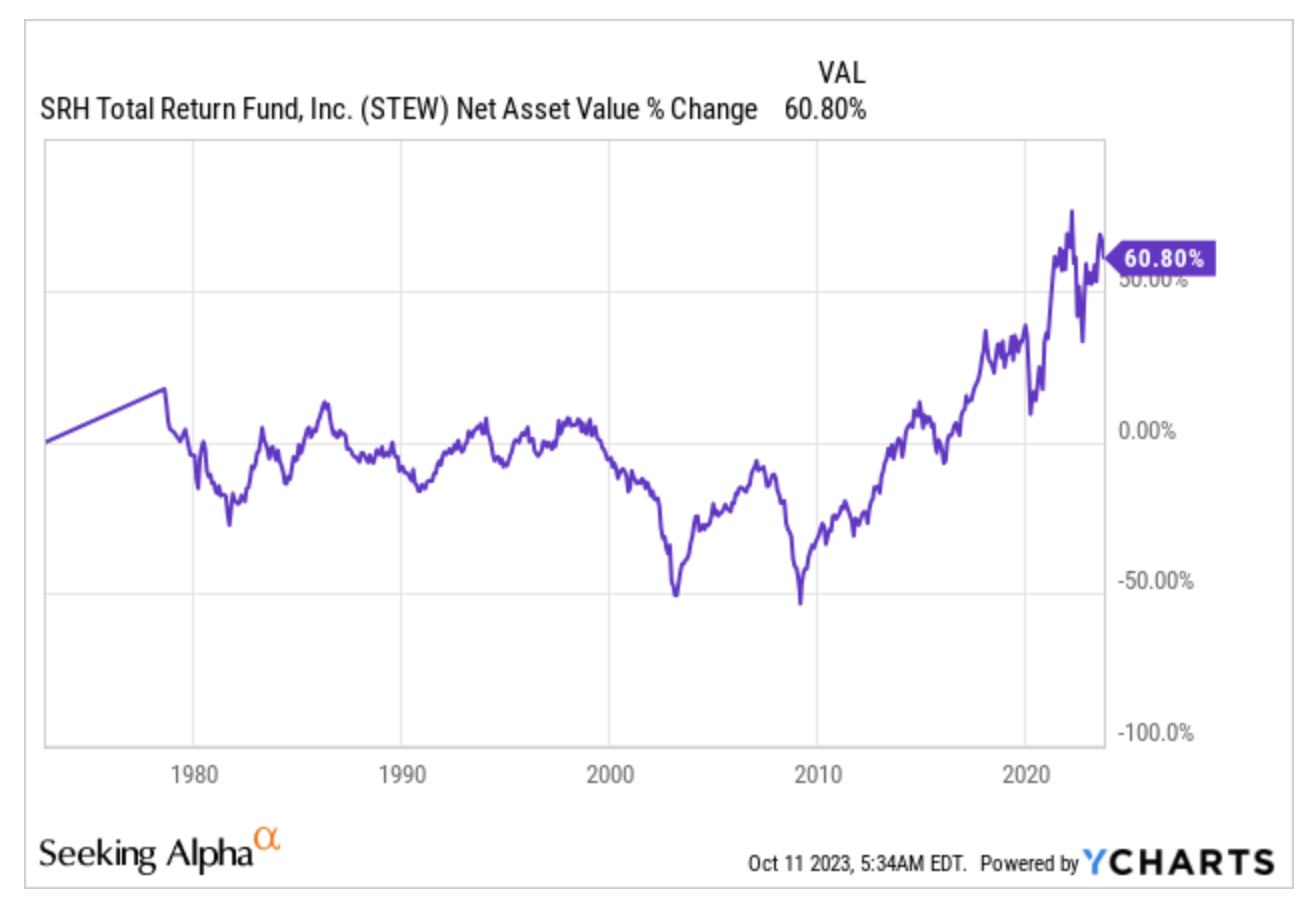
Morningstar Category: Financial
Market Value: $1.3 Bil
Total Leverage Ratio: 12.56%
Last Actual Disc/Prem: -18.99%
Total Dist. Rate: 3.86%
Columbia Seligman Premium Technology Growth Fund
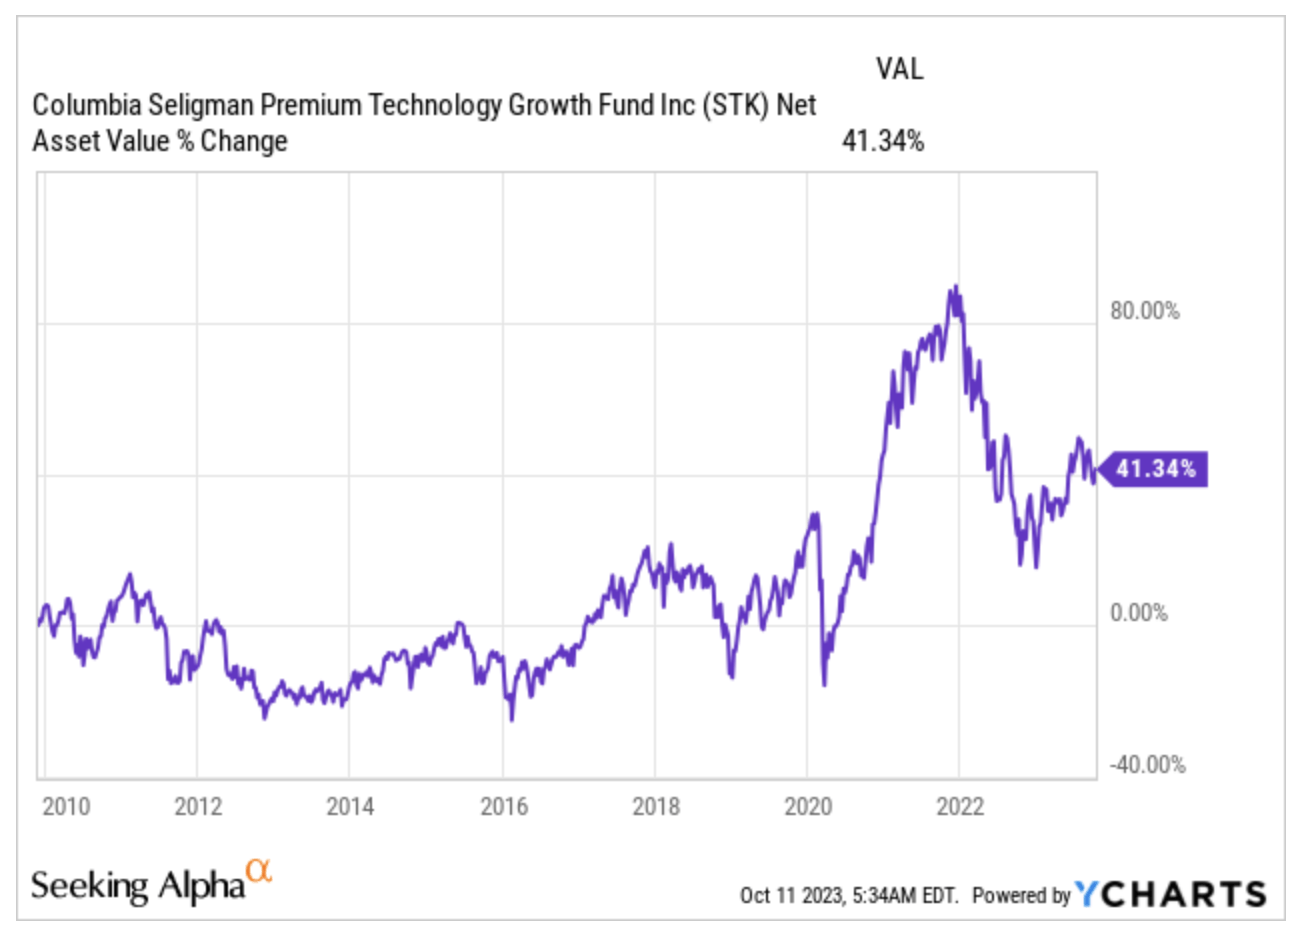
Morningstar Category: Technology
Market Value: $454.4 Mil
Total Leverage Ratio: -
Last Actual Disc/Prem: 1.62%
Total Dist. Rate: 6.71%
Swiss Helvetia Fund
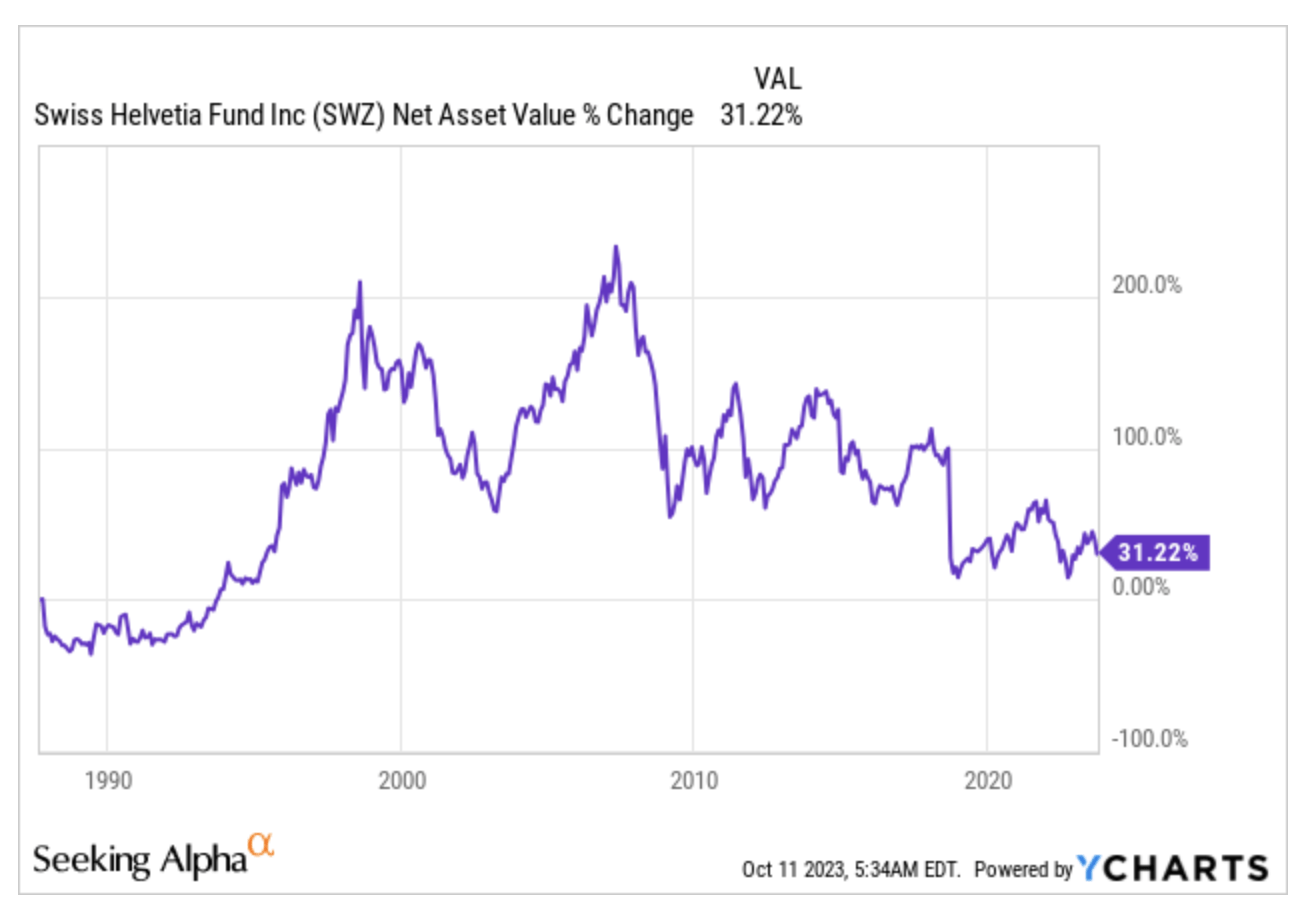
Morningstar Category: Miscellaneous Region
Market Value: $98.3 Mil
Total Leverage Ratio: -
Last Actual Disc/Prem: -16.72%
Total Dist. Rate: 6.49%
Tri-Continental Corporation
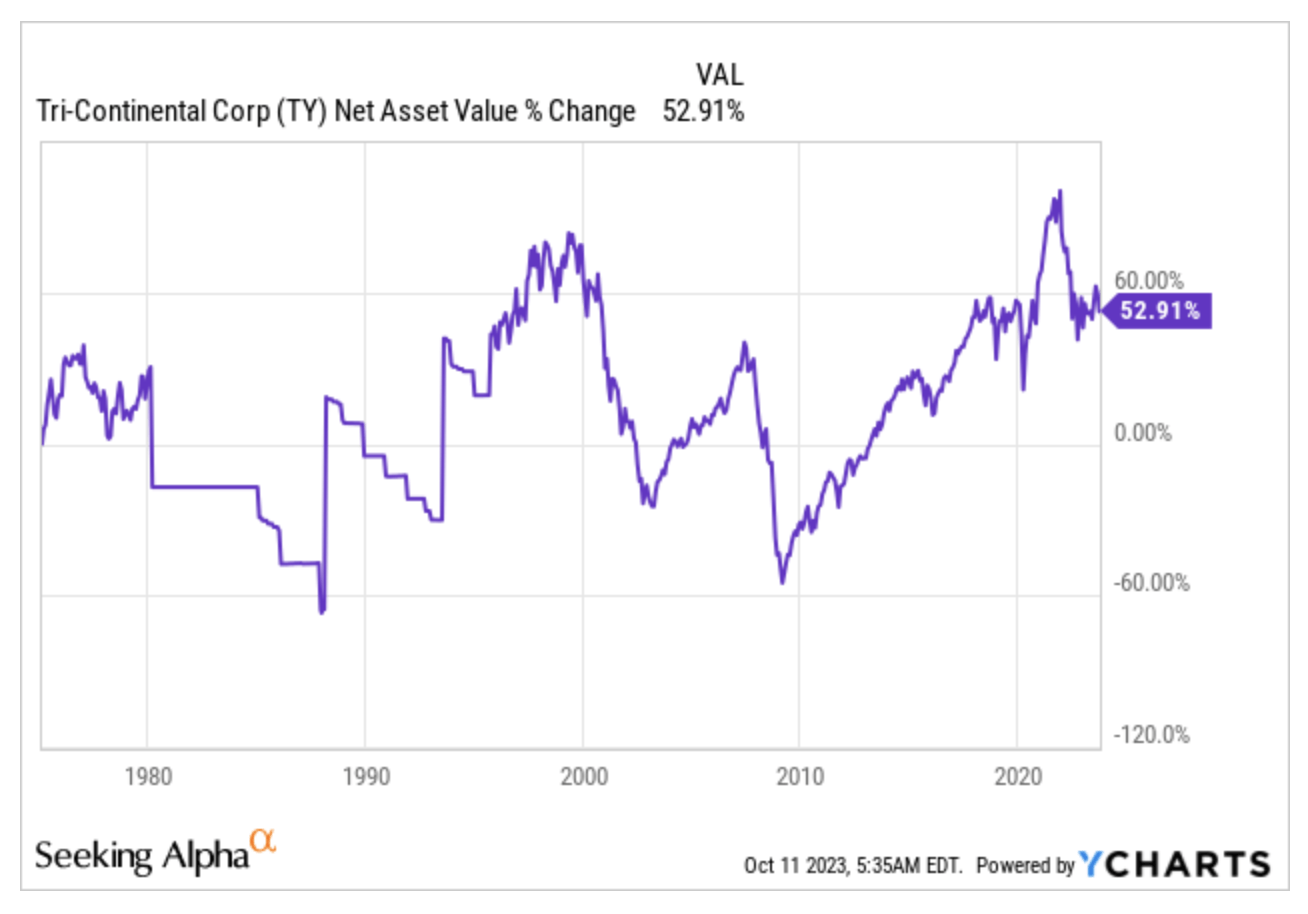
Morningstar Category: Moderately Aggressive Allocation
Market Value: $1.4 Bil
Total Leverage Ratio: 2.27%
Last Actual Disc/Prem: -11.89%
Total Dist. Rate: 3.91%
12 CEFs with Monthly Distributions
Finally, twelve are the monthly distribution CEFs with positive NAV since launch, which fall into my favorite category as an investor interested in dividends because of the consistency of their payouts, although as I mentioned I have recently opened up to quarterly distributions, which I have begun to enjoy with equal satisfaction.
This is the list:
- BlackRock Health Sciences Trust ( BME )
- BlackRock Science and Technology Trust ( BST )
- BlackRock Science and Technology Trust II (BSTZ)
- BlackRock Utilities Infrastructure & Power Opportunities Trust ( BUI )
- Eaton Vance Tax-Adv. Global Dividend Opps ( ETO )
- Eaton Vance Tax-Adv. Dividend Income ( EVT )
- Gabelli Dividend & Income Trust ( GDV )
- Nuveen AMT-Free Municipal Value Fund ( NUW )
- Source Capital ( SOR )
- Tekla Healthcare Opportunities Fund ( THQ )
- Cohen & Steers Infrastructure Fund ( UTF )
- Reaves Utility Income Fund ( UTG )
Blackrock Health Sciences Trust
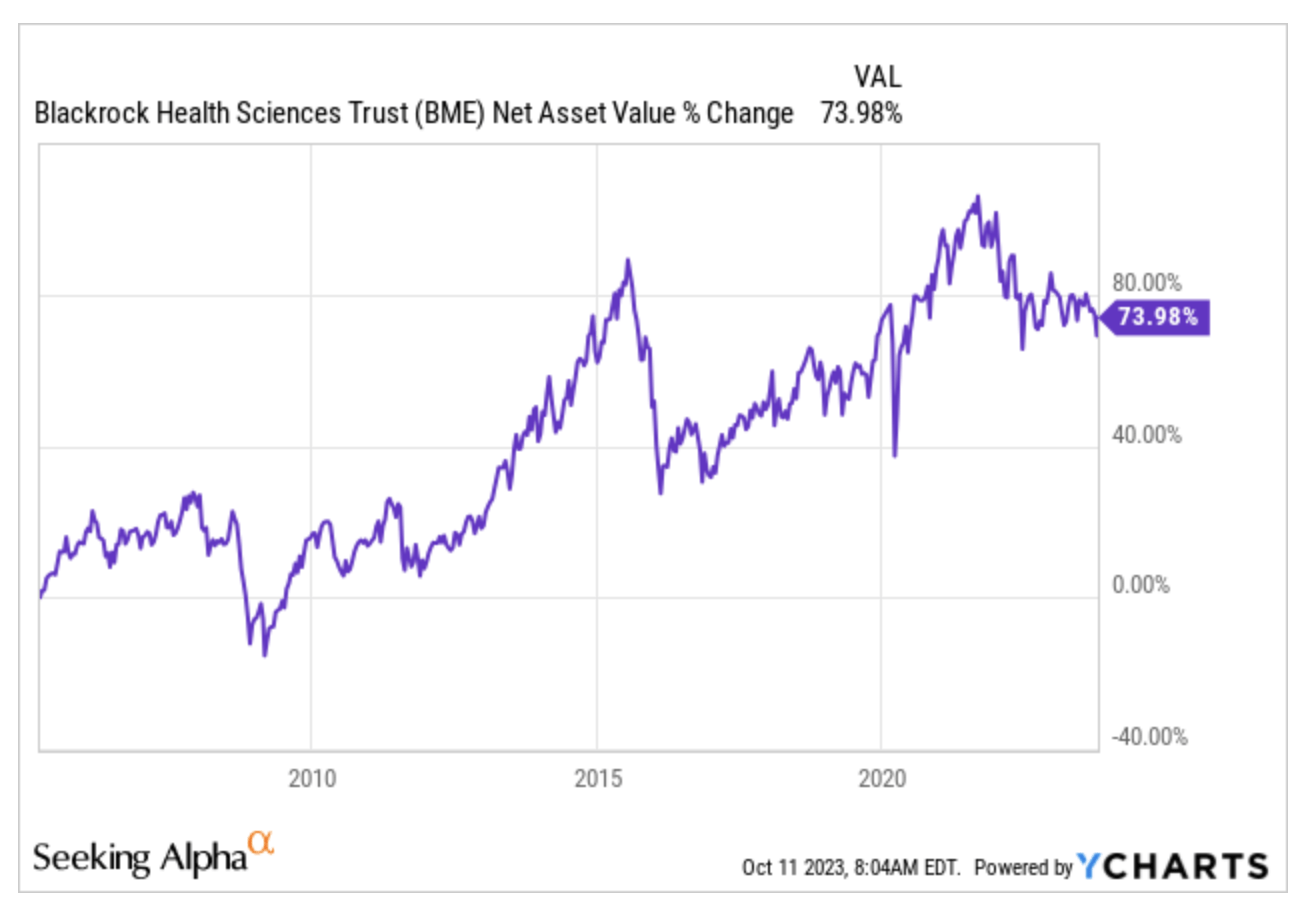
Morningstar Category: Health
Market Value: $536.1 Mil
Total Leverage Ratio: 0.46%
Last Actual Disc/Prem: -5.76%
Total Dist. Rate: 6.65%
BlackRock Science and Technology Trust
Morningstar Category: Technology
Market Value: $1.1 Bil
Total Leverage Ratio: 0.23%
Last Actual Disc/Prem: 0.28%
Total Dist. Rate: 9.18%
BlackRock Science and Technology Trust II
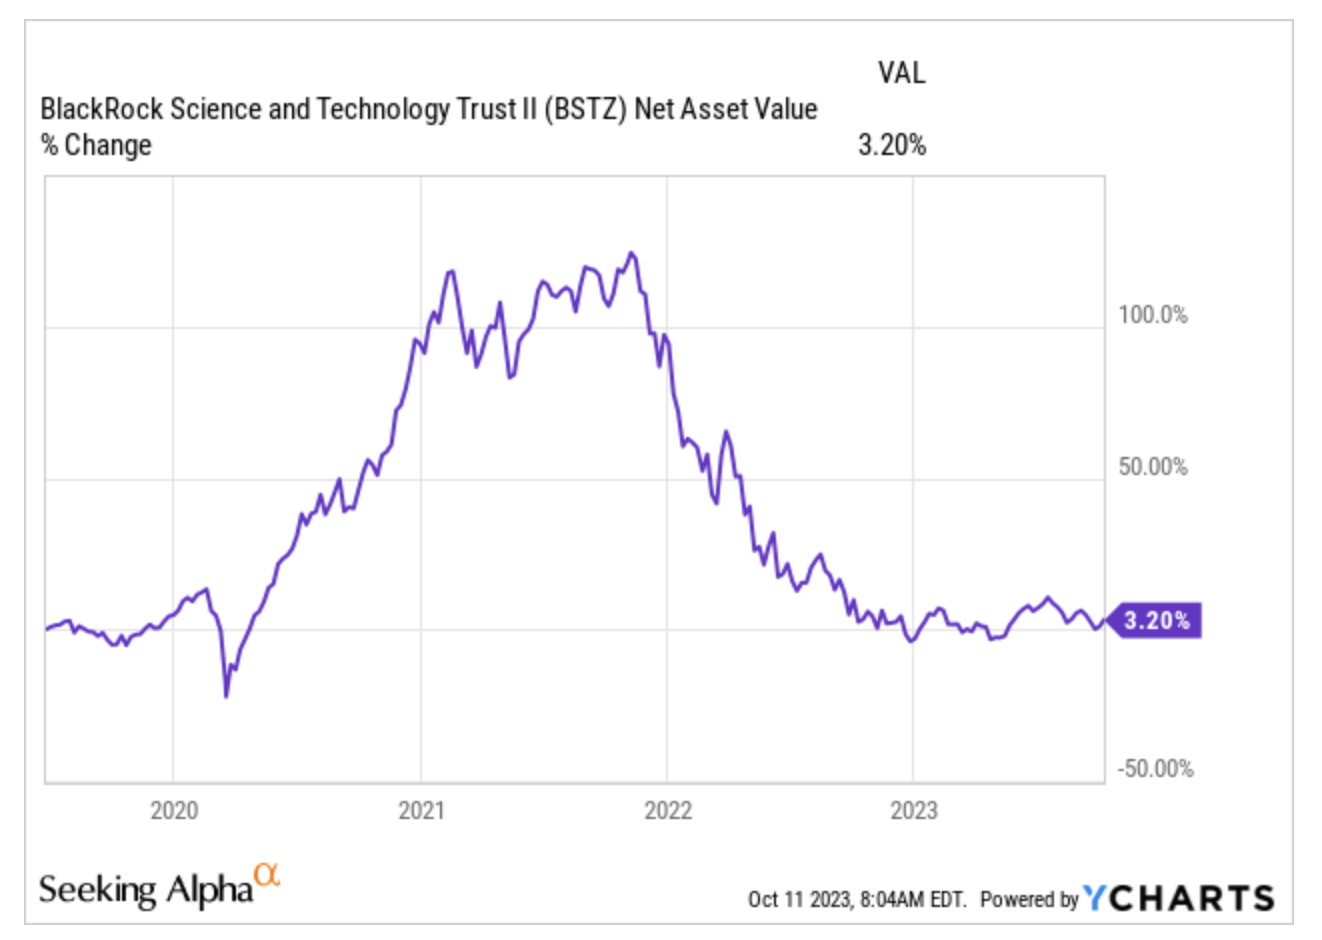
Morningstar Category: Technology
Market Value: $1.2 Bil
Total Leverage Ratio: 0.16%
Last Actual Disc/Prem: -21.76%
Total Dist. Rate: 7.69%
BlackRock Utilities Infrastructure & Power Opportunities Trust
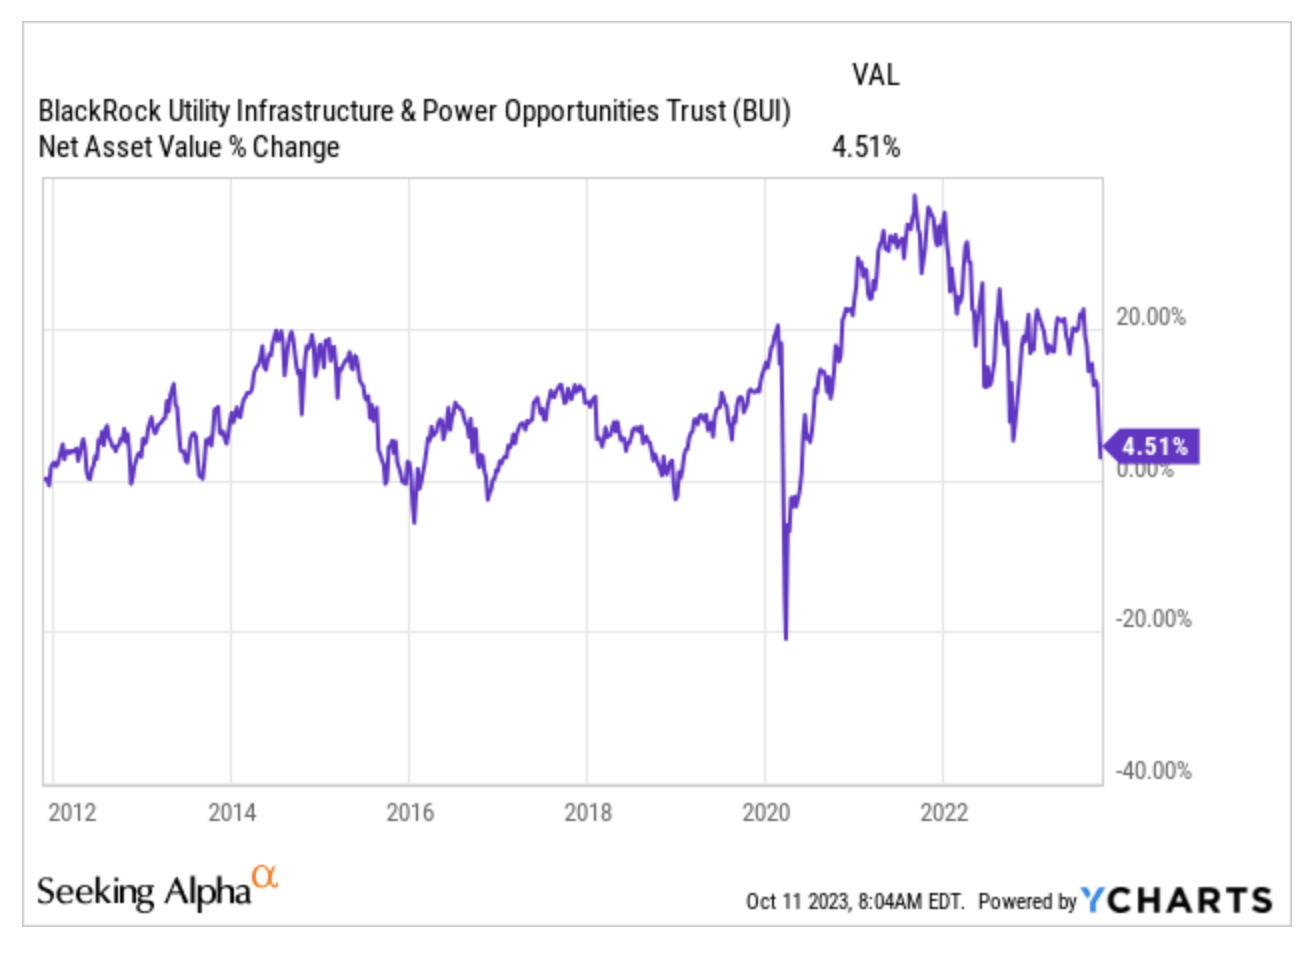
Morningstar Category: Utilities
Market Value: $458.8 Mil
Total Leverage Ratio: 0.55%
Last Actual Disc/Prem: 0.84%
Total Dist. Rate: 7.10%
Eaton Vance Tax-Adv. Global Dividend Opps
Morningstar Category: Global Allocation
Market Value: $349.9 Mil
Total Leverage Ratio: 20.89%
Last Actual Disc/Prem: -10.29%
Total Dist. Rate: 7.72%
Eaton Vance Tax-Adv. Dividend Income
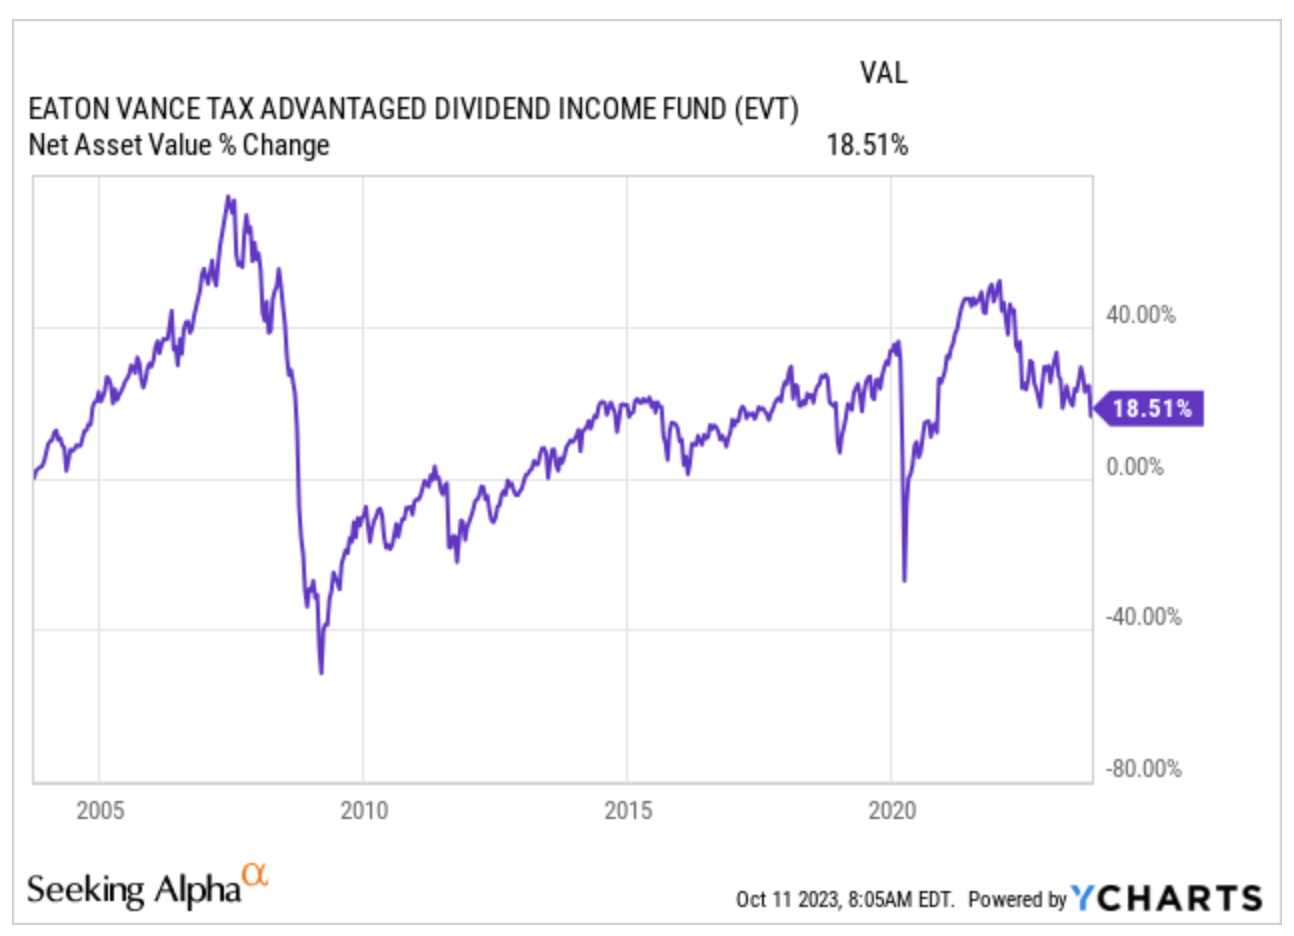
Morningstar Category: Moderately Aggressive Allocation
Market Value: $1.5 Bil
Total Leverage Ratio: 21.11%
Last Actual Disc/Prem: -8.43%
Total Dist. Rate: 8.70%
Gabelli Dividend & Income Trust
Morningstar Category: Large Blend
Market Value: $1.7 Bil
Total Leverage Ratio: 14.15%
Last Actual Disc/Prem: -17.08%
Total Dist. Rate: 6.81%
Nuveen AMT-Free Municipal Value Fund
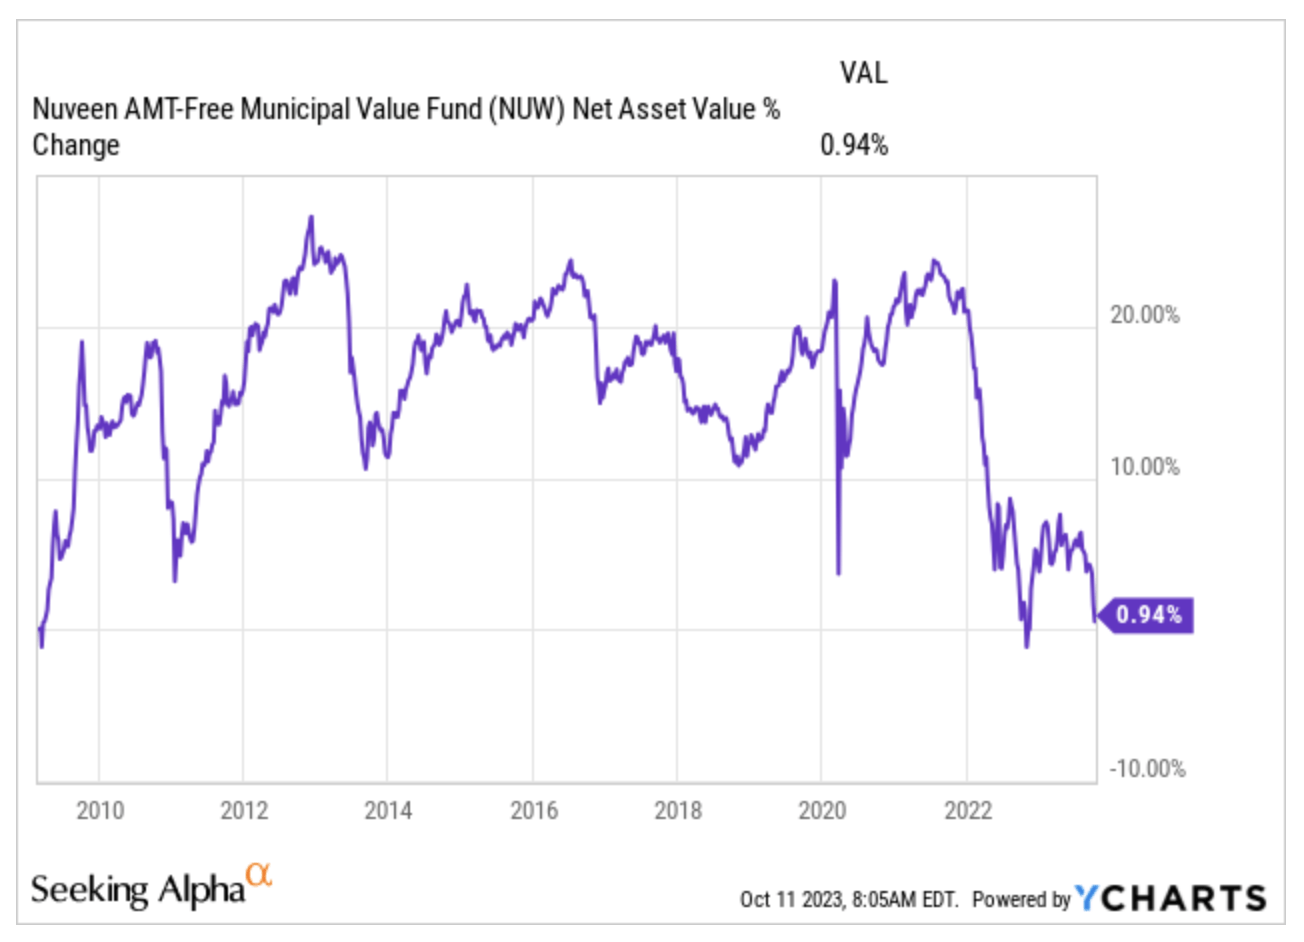
Morningstar Category: Muni National Long
Market Value: $232.3 Mil
Total Leverage Ratio: 0.76%
Last Actual Disc/Prem: -10.76%
Total Dist. Rate: 3.94%
Source Capital
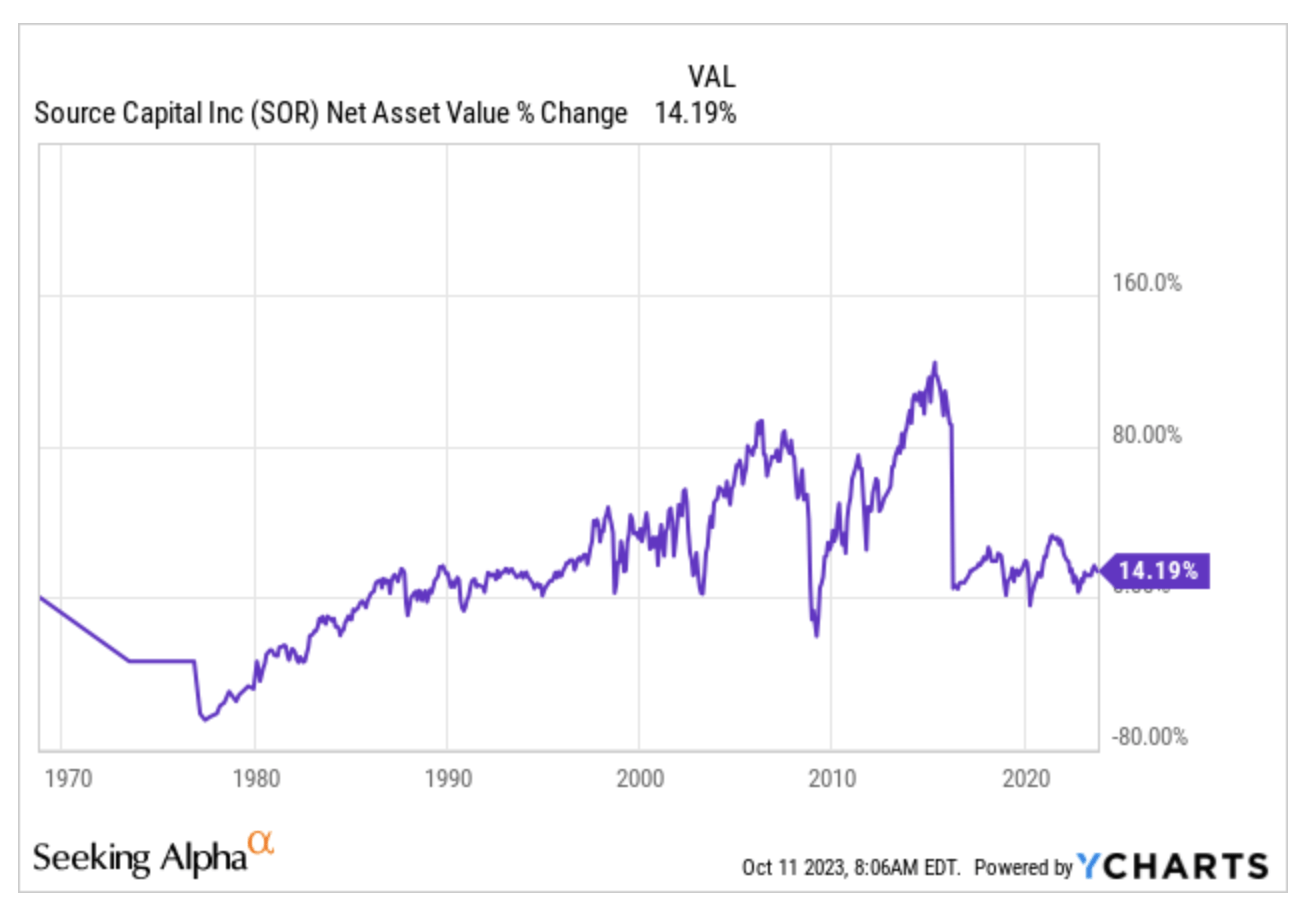
Morningstar Category: Moderate Allocation
Market Value: $319.9 Mil
Total Leverage Ratio: -
Last Actual Disc/Prem: -8.67%
Total Dist. Rate: 6.40%
Tekla Healthcare Opportunities Fund
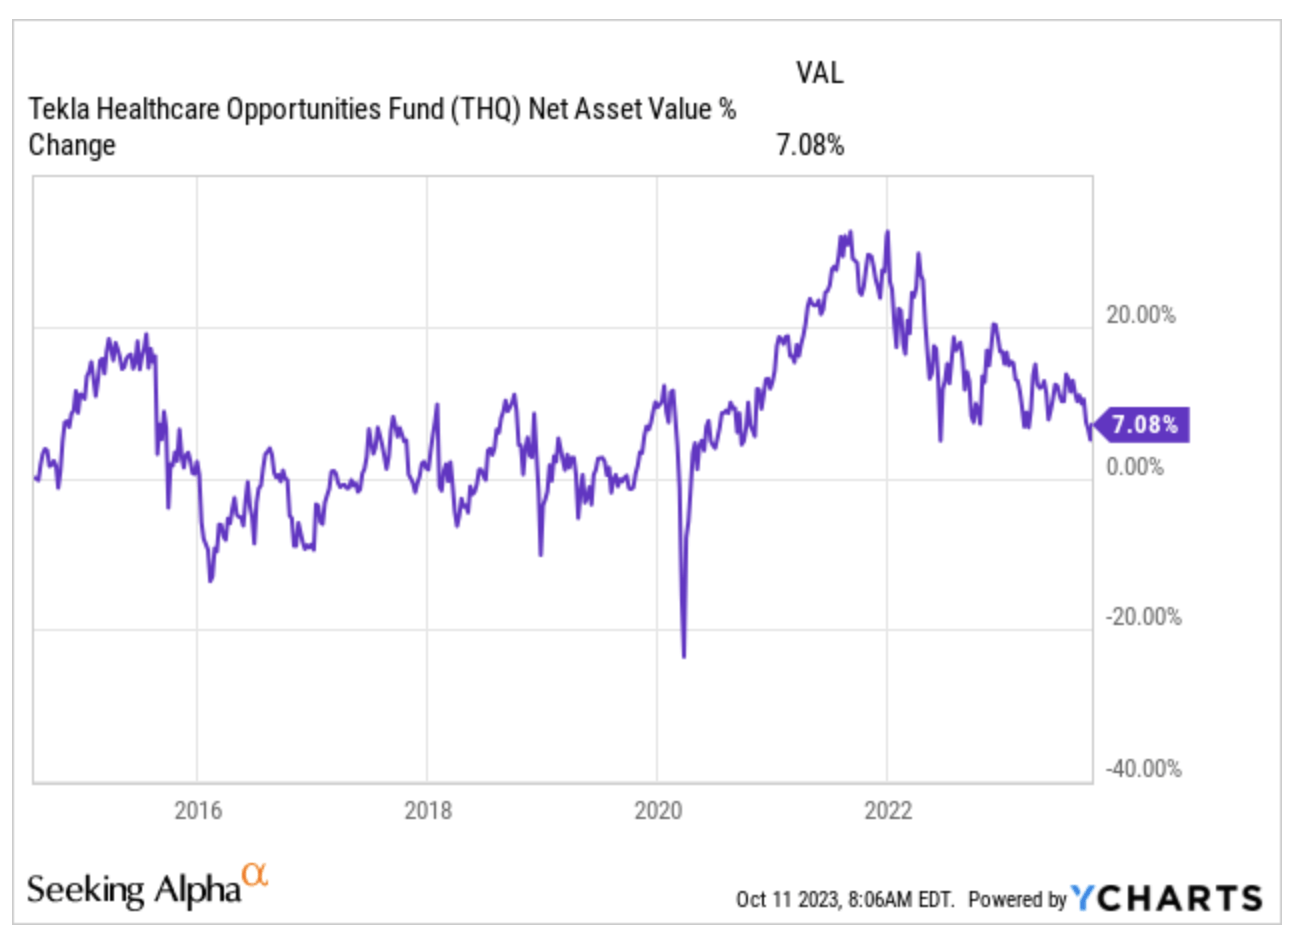
Morningstar Category: Health
Market Value: $690.2 Mil
Total Leverage Ratio: 21.34%
Last Actual Disc/Prem: -16.76%
Total Dist. Rate: 8.09%
Cohen & Steers Infrastructure Fund
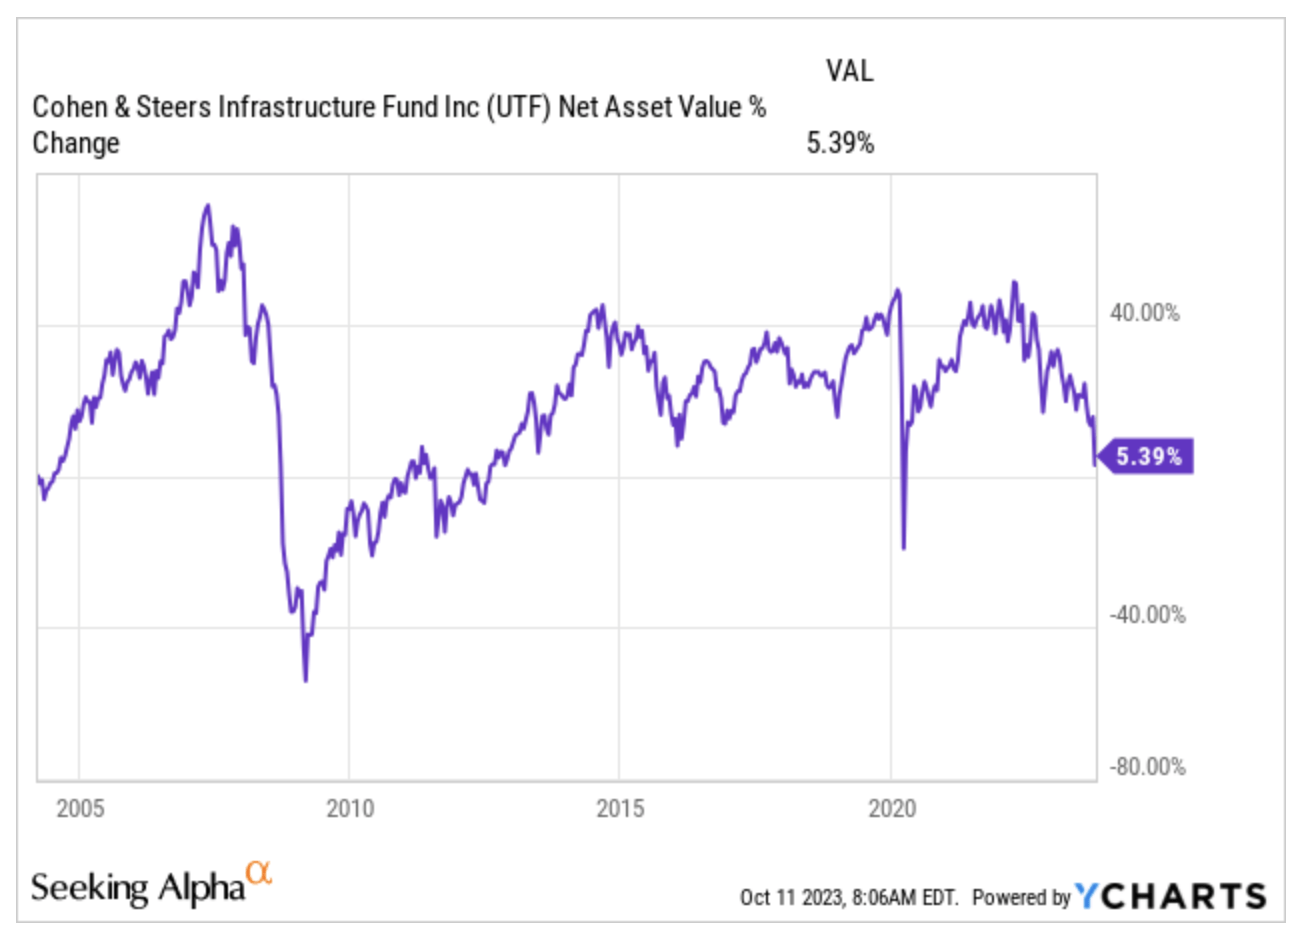
Morningstar Category: Infrastructure
Market Value: $1.9 Bil
Total Leverage Ratio: 32.86%
Last Actual Disc/Prem: -3.02%
Total Dist. Rate: 9.50%
Reaves Utility Income Fund
Morningstar Category: Utilities
Market Value: $1.8 Bil
Total Leverage Ratio: 22.00%
Last Actual Disc/Prem: 0.00%
Total Dist. Rate: 9.24%
Summing Up…
As we have seen, as of October 11, 2023, there were only 38 dividend-paying CEFs with positive NAV since launch out of a total of 440 currently on the market. Less than 10%, on which the attention of the long-term investor who aims to enjoy a steady cash flow with an eye on capital appreciation should rightly focus.
As is well known, the tide lifts all boats, but it is at times like these that Warren Buffett's proverbial metaphor about who's swimming naked is affirmed. If history matters, now that the tide has receded, I think these 38 CEFs could be a hypothesis worth considering, since their management over time has been able to create value as well as provide a steady stream of dividends.
In other words, given a choice between a fund that has been steadily declining since launch and one with a positive NAV performance, I believe it is more prudent to lean toward the latter. Especially if in the long run I have a greater prospect of preserving (or even increasing) the initial capital invested while pocketing or reinvesting its distributions.
Of course, much depends on when you buy a security within each business cycle, but knowing that these CEFs have increased in value over time is already a comfort in a landscape full of funds that have burned through capital since launch. Some of these 38 CEFs (BST, ETO, EVT, RVT, UTF, UTG) are also present in my income portfolio. Although at the time I created it, many of the other funds that comprise it were showing a positive NAV since launch, which have been depleting during this latest crisis.
Of the more than seventy towers built in San Gimignano in medieval times, only fourteen have been preserved, either because they were more solid or because of a series of circumstances that spared them over the centuries. Evidently, they had something extra that made them survive, just like the 38 CEFs that have a positive NAV today compared to when they were launched.
And it is not only a matter of luck.
For further details see:
Income Portfolio - 38 CEFs Worth Exploring