FLIN - INDA: To $4 Trillion And Beyond For India
2023-12-21 22:56:41 ET
Summary
- It’s been a great year to be long Indian stocks.
- Given the setup, next year could be even better.
- Low-cost India ETFs like INDA remain great vehicles to ride the long-term growth story.
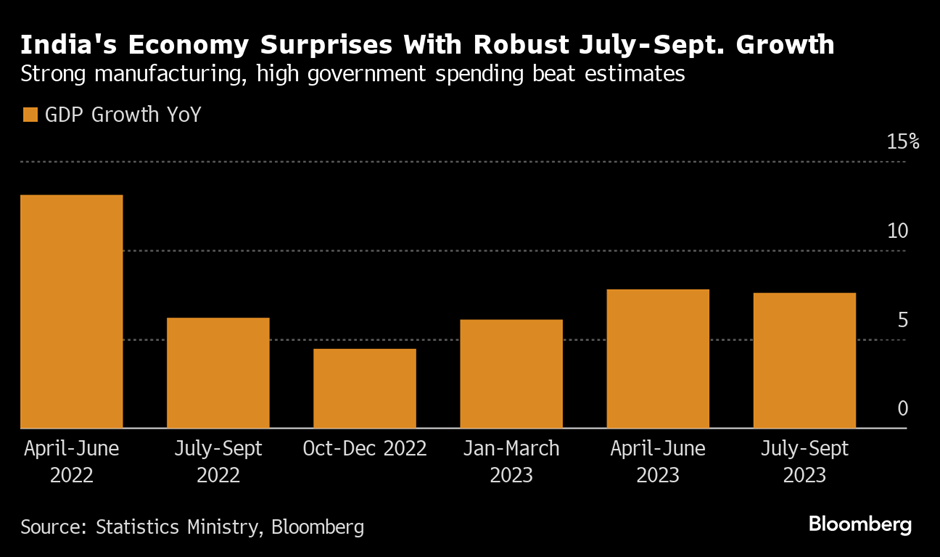
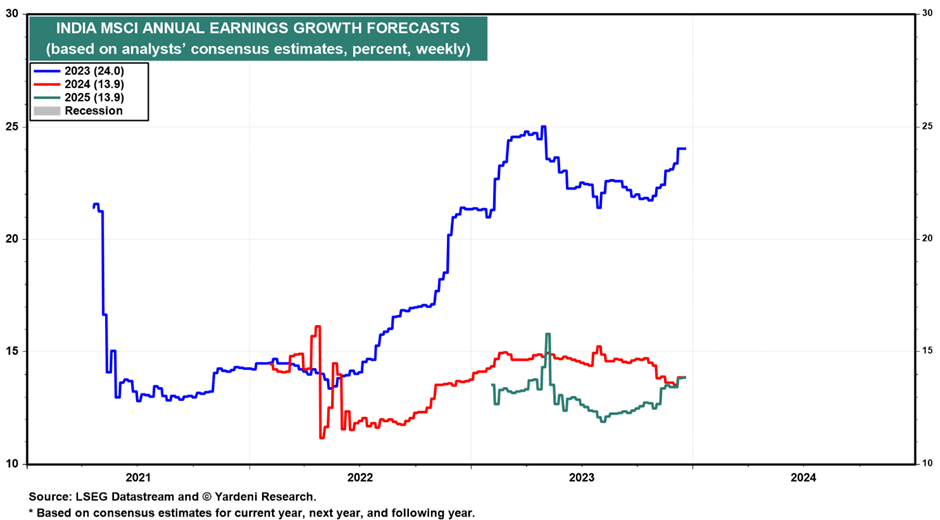
India has been the standout market in Asia yet again in 2023 and has seen its listed equity market cap cross a landmark $4tn - effectively making India the fifth-largest equity market in the world. The catalyst for the latest leg in the Indian rally was a resounding state election victory for the incumbent BJP ('Bharatiya Janata Party') across three out of five contested states. But it hasn't just been election optimism; this rally has been well-supported by both economic growth (July to September quarter GDP growth surprised to the upside at +7.6% YoY) and earnings (+23.4% in 2023 per consensus estimates).
To be fair, the iShares MSCI India ETF ( INDA ) portfolio has priced in some of the positives and now trades at a wider premium to Asia ex-Japan post-state elections. Yet, it's hard to argue the premium valuation isn't well-deserved relative to a sustained high teens % earnings growth long term .
Plus, the near-term setup is as compelling as ever. On the one hand, the combination of lower US yields and oil prices is supportive of already strong Indian macro and corporate fundamentals. Another, perhaps underestimated, source of upside is on the technical side, with foreign portfolio flows starting to reverse after a challenging start to the year. This should benefit higher-quality large caps, typically the go-to areas for foreign investors, particularly given their wide valuation gap relative to more expensive small/mid-caps. As for the upcoming general election early next year, all signs point to a big win for the incumbent BJP government, which should trigger another rally as the market prices in policy continuity.
iShares MSCI India ETF Overview - The Largest India Equity Tracker
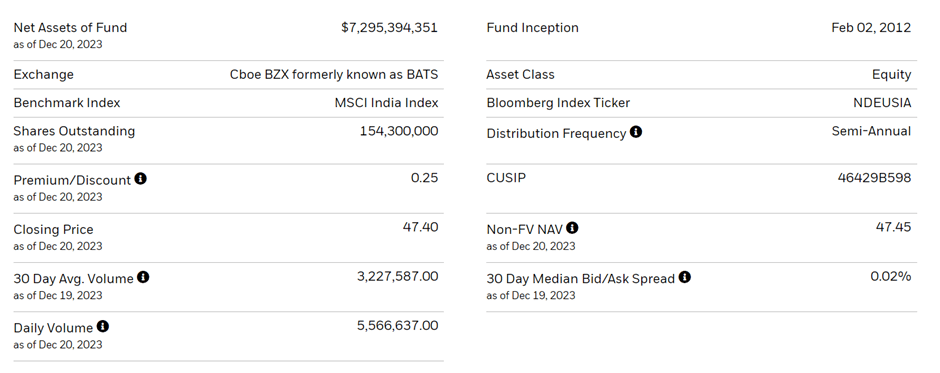
The iShares MSCI India ETF tracks, before fees and expenses, the total return performance of the MSCI India Index, which tracks the performance of Indian large and mid-caps spanning ~85% of the country's equity universe. The ETF charges a ~0.6% expense ratio, a premium to its ultra-low-cost comparable, the Franklin FTSE India ETF's ( FLIN ) ~0.2%, but below Nifty 50 index (i.e., the benchmark domestic Indian stock index) trackers like the iShares India 50 ETF's ( INDY ) ~0.9%. Where INDA stands out is its size and liquidity - with ~$7.3bn assets under management, this remains the largest US-listed India fund on the market.
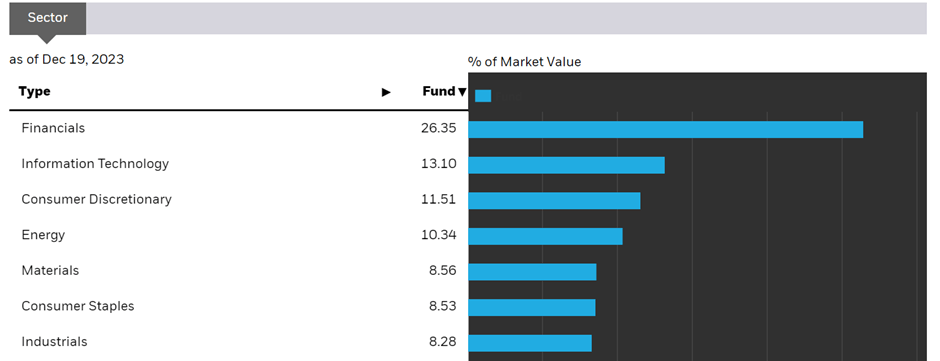
The fund is heavy on banking stocks, as its Financials-focused (26.4%) sector breakdown shows. Information Technology (13.1%), Consumer Discretionary (11.5%), and Energy (10.3%) are the other major sector allocations over the 10% threshold. Key comparable FLIN features a broadly similar portfolio composition, with the key difference being its more rigid weightage caps, which keep its top sector allocations slightly lower than INDA. With INDA's top-five holdings contributing ~70% of the portfolio (vs ~68% for FLIN), investors should be mindful of the sector concentrations here.
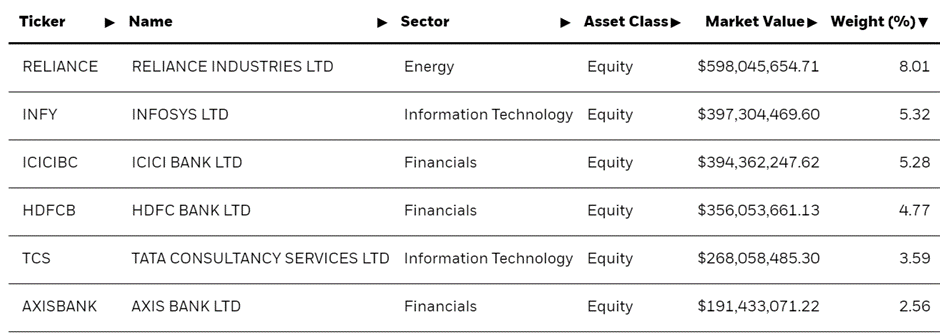
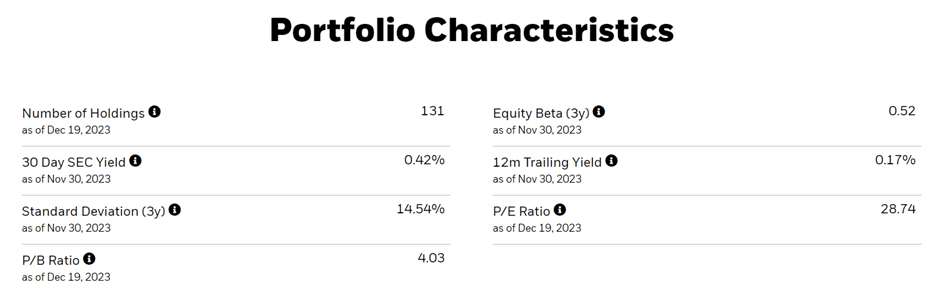
In line with most other large-cap Indian ETFs, INDA's 131-stock portfolio allocation is led by conglomerate Reliance Industries ( RLNIY ) at 8.0%. The rest of the top-ten list, however, is dominated by banking and tech services companies. Infosys (INFY), for instance, is the second-largest holding at 5.3% following a strong Q3/Q4 rally, with key peer Tata Consultancy Services ( TTNQY ) also gaining a larger portfolio allocation at 3.6%. Major Indian banking groups, HDFC Bank ( HDB ) and ICICI Bank (IBN), remain the third and fourth-largest holdings at 5.3% and 4.8%, respectively - despite lagging the broader Indian market rally this year. Key ETF comparable, FLIN, has a broadly similar single-stock allocation, albeit with a much larger 214-stock portfolio and lower single-stock weights. INDY's narrower 50-stock portfolio, on the other hand, swings the other way, with much higher concentrations. In comparison, INDA takes the middle ground.
iShares MSCI India ETF Performance - Not the Fastest Horse but a Fast One Nonetheless
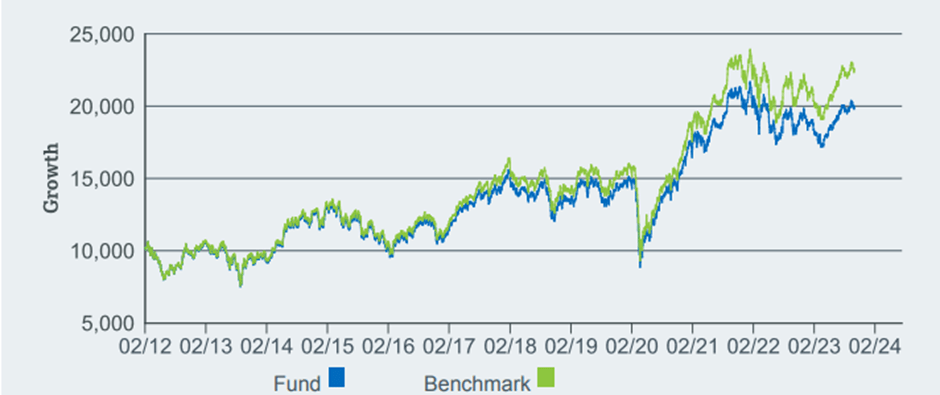
Performance-wise, INDA investors don't have a lot to complain about. Following a drawdown last year, 2023 has been one of the better years on record, delivering a +16.6% total NAV return. Zooming out, the fund has now compounded at a steady +6.3% pace since its inception in 2012, with a large chunk of the fund's outperformance coming over the last decade (+8.2% ten-year NAV return). The only drawback is INDA's tracking error - not unusual for India ETFs, but nevertheless a hefty 'invisible' cost for investors at nearly two percentage points over the last year (excluding fees).
The relative performance picture is trickier - on the one hand, INDA has lagged behind the lower-priced FLIN across most time frames, with INDA's +8.4% five-year return paling in comparison to FLIN's +9.5% annualized. On the other hand, INDA has outpaced the more concentrated INDY, which returned +8.0% over the last five years. Looking past the headline performance numbers, though, the more straightforward iShares offerings do manage their (fee-adjusted) tracking errors better than comparable offerings. Lower-cost FLIN, for instance, deviates from its FTSE India Capped Index benchmark by a wider margin (over two percentage points over the last year), likely due to the additional rebalancing required for its more stringent weightage caps.
Indian ETFs are generally poor at capital return, and that rings true for INDA as well, with yields at ~0.4% (30-day SEC basis). History shows that the yield probably won't run much higher than this going forward, nor will it be stable through the cycles; hence, INDA isn't a great fit for income investors. What INDA does provide, though, is access to a group of high-quality Indian companies that can compound capital at strong rates through the cycles. To be fair, some of these positives are in the price, with INDA now priced at a premium ~29x P/E. Relative to ~24% earnings growth in 2023 and a further low-teens % growth through 2024/2025, though, the valuation is well-supported, in my view.
To $4 Trillion and beyond for India
Having just hit a $4tn valuation in record time, there isn't much stopping Indian equity markets anytime soon. Across macro (high-single-digit % GDP growth and decelerating inflation) and micro (~24% earnings growth in 2023; high-teens % consensus long-term), the setup for Indian stocks is as compelling as ever. With the Fed also pivoting quickly, India will finally benefit from a major technical tailwind via accelerated foreign equity inflows, which typically favor the lower-priced large caps (vs small/mid-caps for domestic flows). And more near term, there's a general election catalyst, which has historically been bullish for stocks. Net, positioning in a low-cost MSCI India tracker like INDA makes a lot of sense here.
For further details see:
INDA: To $4 Trillion And Beyond For India