SPTS - Inflation: No Evidence Of A Wage-Price Spiral
Summary
- Labor markets appear to be one of the primary determinants of Fed policy at the moment, with tight conditions and concern over a wage-price spiral driving higher interest rates.
- Labor markets may not actually be as tight as they appear on the surface though, and there is evidence that labor markets are weakening.
- Slower wage growth, lower job openings and a rise in the unemployment rate will likely be needed before the Fed stops increasing interest rates.
Tight labor markets are currently one of the key factors driving monetary policy. Until labor market conditions change materially, monetary policy is likely to continue tightening, placing further downward pressure on asset prices. There are a number of indications that labor markets have already begun to normalize, but they will still need to weaken significantly before any pivot occurs.
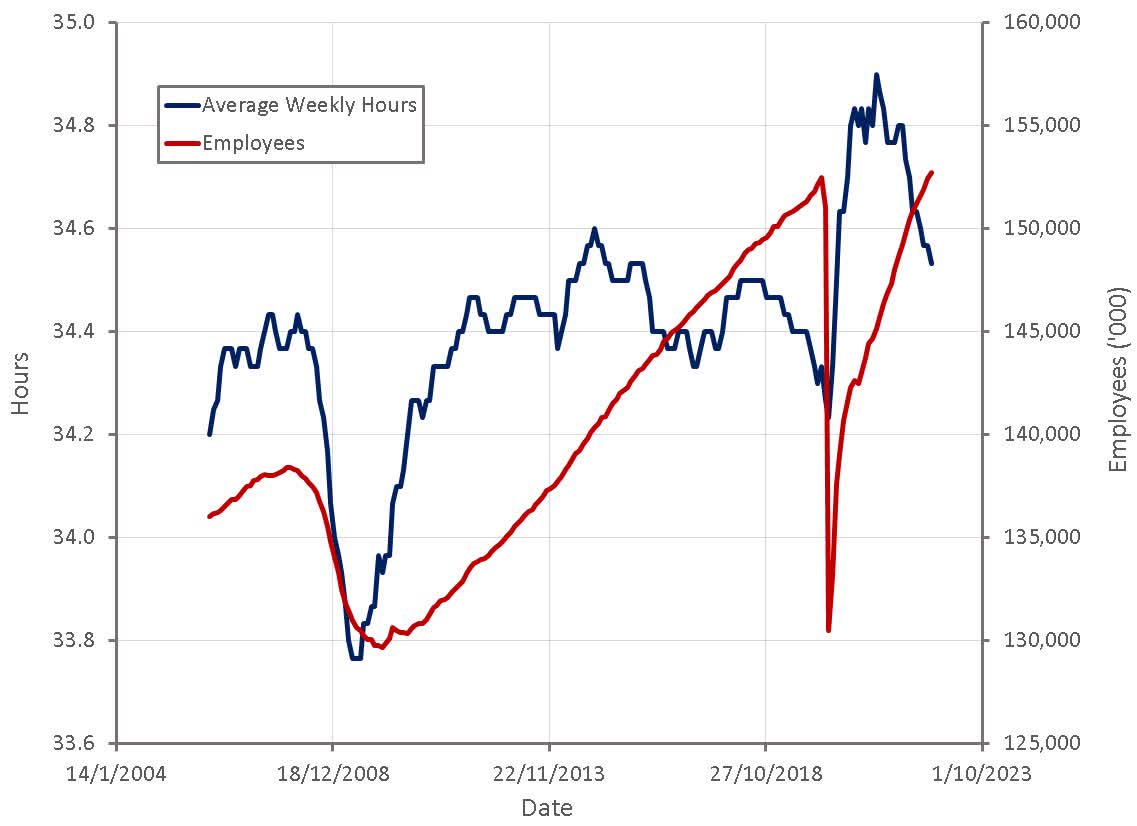
While the labor force continues to grow at a fairly modest pace, the average number of hours worked has declined substantially from the peak and is now approaching more normal levels. A reduction in hours would be the first expected sign of weakness in labor markets, due to the reluctance of organizations to lay off employees.
Figure 1: Total Number of Non-farm Employees and Average Weekly Hours (source: Created by author using data from The Federal Reserve)
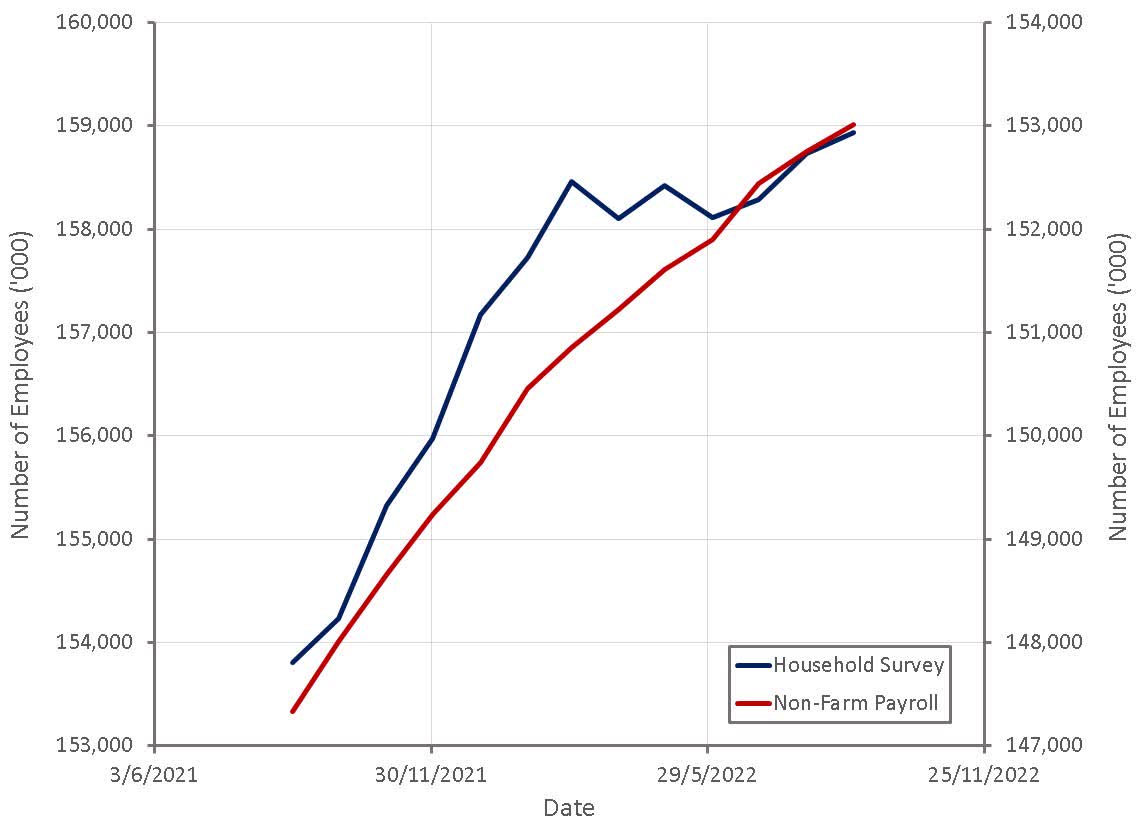
The past 12 months have seen some divergence in employment numbers from the household survey and non-farm payrolls. Employment numbers from the household survey increased rapidly in late 2021 and early 2022 but have since stagnated, whereas non-farm payrolls have shown a steady increase over the same period. The household survey contains more small businesses, which are likely more reactive to poor economic conditions.
Figure 2: Number of Employees (source: Created by author using data from The Federal Reserve)
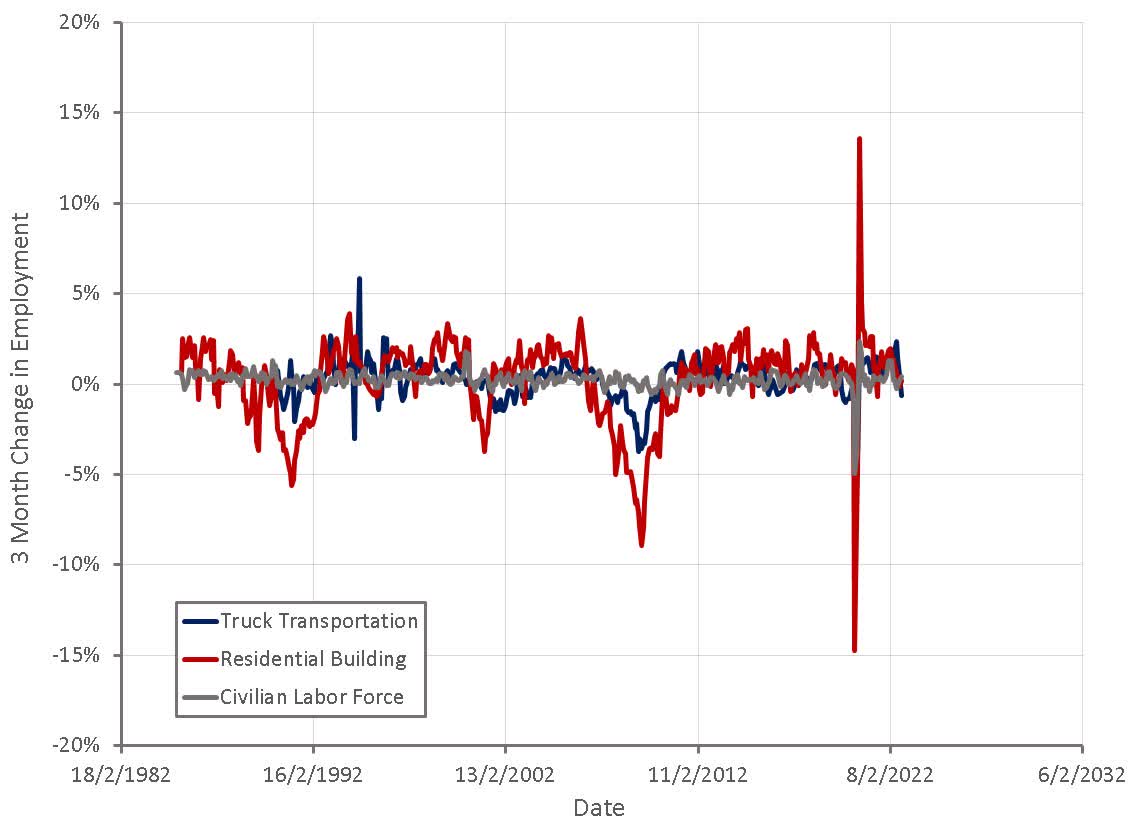
While employment numbers still look strong at an aggregate level, there are signs of weakness in areas of the economy that are more sensitive to the business cycle. The number of truck transportation employees is declining as the freight bubble bursts and the number of residential building employees has been fairly flat for a number of months. As consumer spending continues to be pressured by inflation and the impact of tighter monetary policy begins to be felt, employment in these types of sensitive industries is likely to fall and could portend losses in the wider economy.
Figure 3: 3 Month Change in Employment Levels (source: Created by author using data from The Federal Reserve)
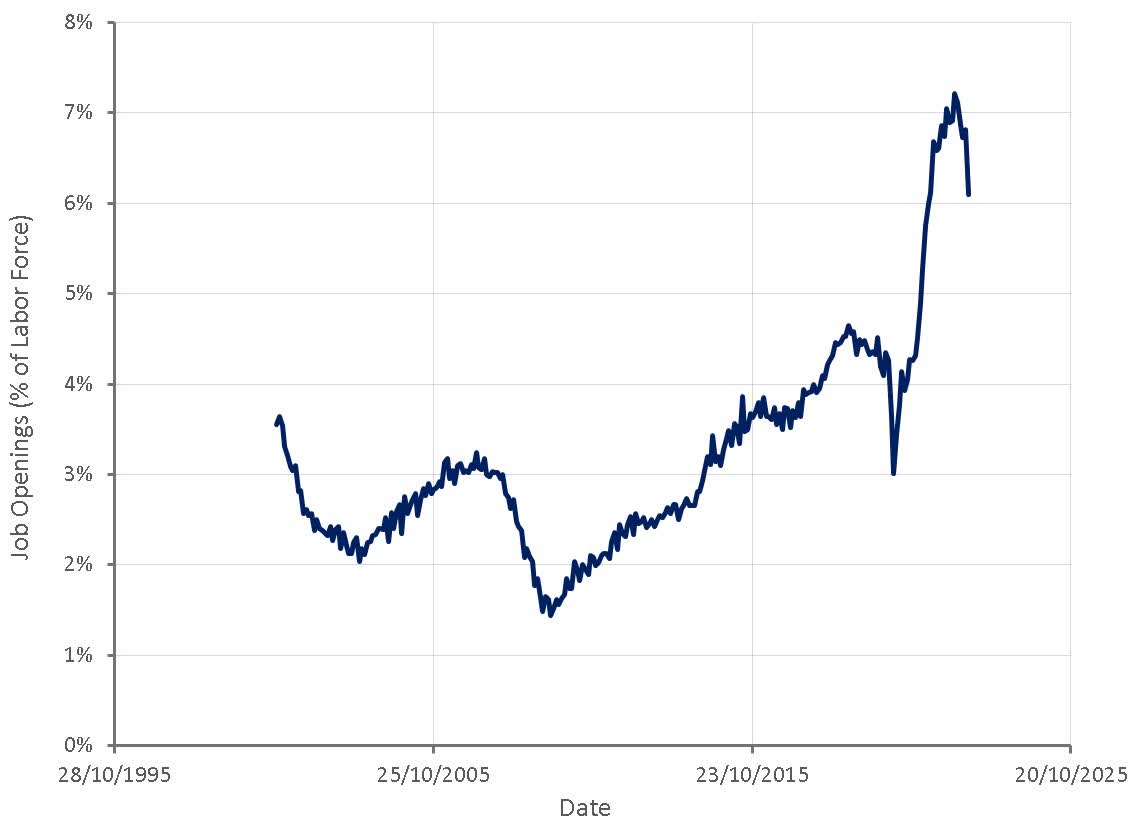
Job openings remain extremely elevated despite a dramatic decline in August, indicating that labor markets are still tight. There is concern that the number of job openings is not truly reflective of employment opportunities though, due to potential double counting of openings and a lack of hiring intent.
Figure 4: Job Openings (source: Created by author using data from The Federal Reserve)
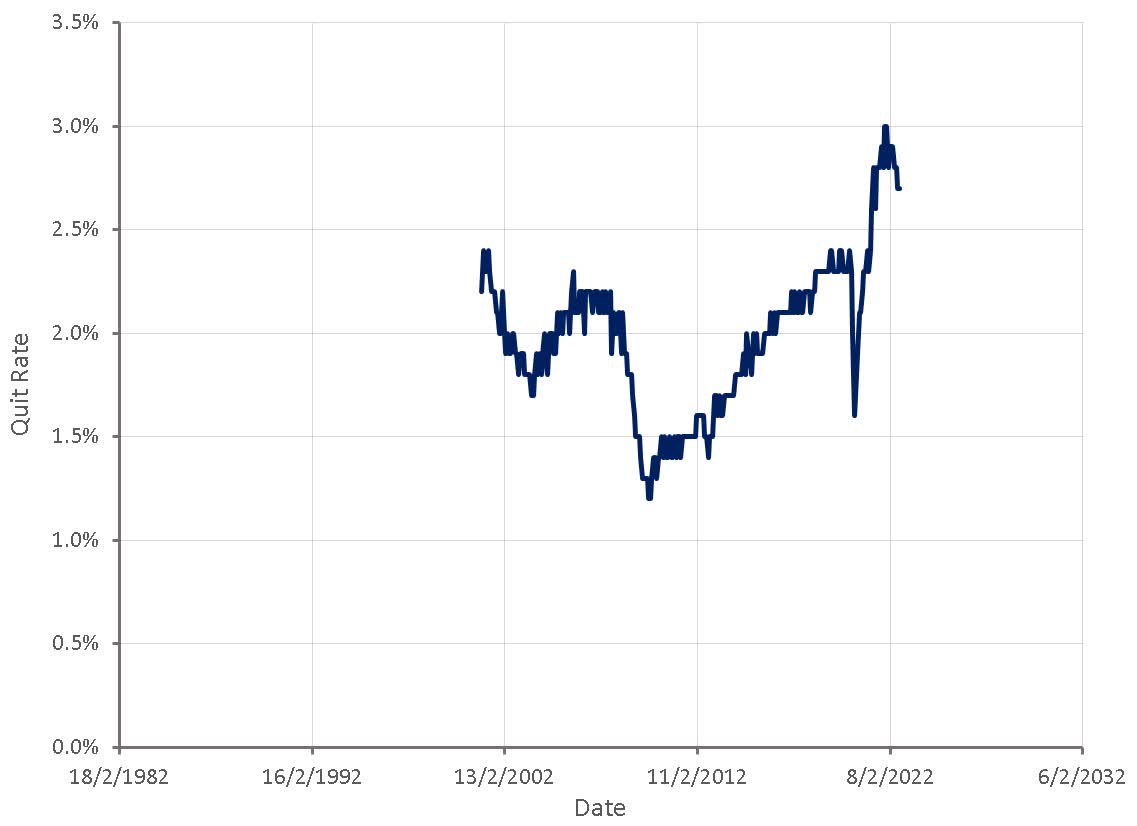
Job openings data should be viewed in conjunction with quit rates, as when there are genuinely a large number of employment opportunities, employees are more likely to quit their current job. Quit rates are also an excellent indicator of wage inflation as employees are more likely to get an increase in pay when switching jobs. Quit rates support the fact that labor markets have been extremely tight, but are now beginning to normalize.
Figure 5: Total Non-Farm Quit Rate (source: Created by author using data from The Federal Reserve)
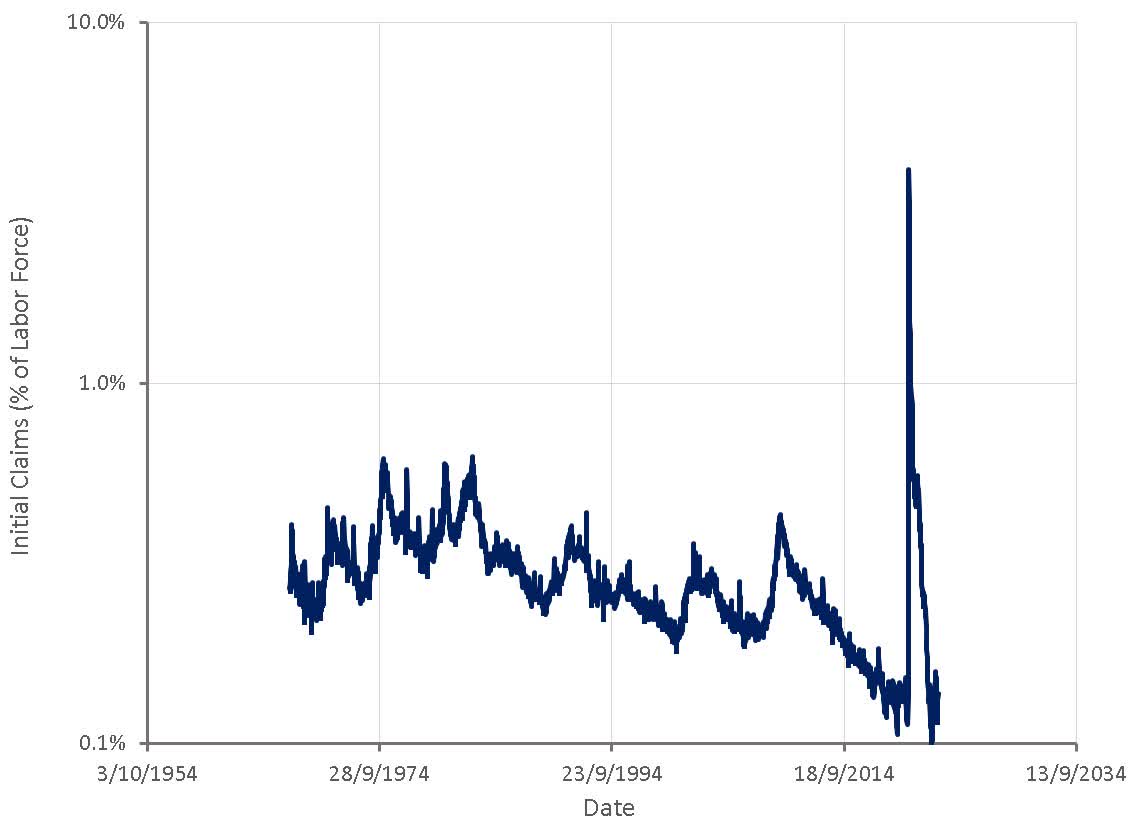
The number of initial claims remains relatively low, despite increasing modestly in 2022. A low number of initial claims also indicates that labor markets remain tight, although a weakening of labor markets is likely to show up in unemployment figures last and this should be seen as a trailing indicator.
Figure 6: Initial Claims (source: Created by author using data from The Federal Reserve)
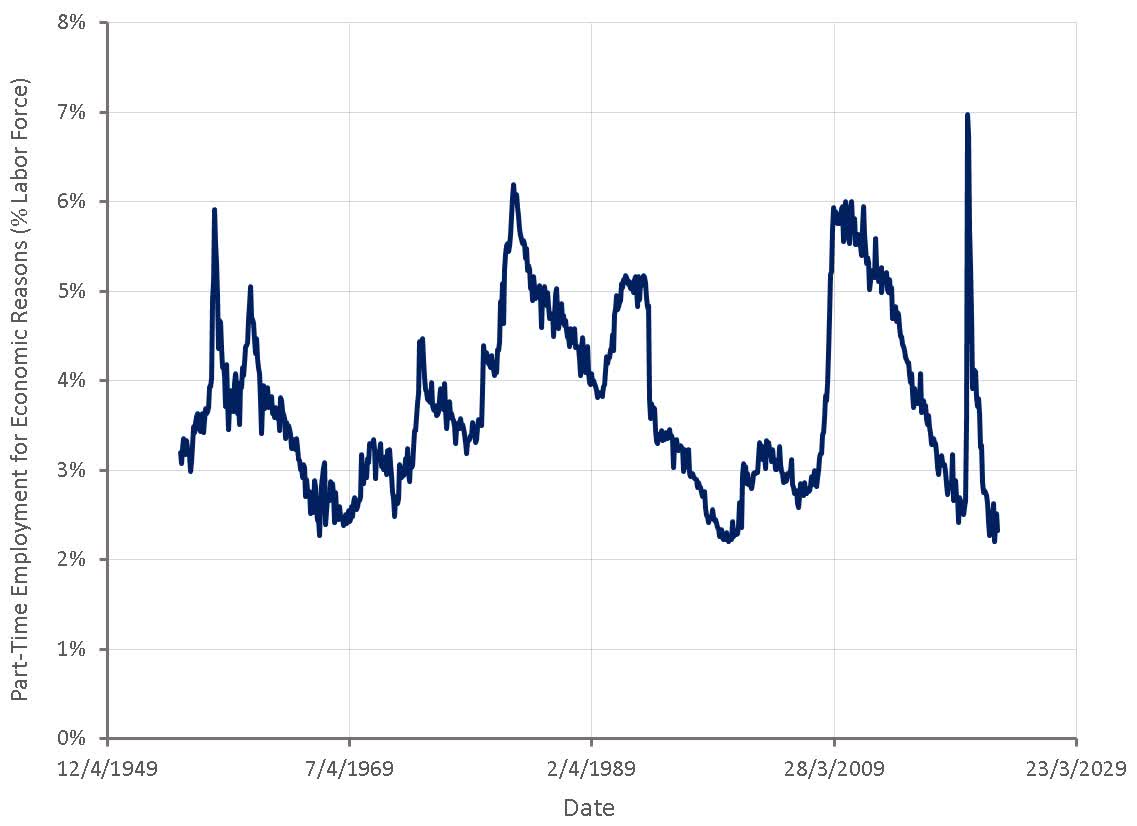
The number of part-time employees could also be an indicator of labor market conditions, with companies more likely to turn to part-time employees during periods of uncertainty. Part-time employment is currently at extremely low levels, which likely reflects a desire by companies to secure employees over the past few years.
Figure 7: Part-Time Employment for Economic Reasons (source: Created by author using data from The Federal Reserve)
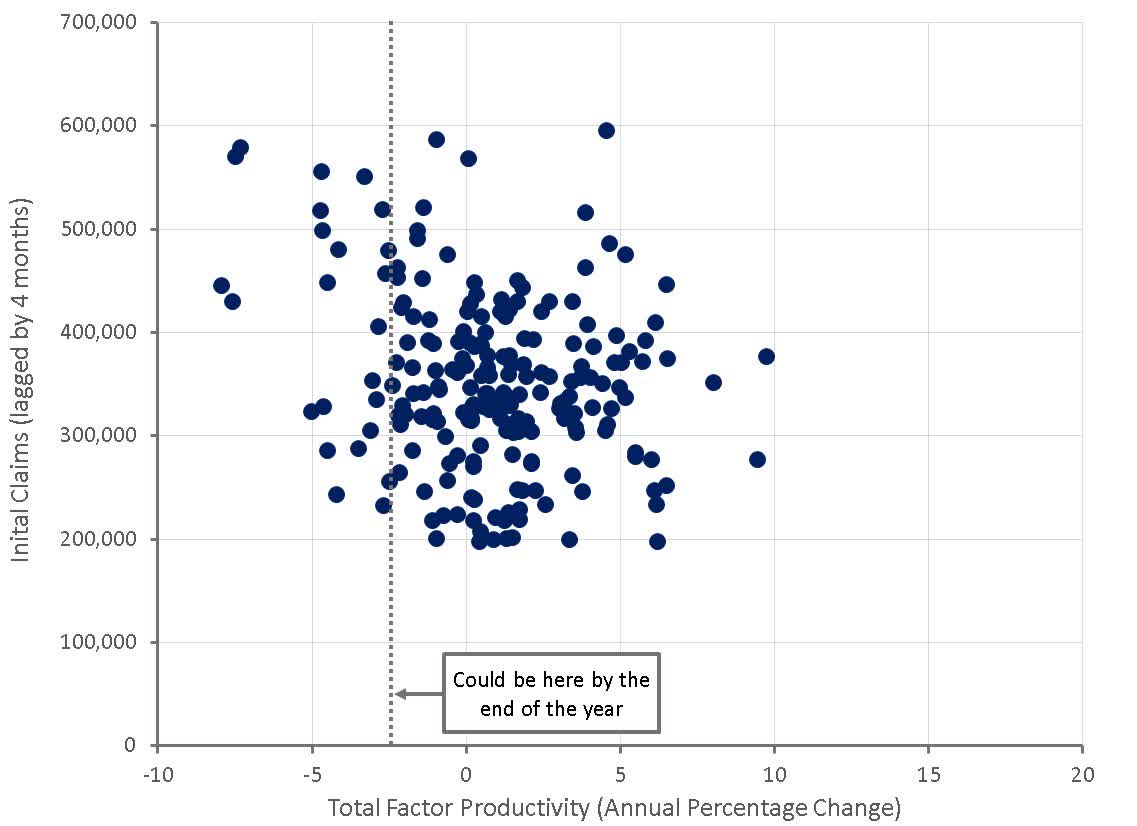
Another reason to think that labor markets are not as tight as they seem is recent weak productivity growth. Labor productivity is currently in decline, which may indicate that some companies are carrying excess employees. This seems reasonable given the difficulties the companies have encountered when trying to hire employees over the past few years. With economic growth now disappointing the downside, companies may begin to consider reducing headcount to try and maintain margins and prepare for a potential economic downturn.
Weak productivity figures could also reflect current high turnover in labor markets, with newer employees being less productive than more seasoned ones.
Figure 8: Total Factor Productivity and Initial Claims (source: Created by author using data from The Federal Reserve)
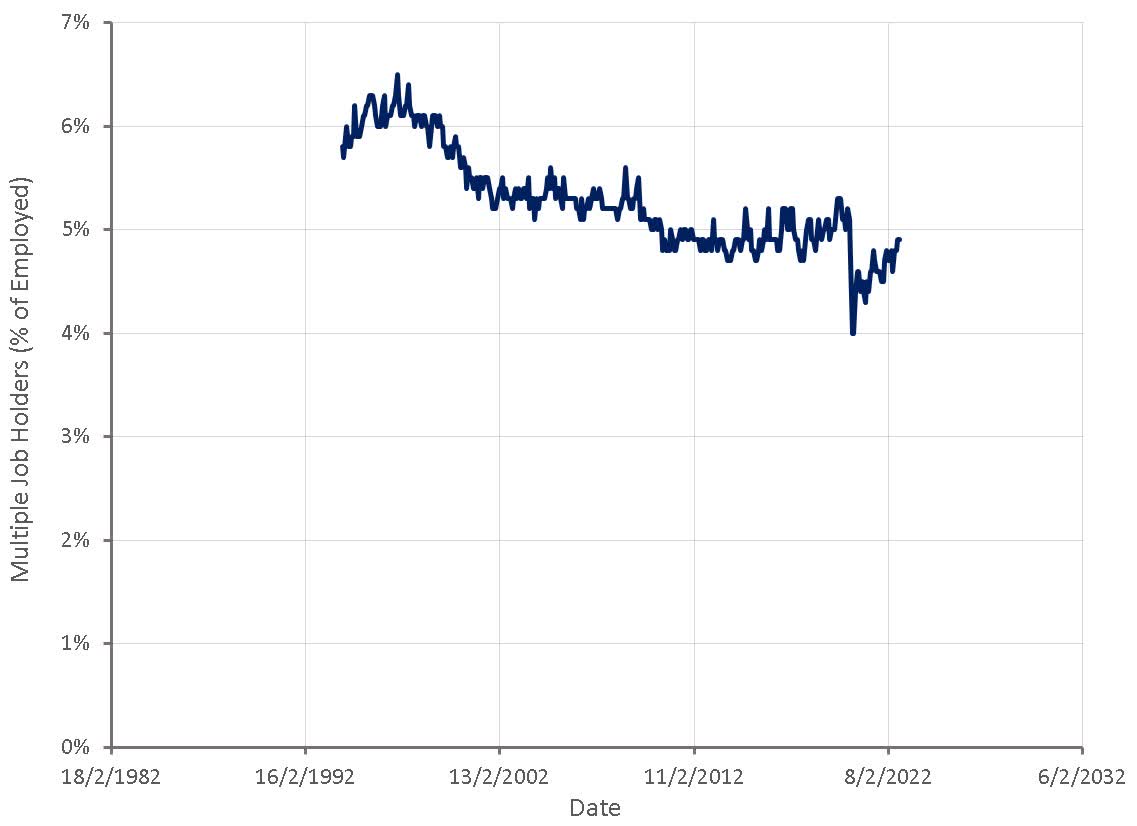
The number of employees holding multiple jobs can be viewed as an indicator that labor markets are tight and that there are a large number of employment opportunities, but can also be viewed as an indicator that consumers are facing financial strain and struggling to make ends meet. There are alternative ways of calculating multiple job holder numbers, which show conflicting trends over the past few decades, but it appears likely that the number of people holding multiple jobs has increased since the pandemic began.
The multiple job holding rate shows cyclical patterns, rising during economic expansions and falling during recessions. Three-quarters of middle-income Americans say they don't earn enough to pay for the cost of living, according to a recent survey. Multiple job holder figures appear to support the fact that labor markets are tight but also may show that consumers are struggling to make ends meet.
Figure 9: Multiple Job Holders (source: Created by author using data from The Federal Reserve)
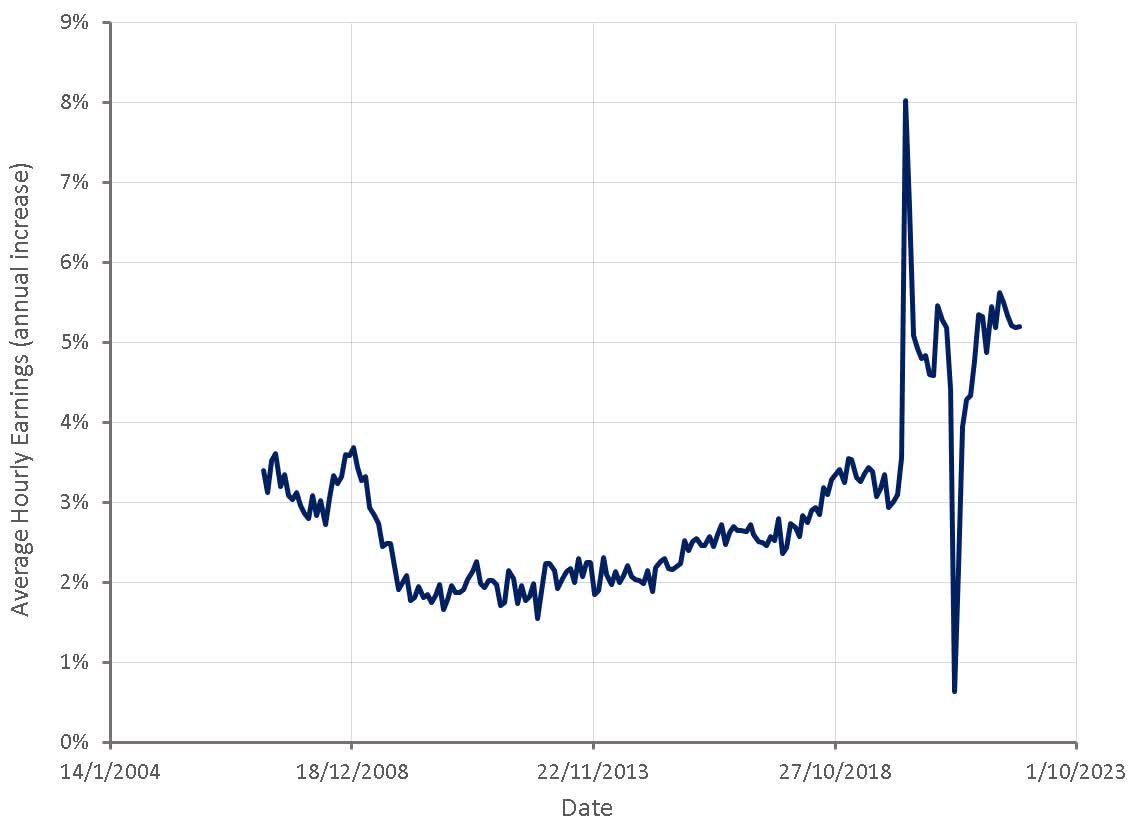
Growth in average hourly earnings has been strong over the past few years, as would be expected given labor market conditions. Wage growth has begun to moderate in recent months though and it would not be surprising to see monthly wage growth at a normal level by the end of the year. Wage growth must also be considered relative to inflation, and from that perspective has been quite weak. In aggregate, employees have seen declines in their spending power as inflation has outpaced wage growth.
Figure 10: Annual Change in Average Hourly Earnings (source: Created by author using data from The Federal Reserve)
Another important piece of the puzzle when comparing the current period to the inflation experienced during the 70s and 80s is the prevalence of unions. The share of US workers who belong to a union has fallen from 20% in 1983 to 10.3% in 2021. Unions provide workers with increased bargaining power and could contribute to a wage-price spiral during inflationary periods.
Data shows that major strike activity increased in 2021, but remains below pre-pandemic levels, although many worker actions were not captured in the data. BLS data on major work stoppages include only those strikes that involve 1,000 or more workers and last at least one full shift.
Conclusion
Labor markets are currently normalizing after a period of extreme tightness. Monetary policy is focused on labor market conditions as there is concern about a wage-price spiral forming and inflation becoming embedded in the economy. Labor markets are not as tight as they appear on the surface though, and there is no evidence supporting a wage-price spiral.
For further details see:
Inflation: No Evidence Of A Wage-Price Spiral