INGN - Inogen: Cash Flow Gross Productivity Tightening
2023-06-16 21:25:49 ET
Summary
- Inogen's financial performance remains flat with no significant improvement since the last rating in December.
- Factors contributing to this rating include flat sales growth, cash burn, and a lack of valuation catalysts.
- I reiterate my hold rating.
Investment Summary
Following the latest set of investment updates, the case remains largely unchanged for Inogen, Inc. (NASDAQ: INGN ) in my view. Things haven't improved since my last publication in December on the company, more than 6-months ago now. The last 4 INGN publications are located below:
- No Change to Thesis
- Structural, Supply Chain Headwinds Remain
- Seasonal FCF, Tightening Margins, Supply Chain Headwinds
- Significant Downward Pressures Over The Last 2 Years Ex-Pandemic
Turning to the current period, there is little evidence on fundamental, sentimental or valuation grounds to suggest INGN could reprice in the medium-term. There are, however, several updates that are in need of discussion, to be added to the investment debate. Net-net, there is insufficient evidence to suggest INGN warrants a revised rating to buy in my opinion. I am reiterating it as a hold at a $10 valuation.
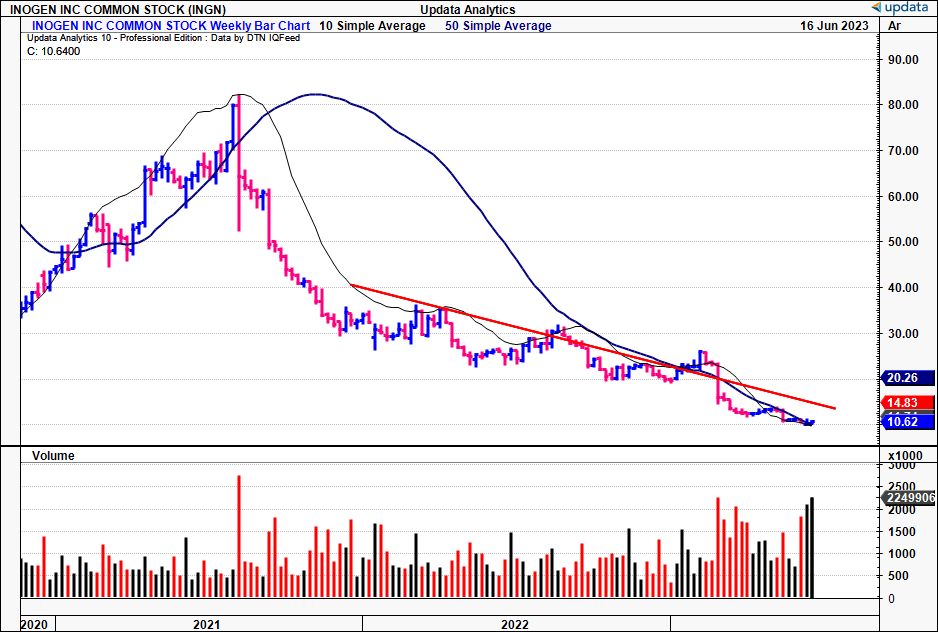
Figure 1. INGN long-term price performance
Data: Updata
INGN: Critical facts for hold rating
The key factors for discussion are listed below. I'd note the company's financials to be the major talking point here. Its latest numbers, posted early last month, with little arousing results. The market's response has been equally as flat.
1. Financial Performance and Development
- INGN booked Q1 revenue of $72.2mm, in line with the company's internal expectations, roughly 10.2% YoY decrease. This decline was demand-driven (volumes), as both international and direct-to-consumer ("DTC") sales came in lower. Within the revenue result is 170bps of FX headwind. On a "constant currency" basis (if that is at all relevant, but all the companies are reporting it, so I have decided to include it here just for namesake) revenue decreased by 8.5% compared to Q1 FY'22.
- The breakdown on INGN's Q1 top-line includes the following:
- Rental revenue, 29% of Q1 revenue, clipped 25.4% growth to $16.3mm, up from $13mm last year. Growth was underscored by fruitful outcomes obtained from its prescriber initiative and a cumulative uptick in rental patients on service. Furthermore, rental revenue benefitted from higher Medicare reimbursement rates in Q1, an industry-wide tailwind that has been driving revenues amongst peers in the last 3-6 months as well.
- Business-to-business ("B2B") sales eclipsed the $12.6mm mark, collating a 146.7% YoY growth schedule. However, INGN faced a decline in its international B2B turnover, which decreased by 32.1% to $19mm. The reason– last year, INGN prioritized shipments to Europe over the U.S., as its EU MDD certificate was due to expire in May 2022. Hence, last year was a high base.
- DTC sales were down 29.2% to $24.3mm, thanks to lower volumes during the quarter. On my analysis, this appears to be the result of a reduction in the number of sales reps in the headcount, which says something about their productivity.
- Moving down the P&L, gross margin compressed 220bps YoY to 39.2% for the quarter. This is low both on relative and absolute terms. As to the decrease in Q1, the fact INGN is moving more units through the lower margin B2B segment is a major contributor. Meanwhile, rental gross clipped a marginal decline of 60 bps to 54.1%. OpEx was up $4mm YoY to $52.6mm as well. The issue on gross margin should not be overlooked. Gross profit is the best indicator of a firms' ability to make money, and therefore create value for shareholders.
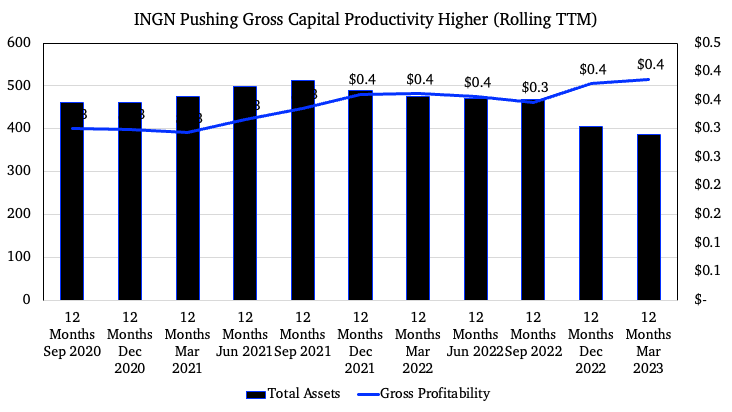
- Further, without the luxury of earnings growth for the buyer of INGN today, one must look to the gross productivity produced from its operating capital each period.
- With a glance below, you'll note this has been curling higher for the company over time, but still needs improving. Gross profit scaled to operating assets shows $0.40 in gross recycling back from every $1 invested into the company's operating capital. Two things, though: for one, the increase in 2022 stemmed from a reduction in capital intensity. Second, this hasn't shown much growth from 2021 numbers. This is a major headwind to attracting investment in my view. It is difficult to fire up the investment cortex when just 40 cents on the dollar are coming back from the capital provided (and then invested) by the business.
Figure 2.
Data: Author, INGN 10-k's
2. Financial statement forensics
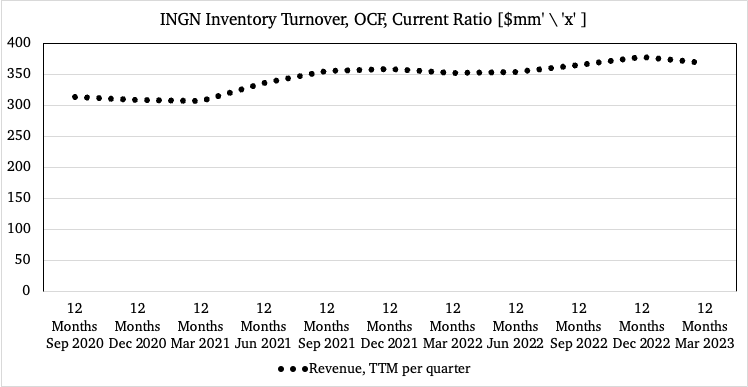
The ramp on turnover has been relatively flat for INGN these past 3-years. Figure 3 shows the same, plotting the rolling TTM revenue clip per quarter going back to 2020. Revenues have climbed from $313mm to $370mm in the TTM. At the market's current rating of 0.65x forward sales, an 84% discount to the sector, I can begin to see why. Is this is an opportunistic discount, or has the market got it right here? Looking at these numbers, and my own estimates in Appendix 1, it would appear the market is once again right. I am looking to $385mm in top-line revenue from INGN in FY'23, 220bps YoY growth and in-line with management's estimates.
Figure 3.
Data: Author, INGN 10-k's
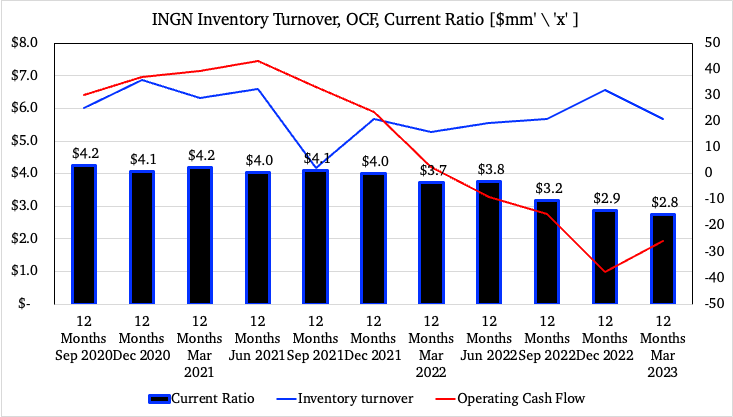
Underpinning the top-line performance, are the following comparative statistics:
- The ability to service short-term obligations has narrowed, but is still healthy. The current ratio (defined here as cash coverage over net operating liabilities) is at 2.8x from 4.2x in 2020.
- Further to this, operating cash flow has diminished substantially as the company has been burning cash through operations. It has burnt $49mm in cash off its balance sheet since Q1 FY'22.
- Further, inventory turnover has come down from 1.4x in 2020 to 1.1x in Q1. Note, this is calculated using quarterly values, whereas the other two are calculated on TTM values.
- Collectively, these points tell me of a number of things. For starters, there are obvious drains and pulls on liquidity. Two, it isn't generating enough cash flow to support the current level of operations. Finally, without the revenue growth to feed more income and cash down to the bottom lines, this situation looks to continue moving forward.
With these points in mind, the fundamental picture is supportive of a hold in my view.
Figure 4.
Data: Author, INGN 10-k's
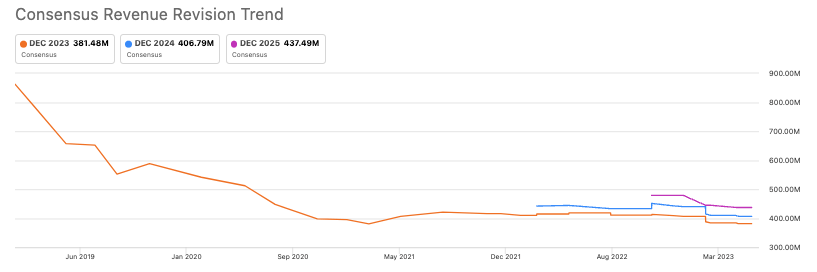
4. Sentiment factors
Quickly, there have been 4 down revisions to INGN's revenue in the past 3-months, with just 1 up revision. This tells me sentiment is flat and that consensus is pushing its estimates lower. Second to this, there is no options positioning in the stock to suggest active participants have positioned against the company. No speculative bets on INGN's upside, in other words.
Figure 5.
Data: Author, INGN 10-k's
One look at the charts tells the market's sentiment as well. The stock is down across all moving averages, and price returns are in the red in all time frames. So there is ample evidence to tell me sentiment on INGN is flat at best right now. Again, this supports a neutral view.
5. Valuation factors
As mentioned earlier, investors are selling their INGN stock at 0.6x forward sales , accepting a 85% discount to the sector. These are weak hands, and it would appear to be rightly so. Look at what we've discussed thus far:
- Flat sales growth;
- Just 40% gross capital return on operating assets;
- Cash burn of $49mm in 12-months, tightening OCF;
- Inventory turnover, current ratio both down as well.
These are the hallmarks of a company that investors will be paying a higher multiple going forward. Further, my numbers have the company to do $385mm in turnover this year, pulling to an operating loss of $26mm. At 0.6x this figure, this gets me to $10 per share neat, in-line with the current market price. In that vein, based on these assumptions, there doesn't appear to be any valuation catalysts either.
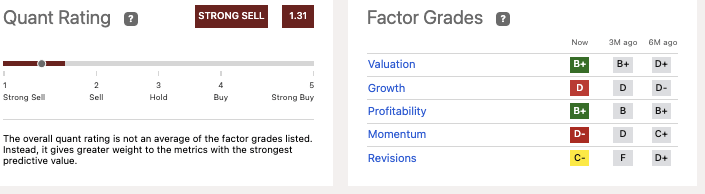
As an additional factor for consideration, the quant system also rates INGN with risks in its future outlook. It has the company rated a strong sell, which should definitely be considered for any potential buyer of INGN today. These findings are objective and are valuable in forming an investment view.
Figure 6.
Data: Author, INGN 10-k's
In short
Rigorous analysis of INGN's latest investment updates reveal there is a lack of catalysts to move the company's stock price forward. This looks to be the case for the next 3-6 months at least, in the absence of any data in its Q2 FY'23 numbers. Specifically, my assumptions point to a weak outlook on fundamental, sentimental, and valuation factors. Hence, the data is supportive of a neutral view in my opinion. Net-net, I am reiterating INGN as a hold at $10 valuation.
Appendix 1.
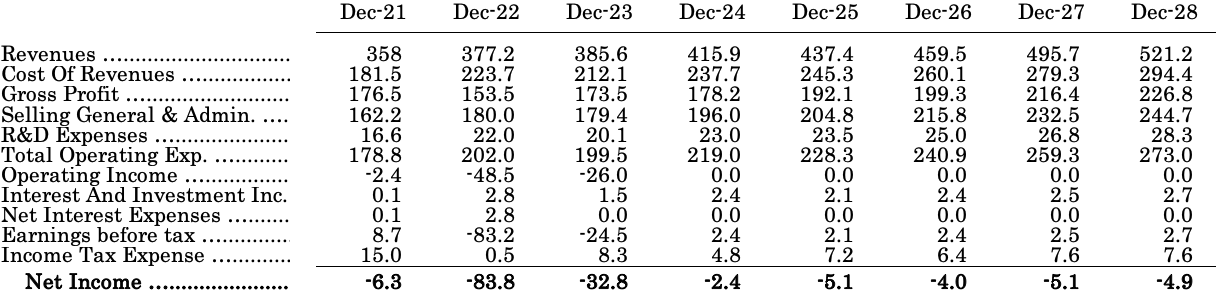
Data: Author
For further details see:
Inogen: Cash Flow, Gross Productivity Tightening