NSIT - Insight Enterprises: A Long Reinvestment Runway With Economic Returns On Capital
2023-09-07 06:40:56 ET
Summary
- Insight Enterprises has seen its stock reach 2-year highs, driven by robust economic characteristics and earnings leverage on sales growth.
- Still, the company faces risks from a slowdown in order volumes in its end-markets.
- Despite the mixed top-line performance, NSIT has shown strong capital productivity and the potential for future growth, supporting a buy rating.
Investment summary
Consilient investors chasing long-term capital compounders might be interesting in the investment prospects of Insight Enterprises ( NSIT ). The company spins off attractive rates of return from its investments, a fact the market has recognized heavily this year.
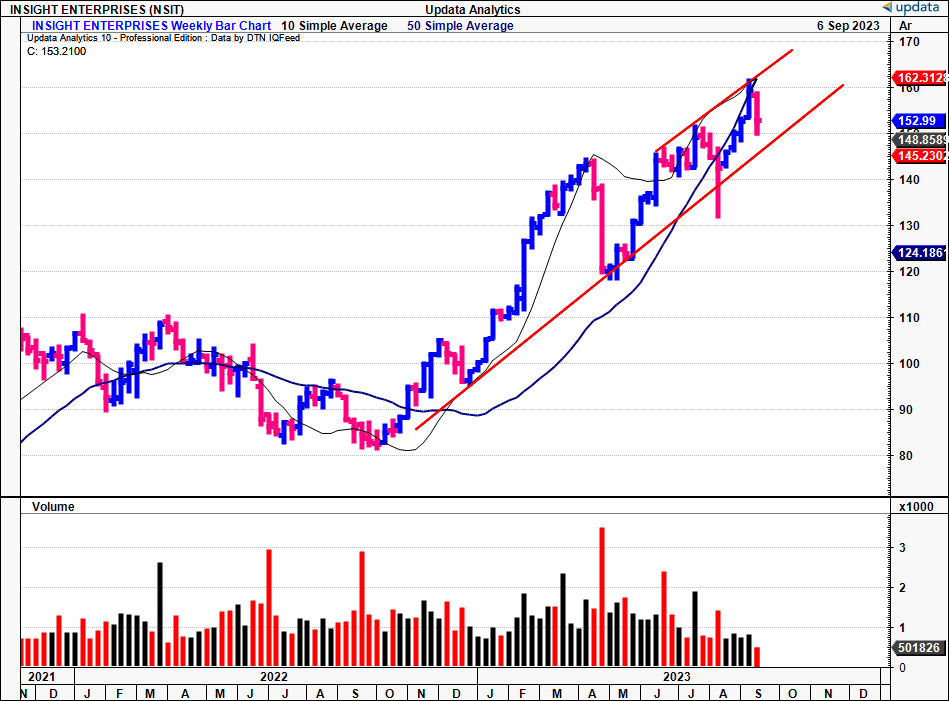
The stock has now sells at 2-year highs, as seen in Figure 1. The gains are underscored by:
- A robust set of economic characteristics that sees it spin off ~13-17% returns on capital at risk each TTM period
- Earnings leverage on sales growth, which could continue into FY'25 based on our growth assumptions
- Supportive valuations based on each of the above
Net-net, I rate NSIT a buy, eyeing $191/share as the next objective. This report will unpack all of the moving parts underneath the buy thesis.
Figure 1. NSIT weekly price evolution
Risks to investment thesis:
Investors must realize the following risks in full:
- The section on "valuation" at the end of this report shows that much of the company's earnings power may be priced in. My growth assumptions suggest it can sell at a higher multiple, but there is a risk the arc of risk/reward symmetry may be flattened from this.
- Macro-headwinds are also relevant, as we've seen a slowdown in broad tech markets. This was seen in NSIT's Q2 numbers, with larger customers paring back their order volumes. This could hamper sales growth if it continues at a similar pace.
- The company's margins as a percentage of sales are relatively tight and may be hindered by factors raised in point (2).
Investors should recognize these risks in full before proceeding to any investment decisions. If present, they may nullify the buy thesis.
Critical facts forming buy thesis
1. Q2 FY'23 insights - mixed top-line, cash conversion and gross profitability a standout
NSIT booked Q2 revenues of $2.3Bn , down 14% YoY on core EBITDA of $129mm, down ~11% from last year. These numbers fell below the company's internal expectations, chiefly due to a 24% year-to-year decline in device and hardware sales, which turned out to be a drag on its financials. I'd also mention that seasonality impacts (the usual June uptick in software demand) did not materialize as anticipated. Per the CEO on the call:
We believe the device market is near the bottom. In the second half of the year, we expect the rate of decline will be lower than in the first half of 2023 and we still expect devices to be down year-to-year in total for 2023.
Despite this, it still managed to clip a record-high gross margin of 18.4%. Gross was up 240bps, driven by a higher mix of cloud, Insight core services, and infrastructure products - each of which carries better margins compared to devices. Hence, the product mix offset the revenue downsides. I would comment, however, that 18% gross off $2.3Bn in revenues isn't the most attractive in my eyes.
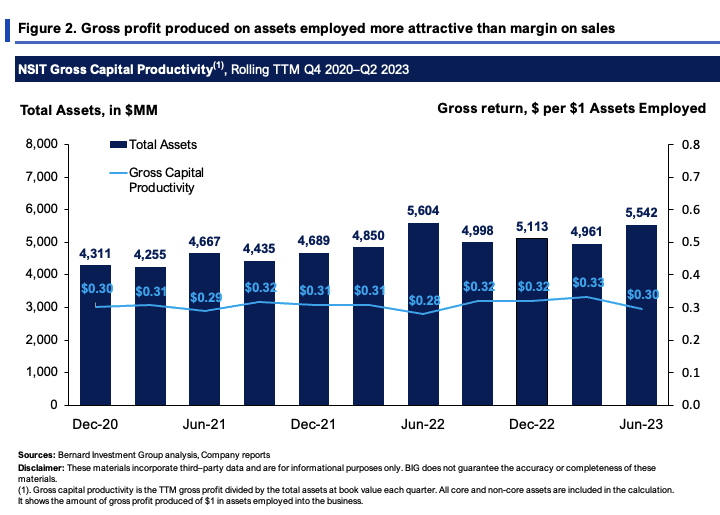
Figure 2 shows the gross profit the company is producing off the assets employed into the business on a rolling TTM basis. All core and non-core assets are included in the calculation.
Unlike the tight gross margin off revenues (with 18.4% its quarterly record), the gross capital productivity is more attractive. Compared to what amount of assets were required to conduct the business, it shows that:
- $5.54Bn in gross asset value produced the $1.64Bmm in TTM gross;
- Hence, NSIT saw a gross return of $0.30 off every $1 in assets employed last 12 months.
These are more attractive numbers that speak more to the capital productivity of the business versus operating efficiencies in rate on cost and so forth.
Figure 2.
Given the performance in H1 FY'23, management has called for "high single-digit decline in net sales for the year", likely getting to the $9.5-$9.6Bn range at the top. Critically, it looks to adj. earnings of $9.40-$9.60 share, reflecting a 4% increase at the midpoint. Figure 3 depicts our growth assumptions for the company into FY'25. The two points that stand out are, 1) the earnings leverage from FY'24-'25 of 2.2x and then 6.3x, plus the forward multiples of 14.3x and 11.9x in the same years. This implies every new $1 in sales could pull in $6.30 in earnings by FY'25. I'd say this is a constructive point moving forward.
Management's full set of expectations (bar revenues) are seen in Figure 4.
Figure 3.
Source: BIG Insights Estimates, Bloomberg Finance for market quotes
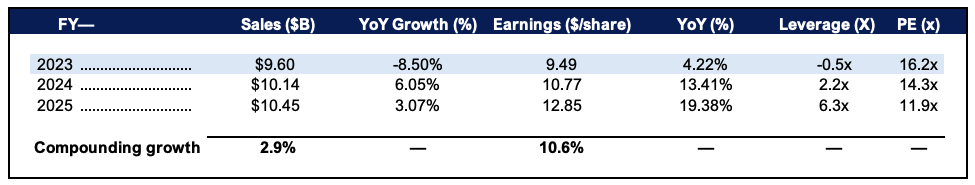
Figure 4.
Source: NSIT Q2 Investor Presentation
Meanwhile, the divisional highlights from the quarter were as follows:
- As mentioned, its hardware sales were down ~25% YoY in the U.S. to $1.16Bn, thanks to a wind-back in order volumes. Management wasn't anticipating a slowdown of this magnitude. Critically, it was the "large enterprise/corporate" and "commercial" orders that slowed, with only the public sector volumes catching a bid from last year, up to $329.8mm from $321.8mm last year.
- Its services business grew 220bps YoY to $403mm, clipping 7% growth for the YTD. It pulled this to gross of $72mm, up 700bps on a 30% margin. A more astute look observes growth across multiple segments of the portfolio, including applications, data, digital enablement, and networking.
- Meanwhile its software arm did $635mm of business on gross profit of $115mm, up 12% increase on last year. Growth was driven by the higher adoption of its software-as-a-service ("SaaS") and infrastructure-as-a-service ("IaaS") offerings.
Regarding working capital for the quarter - the cash conversion cycle reduced by 16 days to 32 days. This is a good thing in my view. Changes to working capital reflect the difference between earnings on the P&L and cash flows. NSIT has booked OCF of $188mm in H1 FY'23, $28mm of this generated in Q2. I'd finish the quarterly wrap up noting the company spent $100mm on buybacks in Q2, repurchasing c.720,000 shares. So far in the first half of 2023, it has repurchased >1.6mm shares for a total of $217mm. The company has ~$200mm left from the authorized $300mm for buybacks.
2. Economic characteristics
The company has employed $1.9Bn in capital from investors ($338mm debt issued, $1.56Bn earnings retained). It has put 100% of this at risk into business operations.
Critically, the $1.9Bn ($58.67/share) produces $9.99/share in post-tax income (net operating profit after tax), equating to a 17% trailing return on investment. Benchmarking this against a 12% hurdle rate (long-term market averages) NSIT produced $96mm in economic earnings, around 5% of the business capital invested.
As with most in the tech distribution space, business returns aren't margin-driven. $325mm in trailing pre-tax income gets you margins of just 3.4%. But NSIT turns its capital over 4-5x each TTM period - essential, as it booked $3.6Bn in the receivables account from Q2.
The reinvestment runway is important to note here as well. From Q2 2021-'23, it has invested substantial amounts of earnings at rates >12%. It recycled ~50% of earnings at the 17% rate of return - attractive economics, as, in my view, it compounded its intrinsic value by ~8.5% (0.5 x 0.17 = 8.5%). Don't overlook the $5.10 in FCF/owner earnings per share it threw off either, up from $4.60 2 years ago.
Figure 5.
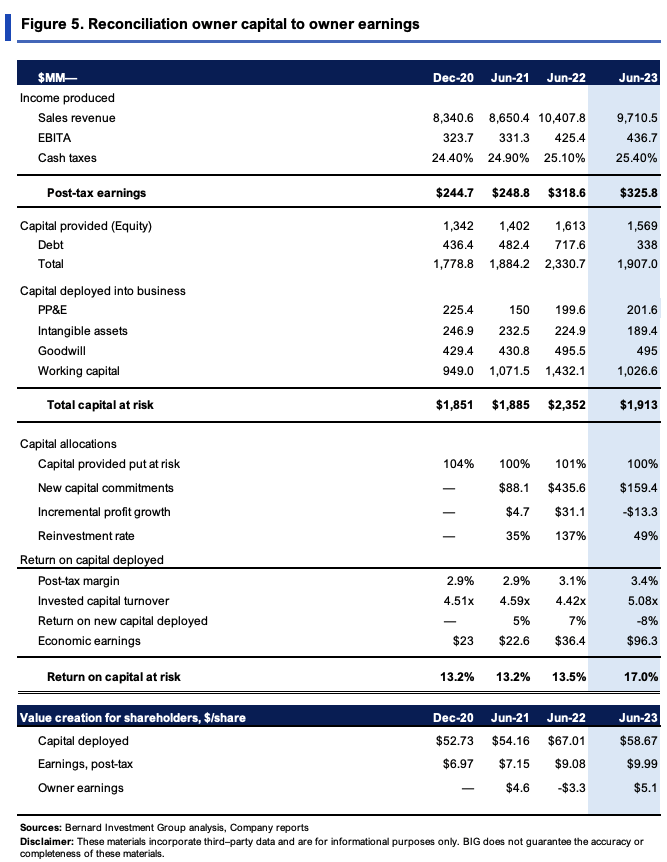
Valuation
The stock sells at 16x forward earnings and ~13x forward EBIT as I write, around 31% discount to the sector respectively. This opens an interesting debate as to what's potentially priced in and not.
On the one hand:
- Discounts to the sector;
- 7.6% pre-tax and 6.2% earnings yields;
- NSIT has created $3 in market value for every $1 in net assets.
But on the other:
- Factoring in growth assumptions, $16 for every $1 in future earnings is an ask - PEG ratio is at an eye-watering 19x.
- $1Bn of debt, almost 25% of the capitalization, and cash flow yields are less appealing at ~5% forward.
- The forward earnings power of its net assets and/or invested capital may be well priced in.
To check the last point, observe Figure 6. Here I check the return on capital vs. the hurdle rate, relative to what premium NSIT sells at to its capital at risk ("EV/IC"). Both show what returns are produced on its investments - one shows business returns, the second shows market returns on investment. Market returns are also a discounted set of expectations. So, a high EV/IC is good. It means investors value the capital highly, foresees it generating substantial profits, and so forth. But we're after mispricings, right? So at the trailing ROIC of 17%, what it can produce going forward, could be already priced in.
Figure 6.
BIG Insights
But it's what actually happens going forward that matters most. This is what revises expectations. Consider that: 1) A the trailing EV/EBIT of 15.58x = $6,280/$403 = 15.58x; 2) Should it reinvest another 50% of earnings at the 17% ROIC, it could grow NOPAT by 8.5%, as mentioned earlier to $437mm, 3) presuming same 15.58x multiple this would get you to a $6.8Bn EV, or $191/share.
Hence, there is support for NSIT to sell at this band in my view, supporting a buy rating.
In short
There are multiple growth factors to consider in the NSIT investment debate. Whilst top-line growth has been mixed across the portfolio this YTD, a look at the economic leverage on assets and capital employed is far more revealing. The company returns above-market rates of return on its investments, which are transposing over to gains in market value. NSIT could trade sell at a $6.8Bn EV and push to $191/share in my view should it continue reinvesting heavily at current returns on capital deployed. This would be the next price objective in my eyes. Net-net, rate buy.
For further details see:
Insight Enterprises: A Long Reinvestment Runway With Economic Returns On Capital