IBP - Installed Building Products: Not A Sustainable Reinvestment Rate
2023-08-18 10:20:59 ET
Summary
- Installed Building Products, Inc. experienced significant revenue growth since its IPO in 2014, driven by acquisitions and a growing construction sector.
- However, the company's growth model is unsustainable, with a high Reinvestment rate and increasing Debt-to-Equity ratio.
- IBP will need to reduce acquisitions and Reinvestments to sustainable levels, in line with the expected decline in total construction spending.
- A valuation on such a sustainable Reinvestment rate and slowdown in growth showed that there is no margin of safety.
Investment thesis
Installed Building Products, Inc. ( IBP ) IPO in 2014. By 2022, its revenue had increased by 5-fold while its total assets had risen by 8 times. But the growth came from a combination of acquisitions and tailwinds from a growing construction sector.
Since its IPO, it undertook 74 acquisitions spending USD 0.8 billion. But this is not a sustainable growth model as the average Reinvestment rate over the past 9 years exceeded 100 %. Its Debt Equity ratio went from 0.6 in 2014 to 1.9 in 2022.
It will have to reduce its acquisitions and/or Reinvestments to sustainable levels. But this will be in line with the expected decline in total construction spending. Based on this scenario, there is no margin of safety at the current price.
Business Profile
The company IPOed in 2014 as the second largest new residential insulation installer in the US. From 2014 to 2022, its revenue grew at 22.7 % CAGR due to the combination of organic growth and acquisitions.
Acquisitions seem to be an integral part of its business strategy. The company saw it as a way to diversify into new geographical areas as well as new products.
“Since 1999, we have successfully completed and integrated over 180 acquisitions, which has allowed us to generate significant scale and to diversify our product offerings while expanding into some of the most attractive new construction markets…” 2022 Form 10k.
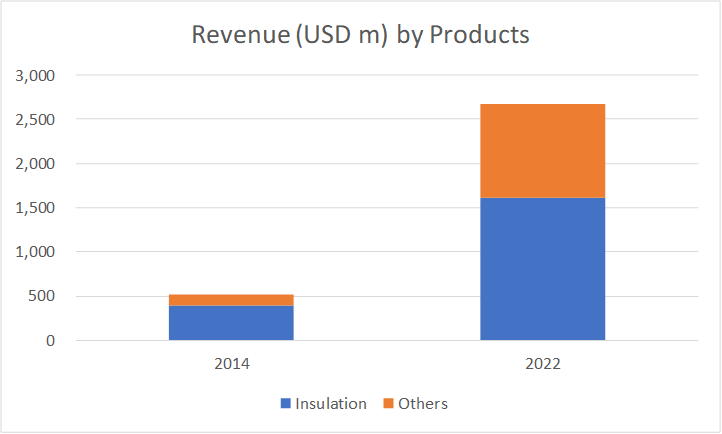
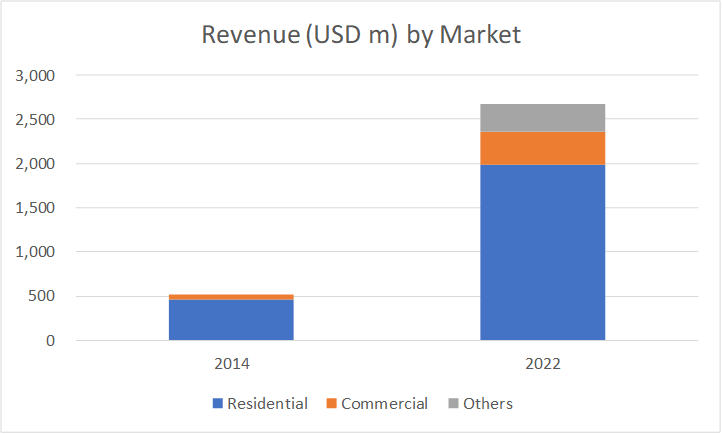
The data shows that the company had achieved the above goals. Refer to Charts 1 and 2 that show the changes in the business since its IPO.
- In 2014, insulation accounted for 76 % of the products. This was reduced to 60 % of the total product revenue by 2022.
- In 2014, the residential market accounted for 89 % of the revenue. This was reduced to 74 % in 2022.
- In 2022, IBP entered the distribution sector. It also reorganized its segment reporting so that the manufacturing unit is now a different segment. However, the contributions from these 2 new segments are not significant yet.
Chart 1: Revenue by Products (Author)
Chart 2: Revenue by Market (Author)
To give you a sense of the changes in the geographical spread, in 2014, the company operated in 33 states with 109 locations. By 2022, it operated in 40 states with 287 locations.
Business Performance
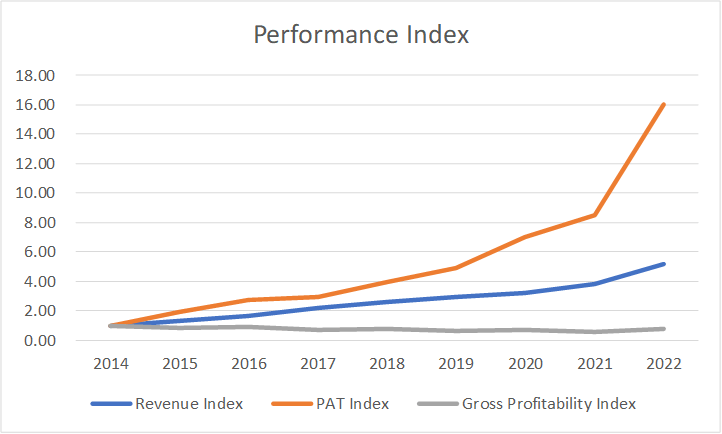
Since its IPO, revenue grew 5-fold while net income increased about 16 times. Refer to Chart 3.
But when you look at what drove the growth in revenue and profits, you can see that it was not improvements in efficiencies. For example, gross profitability (gross profits/total assets) declined. This meant that more and more total assets were used to deliver gross profits.
Chart 3: Performance Index (Author)
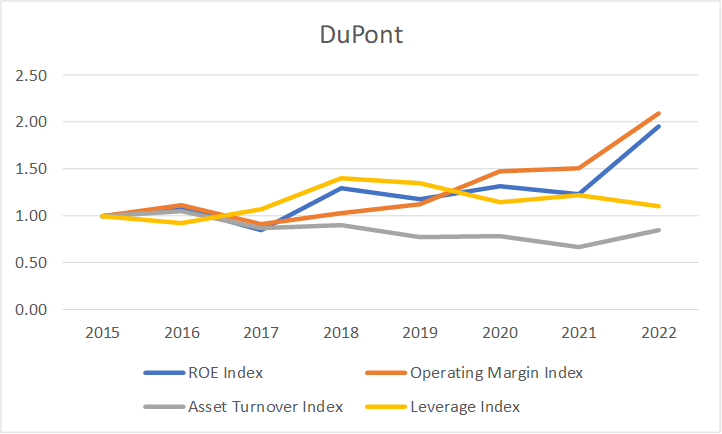
This lower capital efficiency picture is supported by the DuPont analysis as per Chart 4. You can see that the asset turnover in 2022 was lower than that in 2014. The improvement in the ROE was due to better margins and higher leverage.
I am not suggesting that the performance was not good. It is a good return as the average ROE over the past 9 years was 32 % compared to its current cost of equity of 11 % (Refer to Table 3 in the Valuation section).
I am merely pointing out the source of the growth and will show that this growth model is not sustainable.
Chart 4: DuPont Analysis (Author)
As will be shown later, IBP revenue growth was due to acquisitions and the tailwinds from construction spending.
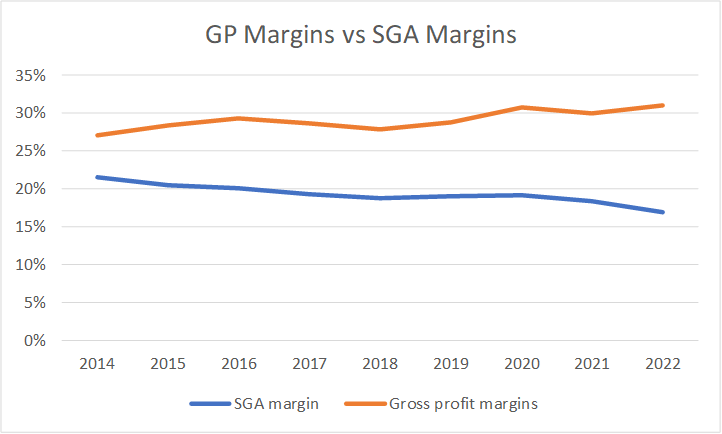
IBP margin improvements were due to the widening spread between the gross profit margins and the Selling, General, and Administration ((SGA)) expenses margins as illustrated in Chart 5. Again, I will show that this was due to higher revenue.
Chart 5: Margin Trends (Author)
To be fair to IBP, its business strategy is not really about improving operating efficiencies. Instead, the focus as per its 2022 Form 10k was:
“…enhance profitability from our operating leverage and national scale…Diversified end-market exposure…A more diverse customer base...”
What are the key takeaways so far?
- IBP is a more diversified group today with a wider geographical spread, better penetration of the commercial market, and less % contribution from insulation.
- While it had grown its topline and bottom line, it did not improve its capital efficiency.
Financial strengths
I would rate IBP as financially ok based on the following:
As of the end of Dec 2022, it had USD 230 million in cash. This is about 13 % of the total assets.
As of the end of Dec 2022, it had a Debt Equity ratio of 1.9. This had increased tremendously from 0.6 in 2014. While this is high, over the past 9 years, it re-paid USD 1.2 billion of Debt while issuing USD 1.9 billion new Debt. And to put this into perspective, during this period it spent USD 0.6 billion on dividends and share purchases.
Since its IPO, it had managed to generate positive cash flow from operations every year. Over the past 9 years, it generated USD 1.0 billion cash flow from operations compared to the net income of USD 0.7 billion. This is a very good earnings-to-cash conversion rate.
On the negative side, its cash conversion cycle doubled from 25 days in 2014 to 57 days in 2022. You should not be surprised by this as the company focus was not operating efficiencies but product-market-geographic diversification.
Drivers of Growth
2 key factors contributed to the revenue growth – acquisitions and tailwinds from a growing construction sector.
Acquisitions
Over the past 9 years, IBP spent about USD 0.8 billion on 74 acquisitions. The top 3 acquisitions accounted for about 1/3 of the total purchase price.
- The largest acquisition was for AMD Distribution in 2021 for USD 126 million.
- This was followed by the USD 117 million for Alpha in 2017.
- The third largest was for Central Aluminum Supply of North Jersey, at USD 78 million in 2022.
If you ignore these top 3, the average purchase price for each acquisition was about less than USD 10 million each. Considering that the annual average CAPEX was USD 33 million, these small acquisitions each seem “financially reasonably-sized”. The question is whether it was cost-effective.
To get a sense of the contribution of the acquisitions, I consider the growth in terms of the following:
- The same branch growth. This was defined by the company as the period-over-period growth for branch locations owned greater than 12 months. I would consider this as organic growth.
- The balance between the total growth and same branch growth was deemed as due to acquisitions.
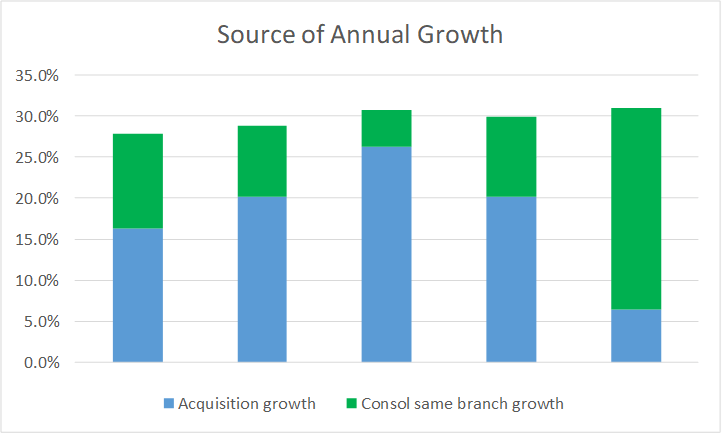
The company only provided the data for the same branch growth from 2018. Based on these, as can be seen from Chart 6, I deduced that growth due to acquisitions was about 1/3 higher than organic growth. In other words, acquisitions accounted for more than half of the total growth.
Chart 6: Source of Growth (Author)
Notes to Chart 6:
a) Same branch growth was derived from Form 10k.
b) Acquisition growth = total growth – same branch growth.
I established indices from 2017 to 2022 with 2017 set to 100 for both growths. The index for acquisition in 2022 was 30% higher than the index for organic growth.
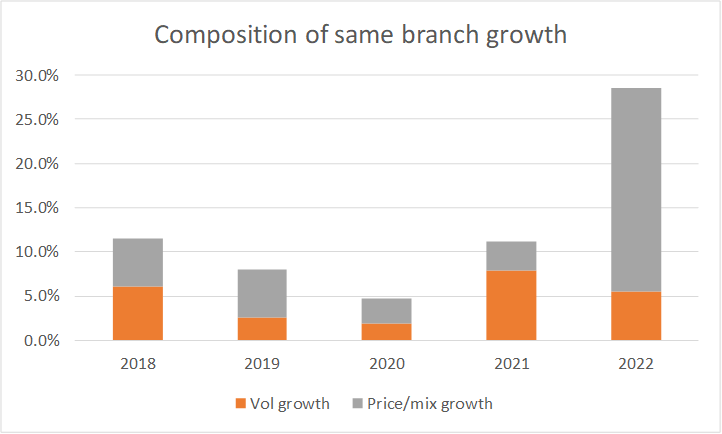
A breakdown of the same branch growth into volume and price-mix growth showed that except for 2022, volume and price-mix growth played an equal role in organic growth. Refer to Chart 7.
Chart 7: Composition of same branch growth (Author)
Notes to Chart 7:
a) I established indices from 2017 to 2021, with 2017 set to 100 for both volume growth and price-mix growth. The index level for volume in 2021 was about the same as that for price-mix.
b) If I used the same approach for up to 2022, the price-mix growth index would be 15 % higher than the volume growth index.
Unsustainable Reinvestment Rate
Growth needs to be funded and I look at one metric for this – Reinvestment rate. This is defined as (Reinvestment / After-tax earnings) where:
Reinvestment = CAPEX + Acquisitions – Depreciation & Amortization + Net Change in Working Capital.
After-tax earnings = EBIT(1-t).
The Reinvestment will impact the Free Cash Flow where:
Free Cash Flow to the Firm (FCFF) = EBIT(1-t) X (1 – Reinvestment rate).
Reinvestment rate = Reinvestment / EBIT(1-t).
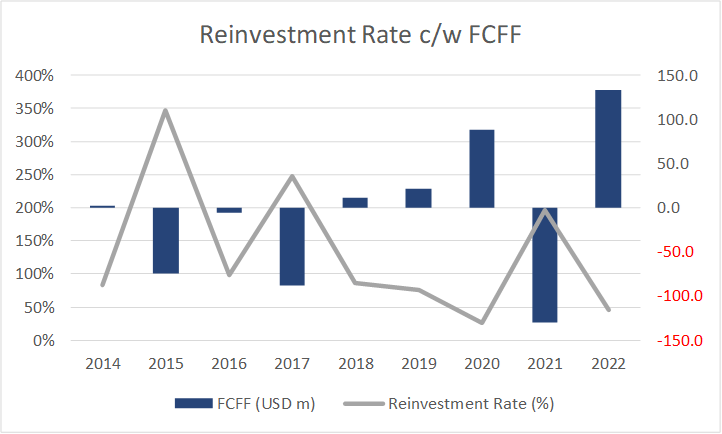
I of course require the FCFF to value the company. But even before we talk of valuation, the concern is that the company's average Reinvestment rate over the past 9 years exceeded 100%. This meant that its investments to grow the business exceeded the after-tax earnings. Refer to Chart 8.
This is not sustainable. Over the past 9 years, IBP had issued net Debt to make up for the shortfall. The alternative would have been to issue new capital.
Unfortunately, there is not enough information to break down the Reinvestments into those for acquisitions and those for organic growth. But to give you a sense of the breakdown, over the past 9 years as per the cash flow from investments, less was spent on CAPEX.
- It incurred USD 0.3 billion for CAPEX.
- It spent USD 0.8 billion on acquisitions.
I had shown earlier that acquisitions accounted for more than half of the total revenue growth. Assuming that all the CAPEX was for organic growth, this meant on a growth per-expenditure basis, organic growth was more cost-effective.
Chart 8: Reinvestment Rate and FCFF (Author)
Note that from Chart 8, there were 3 years where the company had large negative FCFF. The impact was that from 2014 to 2022, the average FCFF was negative. We surely cannot use this historical performance to value IBP.
But more concerning is the high Reinvestment rate. Something has to give way and I suspect that it would be the size and/or number of acquisitions.
In other words, if there is no fresh capital call and Debt is to be reduced, I would expect growth to slow down as acquisitions get curtailed. But this is something manageable as I had shown that most of the acquisitions over the past 9 years were relatively small ones.
Construction Tailwinds
Over the past 9 years, total construction spending in the US grew at 7.3 % CAGR. IBP benefited from this as there was a 0.99 correlation between IBP revenue and total construction spending.
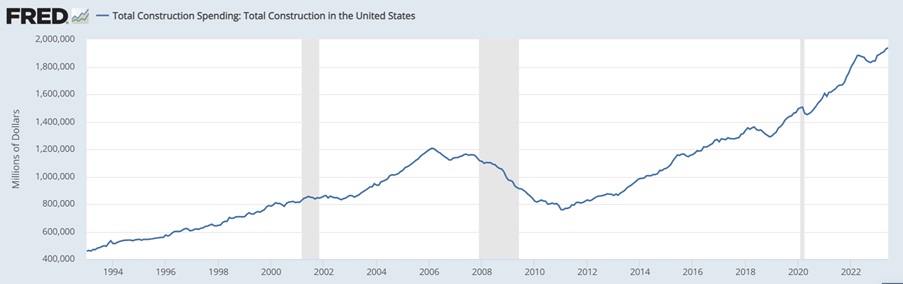
Chart 9: Total construction spending (FRED)
Part of the total construction spending is due to Housing Starts and we have seen signs of weakening here. The company had alluded to this in its 2022 Form 10k.
“…Starts are forecasted to fall to 1.3 million starts in 2023…which would be the fewest starts since 2018…and the commercial sector is predicted to see a 3% decline in starts in 2023 over 2022…”
Whether there is going to be a downtrend like what happened in 2007/2011 is still open for debate.
The total construction tailwind also drove improvements in the gross profit and SGA margins. From 2014 to 2022, there were the following correlations between the total construction spending and:
- Gross profit margins of 0.85.
- SGA margins of negative 0.95
I think that the above is more than just spurious correlations. SGA expenses are not variable and you would expect SGA margin to reduce with higher revenue. Gross profit margin would also benefit from economies of scale given higher revenue.
The improvements in margins are in line with the company's position as per its 2022 Form 10k.
“We believe the benefits of this diversification include…Margin enhancement by leveraging branch costs across multiple products…”
What are the key takeaways for our valuation?
- The high historical growth rates should decline to a steady long-term US GDP growth rate.
- We should work on a sustainable Reinvestment rate basis. I used the growth equation of Growth = Reinvestment rate X Return to derive the sustainable Reinvestment rate.
Valuation
I valued IBP based on Free Cash Flow to the Firm (FCFF) model where the growth for the first 5 years declined to reach the long-term steady growth of 5%.
I considered two Scenarios:
- Scenario 1. This is a conservative one where the margins were based on the 2014 to 2022 average values.
- Scenario 2. This is an optimistic one where the margins were based on the 2022 values.
In the model, the revenue growth rate starts at the 2014 to 2022 CAGR and then reduces proportionately to 5% in 5 years. Thereafter it continues at this terminal rate.
For both scenarios, I assumed the same tax rate, returns as defined by EBIT(1-t) / Total Capital Employed, and discount rate.
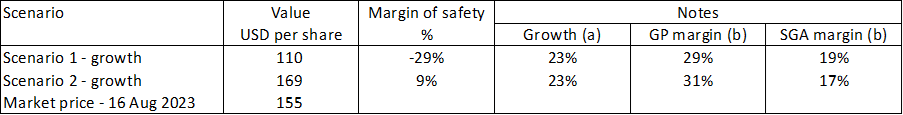
As can be seen from Table 1, there is no margin of safety under Scenario 1. At the same time, the 9 % margin of safety under Scenario 1 is below my 30% margin of safety target. This is not an investment opportunity.
Table 1: Summary of Valuation and Margin of Safety (Author)
Notes to Table 1:
a) This is the revenue growth for Year 1 based on the 2014 to 2022 growth rate. It then reduces to proportionately to 5 % in Year 5 . Thereafter it is terminal growth at 5%.
b) Scenario 1 = 2014 to 2022 average values. Scenario 2 = 2022 values.
Valuation model
Table 2 shows my valuation model. This is a Free Cash Flow to the Firm model where:
- I start with a high growth rate in Year 1 that reduces proportionately every year to reach 5 % in Year 5. This 5% is assumed to be the terminal growth rate and is based on the long-term GDP growth rate.
- The critical parameters for the 2 Scenarios are the gross profit margins, and the SGA margins.
- I assumed that the tax rate, return, and WACC are the same under both Scenarios.
- FCFF = EBIT(1-t) X (1- Reinvestment rate).
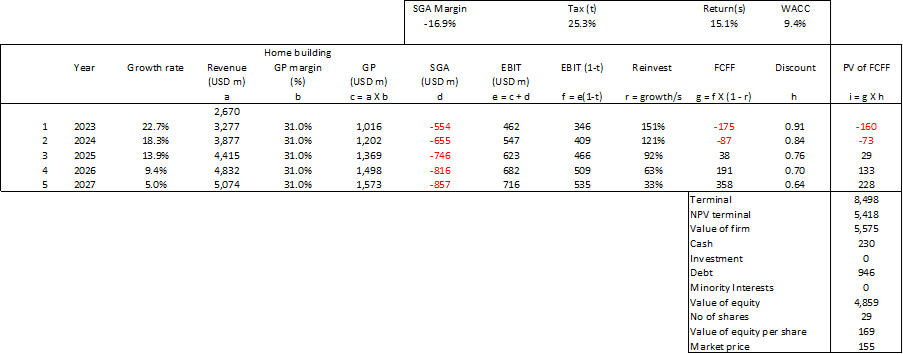
Table 2: Valuation model (Author)
The tax rate was based on the 2020 to 2022 average rates.
The Reinvestment rate for each year was derived based on the equation Growth = Return X Reinvestment rate.
Return = EBIT(1-t)/TCE.
TCE = Total Capital Employed = Equity + Debt – Cash equivalents
The Return was based on the (average 2014 to 2022 EBIT/TCE) multiplied by One minus the (2020 to 2022 average tax rate).
The WACC was based on the first page of a Google search for the term “IBP WACC” as shown in Table 3.
Table 3: Cost of Capital (Various)
The terminal value was based on the Year 5 FCFF with a 5% growth rate.
The Net Present Value of the terminal value is based on discounting the terminal value at the Year 5 discount rate.
The value of Equity = Value of the Firm + Cash equivalents + Long term investments – Debt – Minority Interests.
The Cash, Long term investments, Debt, and Minority Interests were based on the Dec 2022 values.
Risks and limitations
My valuation hinges on 2 critical assumptions:
- A change in the Reinvestment rate.
- A slowdown in growth.
The crux of my valuation is the assumptions about the Reinvestment rates. This assumes that the company would be rational and match the Reinvestment rates with its earnings. But if management does not behave "rationally" and continues with the high Reinvestment rates, the long-term value would be lower.
Over the long term, the construction sector is cyclical. You can see the last downtrend from 2007 to 2011 as per Chart 9. My growth model assumes that we will not experience a downtrend over the next 5 years. While I assumed a declining growth, it was not a contraction.
Housing Starts has begun to show some weaknesses as per Chart 9. If Housing Starts go into a downtrend, I am sure it will affect the total construction spending.
I have also assumed that the gross profit margins and SGA margins for Scenario 2 can be sustained. But these were driven by revenue growth. When there is a slowdown in the total construction starts, I worry whether these margins for Scenario 2 are sustainable. I had shown that the company's focus was not on capital efficiencies. So changes in margins will have a higher impact on its earnings.
The main point is that despite the aggressive assumptions, there is not enough margin of safety.
Conclusion
Over the past 9 years, IBP benefited from the growth in total construction spending. There was a multiplier effect as IBP also had an acquisition program that benefited from the growth in construction spending.
The company used the construction spending tailwinds to grow its revenue and profits manyfold. Kudos to management for taking advantage of this. IBP is today a much larger company compared to when it IPO.
But profit growth was driven more by improvements in margins rather than improvements in capital efficiency. But further margins improvement will be difficult when revenue growth declines.
The total construction spending is cyclical and the company has positioned itself to mitigate the cyclical impact.
- It had reduced the contribution from the residential as well as the insulation market.
- It had widened its geographical reach and just ventured into distribution.
But its growth was driven by an unstainable Reinvestment rate. This meant that growth will have to slow down. I expect a reduction in acquisitions. But this is manageable as most of the acquisitions are small-sized ones.
Historically, acquisitions accounted for a larger part of the growth. When there is a reduction in acquisitions, I would expect growth to slow down a lot.
The issue is its current stock price. Based on an optimistic valuation model and assuming a slowdown in growth, there is no margin of safety.
Key message? This is a financially sound company with good earnings performance. It took advantage of the situation to make hay while the sun shone. But now is the time to re-look at the growth model and adopt a more sustainable Reinvestment plan. This will result in lower growth. My valuation and margin of safety reflects this.
I am a long-term fundamental investor. As such, I try to look at how the business will perform over the next decade or so. My valuation is also from this perspective. This is not an analysis or valuation for those looking for gains over the next few months.
For further details see:
Installed Building Products: Not A Sustainable Reinvestment Rate