CIBR - Interest Rates And Inflation And AI... Oh My! - Q2 2023 Commentary
2023-07-26 11:50:00 ET
Summary
- While Q1 2023 ended with the banking instability threatening to erase market gains, U.S. equity markets recovered, and the Syntax US 500 Large Cap Index rose 8.9 % in Q2, driven predominantly by an AI-induced rally.
- Cooling inflation numbers and expectations of the Fed ending its course of interest rate hikes at the end of the year have boosted investor optimism about the market.
- While robust economic data has put some recession fears to rest, investors should be cautious about interpreting the market’s headline returns without understanding the underlying performance drivers.
Introduction
In recent decades, global investors have witnessed numerous episodes of rampant inflation, including in the U.S. from 1973 to 1982, due to two surges in global oil prices. While inflation has been a minimal factor in the developed markets until recently, that has not necessarily been the case in the developing markets. For instance, from 2007 to 2008 in Zimbabwe, the government declared inflation illegal after prices rose over a billion percent. In 1975 and again today in Argentina due to high interest payments on the national debt.
The latest U.S. inflation report showed that the Consumer Price Index ((CPI)) climbed 4.0% and 3.0% in May and June, respectively, steadily declining from its 9.2% peak a year ago. While supply chain constraints have eased and the labor market has cooled due to announced layoffs, particularly in the technology sector, the Federal Open Market Committee ((FOMC)) has only recently paused its aggressive inflation rate hikes, which began in March 2022 and has resulted in nine consecutive hikes of 4.75% over the last ten months. In the FOMC’s June meeting, it cited the need for more time to assess the economic outlook while heavily indicating that it plans to continue to raise rates until the end of the year. While increasing interest rates has helped to curb inflation, the FMOC’s monetary policy has also come at a cost, almost leading to a banking crisis (e.g., Silicon Valley Bank) in the U.S. and exacerbated recession fears.
While the first quarter ended with the banking instability threatening to erase market gains, U.S. equity markets recovered, and the Syntax US 500 Large Cap Index rose 8.9 % in Q2, driven predominantly by an AI-induced rally.
Exhibit 1: Syntax Core Index Performance Summary
| Index |
| Ticker |
| Q2 2023 (%) |
| 12 months (%) |
| Syntax US 500 Large Cap Index |
| SY500 |
| 8.9% |
| 19.5% |
| Syntax US 1000 Large and Mid Cap Index |
| SY1000 |
| 8.6% |
| 19.4% |
| Syntax US 2000 Small Cap Index |
| SY2000 |
| 4.7% |
| 12.1% |
| Syntax US 3000 Index |
| SY3000 |
| 8.4% |
| 19.0% |
| Syntax US 200 Mega Cap Index |
| SY200 |
| 10.0% |
| 21.1% |
| Syntax US 400 Mid Cap Index |
| SY400 |
| 4.2% |
| 15.6% |
| Syntax Stratified SmallCap Index |
| SYSCTR |
| 2.7% |
| 9.5% |
| Syntax Stratified LargeCap Index |
| SYLCTR |
| 3.9% |
| 14.4% |
| Syntax Stratified MidCap Index |
| SYMIDTR |
| 5.0% |
| 18.1% |
Source: Syntax. Performance as of 30 June, 2023. Total return performance does not reflect fees or implementation costs, as an investor cannot directly invest in an index.
The Syntax 3000 ended the quarter at 8.4%, while the Syntax US 200 was up 10.0%, extending its rally from Q1 and consequently outperforming the broad market. The Syntax US 500 beat the market by 50 basis points. The Syntax US 1000 slightly outperformed the broad market, ending Q2 with an 8.6% return. Despite underperforming the market, the US 2000 ended Q2 at 4.7%. Our more diversified Stratified Weight Indices underperformed the market but still ended Q2 up 2.7% for the SmallCap Index, 3.9% for the LargeCap, and 5.0% for the Midcap Index. This relative underperformance is expected during periods of high momentum, as observed year to date; the Stratified Weight Indices slightly outperformed equal weight measures of these same universes year to date.
Last quarter, we noted that seven companies generated over 50% of the market’s 7.5% rally. In comparison, its equally weighted counterpart returned only 2.9%. This trend persisted in the second quarter when NVIDIA ( NVDA ), the computer graphics processor and chip manufacturer, which has benefitted from the rapid adoption of AI, joined the trillionaires club and became the seventh U.S. company with a capitalization of over $1 trillion.
While these “Magnificent Seven” companies - Apple ( AAPL ) (+49.7% YTD), Alphabet ( GOOG , GOOGL ) (+36.3%), Amazon ( AMZN ) (+55.2%), Microsoft ( MSFT ) (+42.7%), NVIDIA (+189.5%), Meta ( META ) (+138.5%), and Tesla ( TSLA ) (+112.5%) - have strongly outperformed year-to-date, that has not been the case for the rest of the S&P 500; the average stock excluding these seven is up 7.7% YTD. While robust economic data has put some recession fears to rest, investors should be cautious about interpreting the market’s headline returns without understanding the underlying performance drivers.
Exploiting Investment Opportunities in the AI Value Chain
Whilethe Magnificent Seven have been the primary beneficiaries of the emergence and adoption of AI, other companies can also be well-positioned to take advantage of this theme. Exhibit 2 breaks down the AI value chain into various components, illustrating potential opportunities investors can pursue to gain exposure to the AI trend. For example, companies focused on computer hardware and cloud platforms have been among the first to reap the benefits of the recent AI boom. Additionally, foundation models, such as ChatGPT, have been widely adopted by end-users, model hubs, on which applications are built, and access models could be potential places where investors can harness value. And of course, an enormous range of industries that leverage AI technology to deliver applications and services for their clients.
Exhibit 2: Generative AI Value Chain
Source: McKinsey and Syntax. The graphic above has been adapted from " Exploring opportunities in the generative AI value chain ." Company names are provided as non-limiting examples of companies engaged in various parts of the AI Value Chain. MLPOs are machine learning operations.
Affinity Thematic Lens
Using the Syntax Affinity Platform, investors can view the market through a wide range of unique thematic lenses and analyze the performance of groups of relevant companies. Themes are often persistent in the markets for several months or quarters; related stocks can persistently out- (or under-) perform. During the second quarter, the following emerged as themes to watch:
Leaders
Tourism
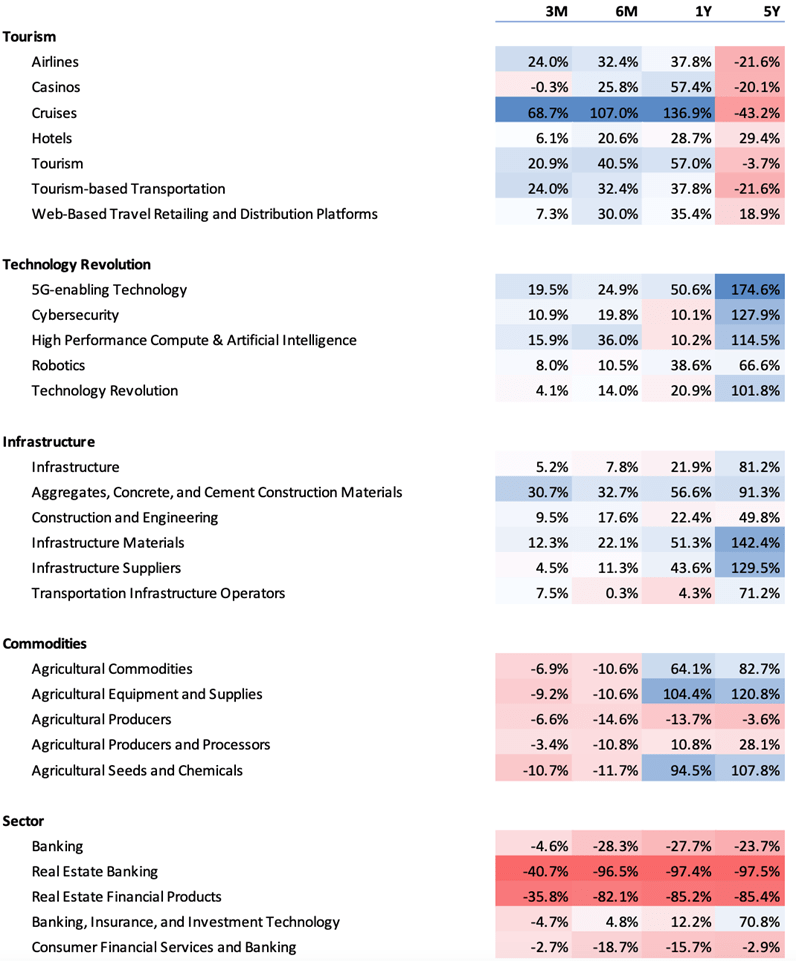
While the Covid pandemic halted travel globally, this year’s tourism projections indicate that the travel industry has rebounded. The Affinity Tourism lens was up 20.9% for the second quarter. The Cruise Ship and Airline groups, whose businesses were brought to a near standstill in 2020, are rallying significantly with returns as high as 69.7% and 24.3% in Q2. Cruise ship companies like Carnival Corporation ( CCL , CUK ), Norwegian Cruise Line ( NCLH ), and Royal Caribbean ( RCL ) are among the top performers, each returning above 50% for the quarter.
Technology Revolution
Our Q1 commentary discussed how the AI revolution fueled outperformance in companies like NVIDIA, Advanced Micro ( AMD ), and Intel ( INTC ). This trend persisted in Q2 when NVIDIA reported higher-than-expected revenue ($7.19 billion vs. $6.52 billion) and higher-than-expected earnings per share ($1.09 vs. $0.92) for Q1, attributing the results to increasing demand for its Graphic Processing Units (GPUs).
Infrastructure
The Biden Administration’s Infrastructure Investment and Jobs Act and Inflation Reduction Act mandated that $1.25 trillion be invested across the transportation, energy, water resources, and broadband sectors over the next five to 10 years. This legislation has resulted in material investments in companies specializing in construction materials, such as aggregates, concrete, and cement, which returned over 30% in Q2.
Laggards
Banking
Q1 was marked by significant losses in the banking sector that were linked to the Fed’s aggressive interest rate hikes and resulted in the loss of investor confidence in the sector and the broader market. Sentiment regarding banks improved as they posted modest losses in Q2 (-4.6%), significantly better than the -28.3% return in Q1. Real Estate Banking and Real Estate Financial products continued to perform poorly, returning -40.7% and - ? 35.8%, respectively.
Agriculture
High inflation numbers resulted in negative returns within commodities, particularly agricultural commodities. Falling wheat and corn prices due to increased supply resulted in negative returns in groups such as Agricultural Seeds and Chemicals (-10.7%) and Agricultural Equipment and Suppliers (-9.2%) in Q2.
Hope on the Horizon?
Cooling inflation numbers and expectations of the Fed ending its course of interest rate hikes at the end of the year have boosted investor optimism about the market. However, the most significant market driver has been the recent excitement about AI and its expected benefits, which have led seven companies (Amazon, Alphabet, Tesla, NVIDIA, Apple, Meta, and Microsoft) to drive the market and account for half its gains in Q2. It is too soon to determine whether AI will live up to the hype, be another passing trend, or somewhere in between. Investors should take care to balance fear of missing out with attention to valuations and the macroeconomic outlook.
Exhibit 3: Affinity Thematic Lenses - Q2 2023 Leaders and Laggards
Source: Syntax, Affinity, S&P Dow Jones Indices. Performance is calculated as the weighted average total return of the subset of the S&P 500 Equal Weight Index constituents who are members of the Affinity Theme. 3M, 1Y, and 5Y show total return for the 3-, 12- and 60-months ending 30 June 2023 Since inception reflects total return from 31 December 1991. Performance does not reflect fees or implementation costs.
Original Source: Author
Editor's Note: The summary bullets for this article were chosen by Seeking Alpha editors.
For further details see:
Interest Rates And Inflation And AI... Oh My! - Q2 2023 Commentary