SGSOF - Introduction To The Testing Inspection And Certification (TIC) Market
2023-03-31 12:13:40 ET
Summary
- We present an overview of the testing, inspection, and certification (TIC) market.
- We highlight the different strategies that have been pursued by the main 4 players over time.
- Our initial conclusion is that there is much to like about this particular niche of industrial support services.
- Also, while the entire peer group has delivered attractive total shareholder returns over time, Eurofins clearly stands out from the pack.
Introduction to the Testing, Inspection, and Certification (TIC) market
Laboratory testing, inspection, and certification services in the areas of quality, safety, performance, and other criteria (e.g. environmental impacts) are commonly referred to as the Testing, Inspection and Certification (TIC) market.
TIC services encompass several types of tasks, including laboratory or on-site testing, management process audits, documentary checks, inspections across the entire supply chain and data consistency verification. These activities may be carried out on behalf of the end user or purchaser, at the request of the manufacturer, or on behalf of public or private authorities. TIC services are called for at every stage of the supply chain and apply across all major industries.
Amongst other factors, demand for TIC services is driven by companies' need to obtain a license to operate, access global markets, and facilitate trade, which can only be achieved by demonstrating their compliance with an increasingly large number of industry standards and regulations. Moreover, TIC services help companies reduce risks related to product quality, health, safety, and environment protection, which serves to protect their brand names. Key sectors for TIC services include consumer goods & retail, food & agriculture, oil & gas, construction, chemicals, metals & minerals, industrial goods, and aerospace & automotive, amongst others.
According to estimates by Bureau Veritas, the global market for TIC services amounted to nearly EUR 250 billion in 2021. Over half of that market (60%) is the 'internal' market, where the companies themselves perform these services as part of quality control and assurance, along with the market served by public bodies and organizations such as customs, competition authorities, port authorities or industrial health and safety authorities. The remaining 40% of the market, or approx. EUR 100 billion, is the 'outsourced' market where services are provided by specialized private organizations or firms. The largest of these firms are SGS SA ( SGSOF ), Bureau Veritas SA ( BVRDF ), Eurofins Scientific SE ( OTCPK:ERFSF ), and Intertek Group Plc (IKTSF).
The TIC market is highly fragmented, with many local or regional players that operate in specific niches and/or geographies. As such, these companies often struggle to meet the needs of large multinational companies. While the industry has slowly been consolidating, it remains very fragmented as of today, with the largest four companies accounting for less than 25% of the total 'outsourced' market. Based on 2022 sales and an estimated market size of EUR 100 billion, the market share of the four largest players is as follows: Eurofins Scientific (6.7%), SGS (6.5%), Bureau Veritas (5.7%), and Intertek (3.9%). According to estimates by Allied Market Research, the TIC market is expected to grow at a mid-single-digit compounded annual growth rate ((CAGR)) over the coming decade.
Overview of the main players
Let us present a brief overview of the main players active in the TIC market:
Company websites & IR publications
Sales by geography:
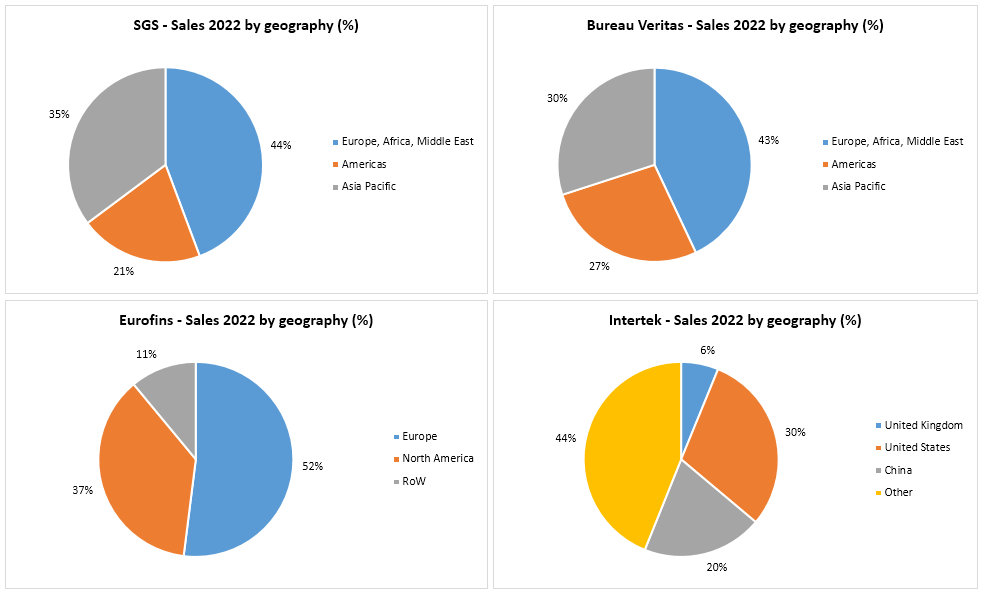
Sales by segment:
Note: Eurofins' segmentation is only by geography
Comparative analysis of financial performance
With the basic descriptive information out of the way, let us now turn to how these companies have performed historically. Note that since both Bureau Veritas and Eurofins report in EUR (while SGS and Intertek report in CHF and GBP respectively), we've decided to do this analysis in EUR.
When looking at the graphs below, it becomes immediately evident that one of these four companies stands out from the pack: Eurofins. Despite being the youngest of its peers by far, one can see that during the last 10 years and beyond, the company has grown at a very fast pace to rival SGS for market leadership. We can also note that the 2020-2022 period - which was dominated by the COVID crisis - resulted in very different outcomes, with all firms experiencing a decline in sales and profits with the exception of Eurofins, which benefited from its exposure to COVID testing activities.
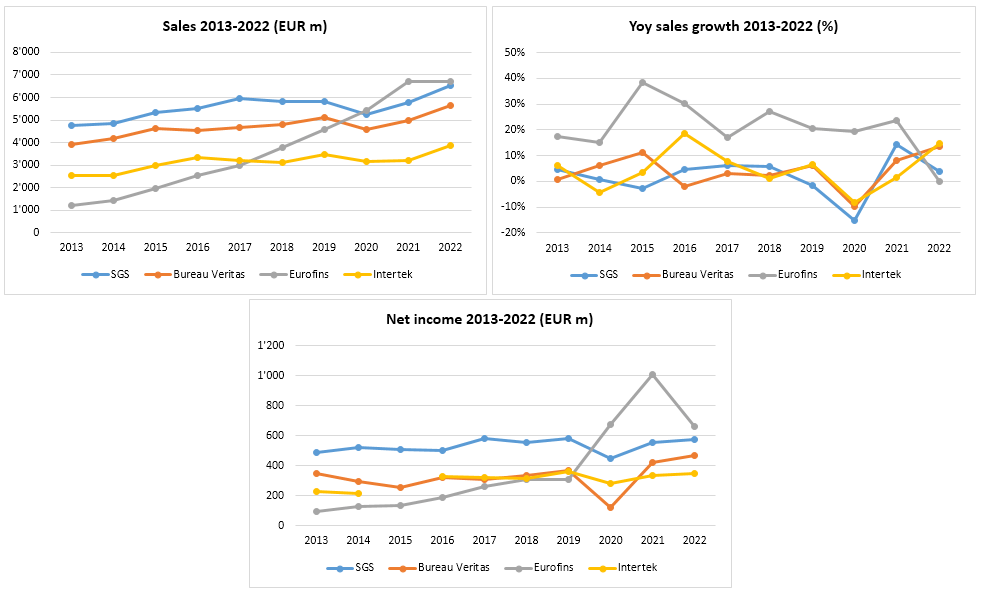
Note: For Intertek, 2015 is excluded due to a large impairment charge related to its oil & gas exposure.
Such an impressive and differentiated financial performance on the part of Eurofins obviously raises a number of questions: does the company pursue a different corporate strategy than its peers? If so, how and why? Does that entail hidden risks, which may negatively impact the company going forward? Will it prove as successful going forward as it has in the past?
As is often the case, a large part of the answer to these questions can be found in the cashflow statements, which details the manner in which these companies have chosen to allocate capital over time.
Comparative analysis of capital allocation decisions
In analyzing the respective capital allocation decisions of the TIC peer group, we're going to stick with the framework we used in our recent article focusing on 3M.
For each of the four main companies in the TIC sector, the tables below display the amount of capital (in local currency) allocated to capital expenditures (Capex), acquisitions, dividends, and stock buybacks.
Please note that we exclude the issuance/repayment of debt from this analysis, as well as changes in working capital, in order to focus on these key items.
The following tables then zoom in on each capital allocation option individually, and express them as a percentage of either sales or cash from operations ((CFO)):
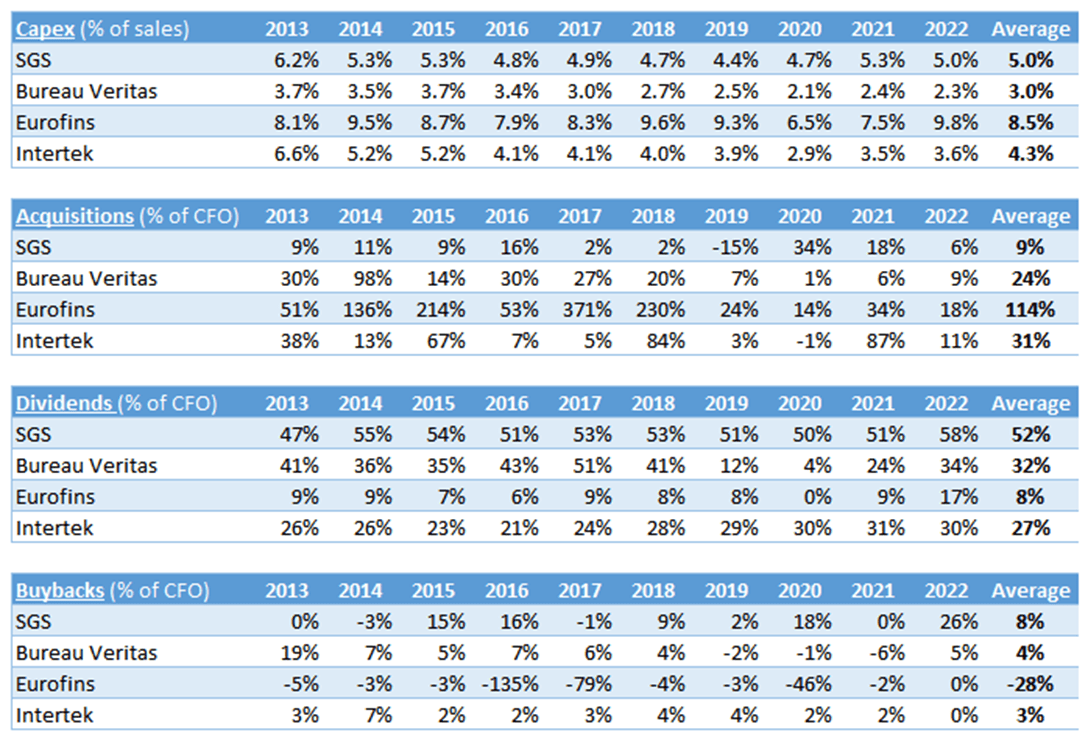
As one can see by looking at the last column in the tables above, there is a massive difference in the manner in which these companies have decided to allocate capital over the past decade (and beyond).
At one end of the spectrum, there is SGS, which has been largely focused on slowly growing its business via organic investments. To do so, the company has invested approximately 30% of capital in capex, or about 5% of sales on average over the past 10 years. But what really differentiates SGS from its peers is its focus on returning capital to shareholders via dividends. Overall, dividends represent more than half of total capital allocations, which is meaningfully higher than all of its peers.
Then, somewhere in the middle, we find Bureau Veritas and Intertek. At first glance, these two companies have elected to balance their capital allocation between growing their business, both organically and via acquisitions, as well as distributing a share of profits via dividends - each representing about a third of total capital allocations.
And finally, at the other end of the spectrum, we see that Eurofins has opted for a fundamentally different corporate strategy altogether. There, the undeniable focus has been on growing the business, both via acquisitions and organically. Acquisitions, on the one hand, have amounted to more than two-thirds of total capital allocations, while capex has represented another 44%. Clearly, in order to invest such large amounts of capital in growing its business, the company has employed both debt and equity financing as necessary. Finally, the dividend clearly represents a much lower priority for Eurofins, when compared to peers.
Different strategies, different outcomes
We've already seen the manner in which these meaningfully different strategies have translated into each firm's financial performance, as assessed by growth in sales and net income this past decade. Let us now turn to another indicator (assuming somewhat efficient capital markets): total shareholder return.
The table below displays the annualized total return of each company's stock since their respective IPO, as well as for various time periods. The two tables below that then break down the total return between price appreciation and dividend income.
Finally, the graph displays the cumulative total return of each company's stock since the last IPO (Bureau Veritas, which went public on October 23, 2007).
Refinitiv Eikon Refinitiv Eikon
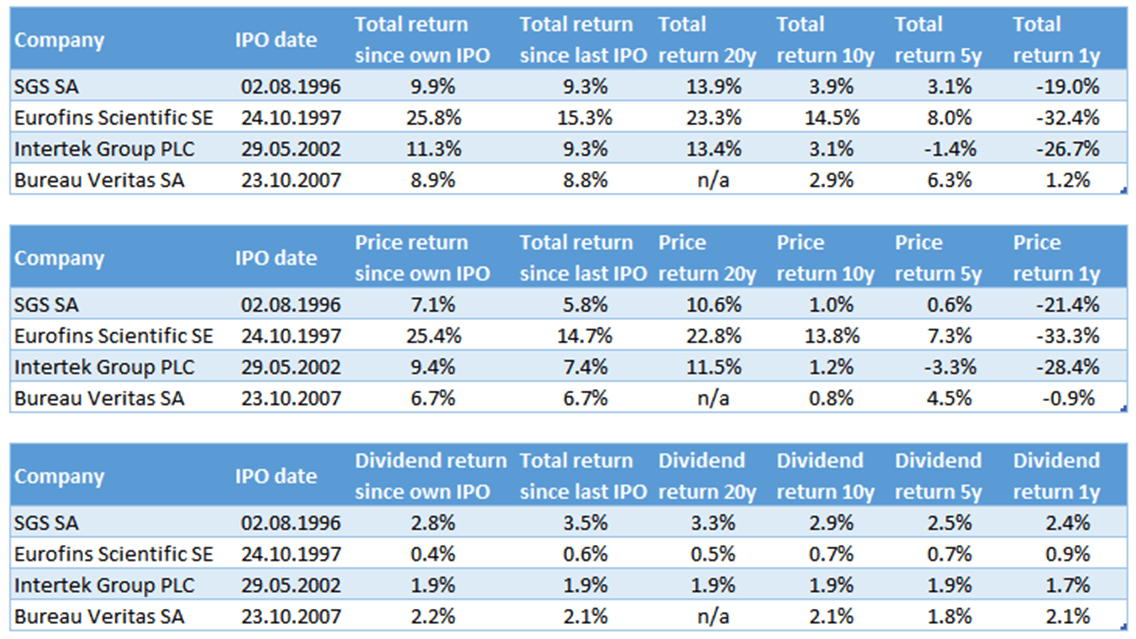
Focusing on long-term returns, which are naturally much more insightful than for shorter time periods, one can see that the entire peer group has performed well, with total returns since IPO in the high-single-digit or low-double-digit for most, with the exception of Eurofins.
Having said that, Eurofins really does stand out of the peer group once again, with returns that are more akin to a technology startup company rather than one operating in the relatively stable TIC market. Over the long-term, the company has delivered an annualized return well in excess of its peers, despite the recent correction in the stock price.
Hidden risks?
Despite the impressive financial and stock price performance of Eurofins, one might ask whether there may be hidden risks that may negatively impact investment returns going forward. For instance, has the company taken on too much debt, or issued shares at depressed valuation levels? Is it growing at a fast rate but at the expense of profitability and return on capital levels? Is the company's stock price currently in a bubble relative to peers?
As previously mentioned, Eurofins has indeed made ample use of debt to finance its growth strategy, but while net debt to EBITDA reached a high of 3.5x in 2018, that ratio is now back down to 1.8x at the end of 2022, only marginally higher than most peers. The largest share issuances that the company made were in 2016, 2017, and 2020, which corresponds to periods when its valuation was relatively high (i.e. 12-months forward PE of above 30x).
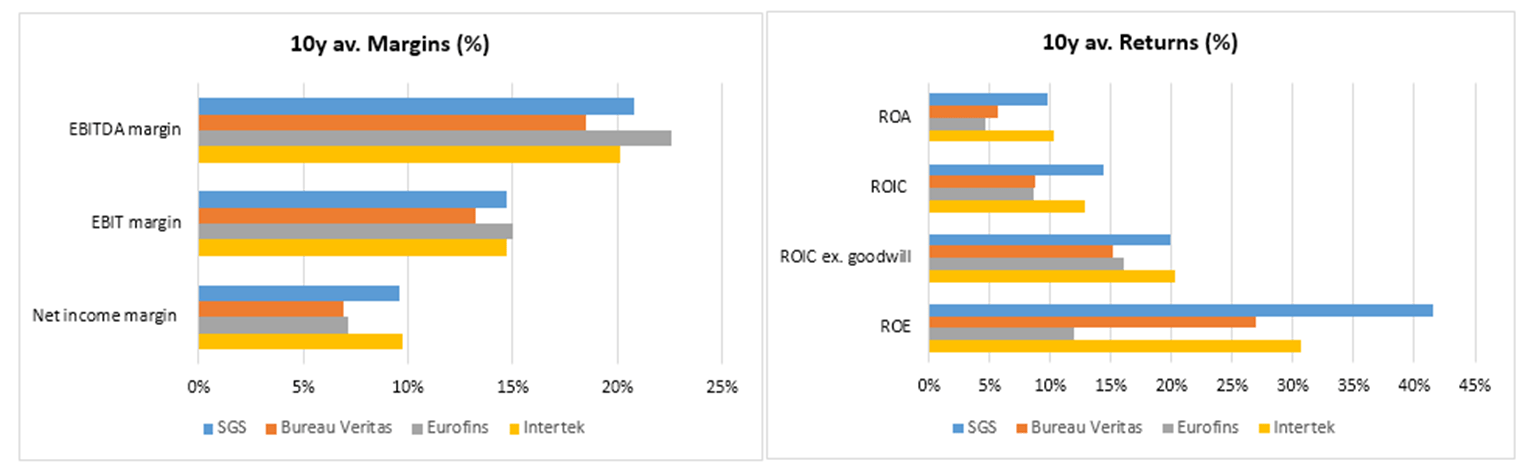
As far as profitability levels are concerned, Eurofins actually has the highest average EBITDA margin of the peer group over the past 10 years, which would indicate that growth is not being pursued at the expense of profits. From there, the amortization of goodwill from acquisitions pressure EBIT margins somewhat, and the higher level of interest payments on debt further reduce the net income margin. Despite this, it is worth noting that overall, the company's profitability levels are not too dissimilar relative to peers.
Looking at return on capital levels, the large amount of goodwill on Eurofin's balance sheet clearly pressures return levels, although excluding said goodwill, ROIC levels of over 15% are perfectly acceptable despite being at the low end of the peer group.
Lastly, is Eurofin's stock perhaps currently in a bubble relative to peers, which at the very least would explain the differential in total shareholder return over time? Looking at the 12-months forward PE multiples, we can see that valuations are both fairly similar for all peers, and also more or less in line with long-term averages:
- Eurofins: 12-months forward PE of 20.2x vs. 20-year average of 25.6x
- SGS: 12-months forward PE of 21.1x vs. 20-year average of 21.6x
- Bureau Veritas: 12-months forward PE of 20.8x vs. 20-year average of 19.4x
- Intertek: 12-months forward PE of 17.3x vs. 20-year average of 19.5x
We can also point out to Morningstar's coverage of the TIC sector, which rates all four companies as having a narrow moat, and some upside potential to fair values: Eurofins (30%), SGS (15%), Bureau Veritas (6%), and Intertek (23%).
Initial conclusion
This article has aimed to provide a brief introduction and overview to the testing, inspection, and certification market, as well as highlight the different strategies that have been pursued by the main four players over time. There is much to like about this particular niche of industrial support services, including relatively stable revenues, a number of structural growth drivers, and an industry structure that is both consolidated at the top and very fragmented at the bottom. In this context, the different strategies of these companies has made a big impact on their financial performance, and thus total shareholder returns. While we are typically quite wary of strategies that focus on fast growth, especially when based predominantly on acquisitions, one cannot help but be impressed with what Eurofins has achieved over the past 36 years. It appears clear that Eurofin's growth strategy is not reckless, as can be the case for so many other companies, but rather based on heavily investing in organic growth, and making a substantial number of small acquisitions every year (typically 50+). In a very fragmented market, this seems to have been a very successful corporate strategy. Having said that, the slightly more conservative approach of Eurofin's peers has also rewarded shareholders adequately over time.
This overview of the TIC sector does not go into further detail about individual companies, including a proper valuation exercise. We may return to the sector and write more articles about individual companies in the near future. In the meantime, we hope you found this introduction to the TIC sector insightful.
For further details see:
Introduction To The Testing, Inspection, And Certification (TIC) Market