IRTC - iRhythm: Implied Expectations Appear Warranted High Risk Priced In At Current Multiples
2023-10-13 14:00:58 ET
Summary
- iRhythm Technologies' investment prospects have dampened in 2023 due to regulatory issues and a lack of economic catalysts.
- The company received a warning letter from the FDA regarding non-conformities to regulations for its Zio AT System back in May.
- The market's response to the FDA's warning letter has been brutal, resulting in a significant decline in expectations and its stock price.
Investment Summary
The investment prospects of iRhythm Technologies, Inc. ( IRTC ) have severely dampened in 2023 following a number of investment updates. Since my February publication , the stock has sold off sharply, on the back of regulatory and economic catalysts. By the way, the February analysis covered IRTC's technicals at the time, and called for a pullback to the $80 mark, precisely where it stands today (see: Exhibit 8, "Downside targets to $79). This report will unpack all that's changed from the February report, and provide thoughtful insights on what the expectations are embedded in IRTC's current market values.
On the point on expectations, the market's view on IRTC was hampered when it received a warning letter from the FDA in May, regarding its Zio AT System, among other factors.
Per the company :
"The warning letter alleges non-conformities to regulations for medical devices, including medical device reporting requirements, relating to the Company’s Zio AT System and medical device quality system requirements."
According to the FDA's warning letter:
The specific violations noted in this letter and in the Inspectional Observations, FDA 483, issued at the close of the inspection may be symptomatic of serious problems in your firm’s [IRTC's] manufacturing and quality management systems.
In fact, the FDA's letter makes a number of startling findings.
For example:
(i). The FDA states IRTC failed to conduct a health hazard evaluation as required under its corrective and preventative ("CAPA") procedure— it "failed to perform an HHE when it became aware of the error titled “Activation Time Mismatch.”
(ii). Failure to establish procedures for receiving and evaluating complaints. Notably, IRTC had completed a retrospective review of 999,328 complaints received from 2019—2022, resulting in a number of medical device reporting ("MDR") violations.
(iii). That IRTC failed to report an MDR where the system malfunctioned, and one instance where a patient passed away while using the system. The FDA says it noted malfunctions in the Zio AT system when it hit its transmission threshold, and stopped submitting data—" This malfunction is likely to cause or contribute to death or serious injury...but no MDR was filed" , it said.
(iv). That IRTC made changes to the device without submitting a new 510(k).
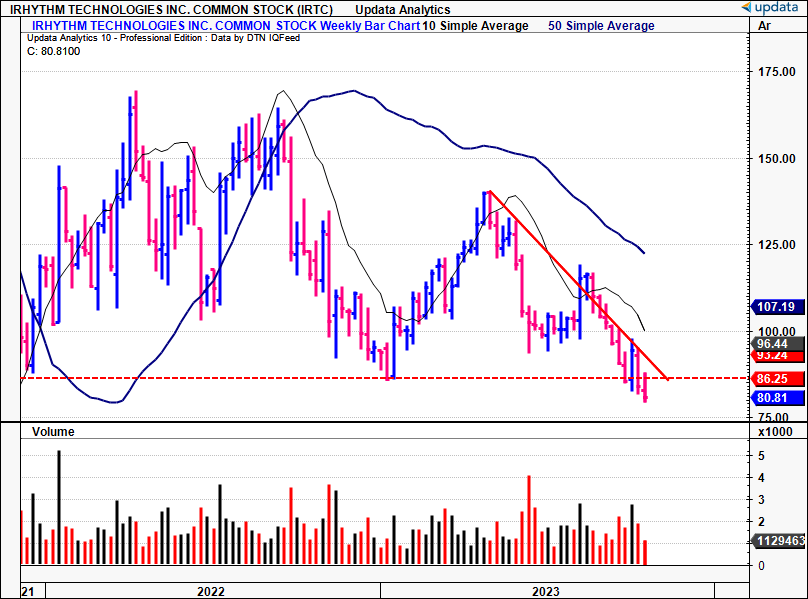
Many more pointers form the basis of the FDA's warning letter. Point being, the market's response was brutal, as seen in Figure 1. IRTC has been in close talks with the FDA to resolve the issue, making a number of label modifications and enhanced design features. Still, one could argue there's been a diffusion of trust for investors.
Net-net, based on the factors raised here today, I continue to rate IRTC a hold.
Figure 1. IRTC breaking to new lows, on ascending selling volume (2-year price evolution, weekly bars).
Investment updates
The most recent developments in the company's growth journey include:
(1). Its latest numbers (Q2 FY'23),
(2). The coming commercial launch of its Zio monitor.
Both factors are relevant to the market's expectations of the company moving forward, not to mention what it means for its operations.
Q2 FY'23 Insights
IRTC put up $124mm in quarterly revenues, a record for the company, and 22% growth on last year. Growth was underscored by home enrollment for its Zio services, with home enrollments ~20% of total volume in Q2. It pulled this to an operating loss of $19mm and loss of $0.61/share. It left the quarter with $164mm in cash + equivalents, down from $335mm in 2020, total burn of $171mm. It's top-line breakdown for H1 FY'23 is noted below.
BIG Insights
As a positive, it continues to drive electronic health record ("EHR") integrations, which is a critical point. It needs these integrations to ensure Zio can be put onto existing workflows for providers, staff and users of the system. EHR integrations were up >60% YoY, so more of the same will be of benefit to the uptake of its new Zio offerings in my opinion.
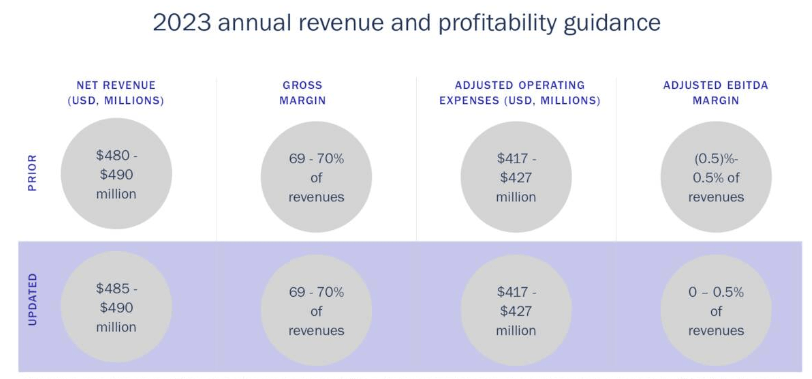
Management reinforced FY'23 guidance of $480-$490mm in sales on gross of ~70% and OpEx of $417–$427mm, but raised its outlook on adj. EBITDA margin to 0–0.5% of revenue (Figure 2a). It also pushed its launch of its next gen Zio mobile cardiac telemetry ("MCT") system out to 2025, around 12-months behind schedule. This is due to regulatory requirements.
Figure 2(a).
Commercial Launch of Zio Monitor
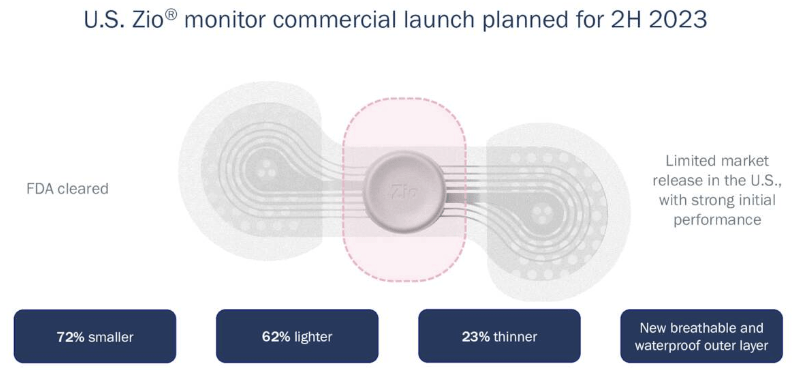
The other factor here is IRTC's upcoming launch of its Zio Monitor. It is eyeing a H2 FY'23 commercial launch, after presenting data at the American College of Cardiology ("ACC") back in March. Readouts from the first 673 patients were made to the ACC, in addition to 12-month data analyzing usage in the device's first 6,000 patients.
According to IRTC, it believes the "thinner, smaller, lighter, more breathable device can improve patient compliance and diagnostic yield as a result of extended wear times" compared to its legacy Zio XT unit.
The company will employ a phased rollout strategy to 1) ensure it transitions away from Zio XT in a managed way, and 2) covers all patient and staff needs.
Consequently, this is a meaningful catalyst to watch out for in the coming months. As to the market's potential reaction, this news isn't new. So it's reasonable to expect the potential launch has been priced in to its current market cap.
Figure 3.
Price implied expectations
It is crucial to understand what's priced into IRTC's market value given the recent price action to the downside. My analysis suggests the following:
- An 18-19% annual growth in sales over the coming 3-5 years,
- A 28.7% required rate of return or investors to be compensated fairly for the level of risk in owning the company.
Sales growth
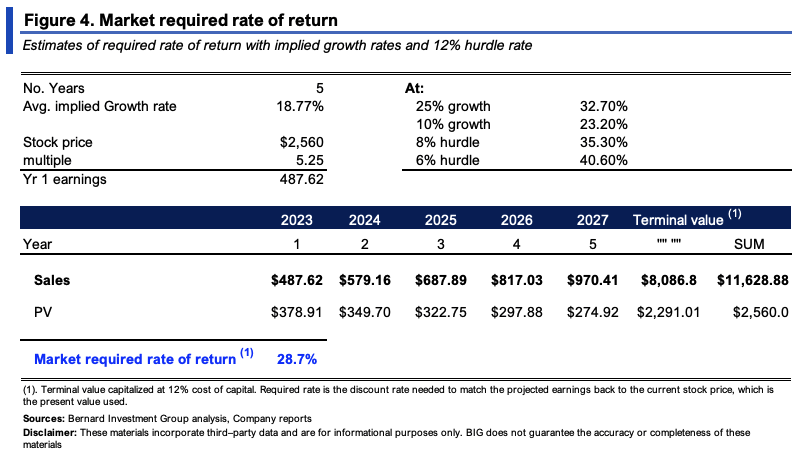
At its $2.56Bn market cap, the company sells at 5.25x sales, implying the market expects $487.6mm in revenues this year (2,560/5.25 = $487.6). This equates to 18.5% YoY growth, and is within management's forecasted range from earlier. You could say the market believes IRTC on its sales forecasts based on this.
Required rate of return
Investors require a minimum rate of return in order to compensate for the level of risk involved in owning a company. Consensus revenue estimates from FY'23—FY'25 call for 18.77% average growth each year, reasonable forecasts. This is reasonable to extend out to FY'28 as well in my view. Afterwards, I've capitalized the firm's sales at a 12% hurdle (our internal threshold return, aligned with long-term market averages). The market's required of return is the discount rate needed to discount these estimates to the current market value as I write, corresponding to 28.7%, ranging from 23%–40.6% based on various stipulations shown in Figure 4.
Key observations from this are:
(i). The market requires a high rate of return which suggests it has priced a high degree of risk in owning the company,
(ii). Investors aren't willing to pay a premium for the 18–19% implied growth.
Confirmation/deviations from implied expectations
The question I want to answer is if there's an opportunity to capture a change in expectations (and therefore outsized returns), and what could stimulate this change.
Two main factors are to be considered here in my opinion, using sound economic principles:
(1). The company's gross productivity and value drivers
(2). Market-generated data
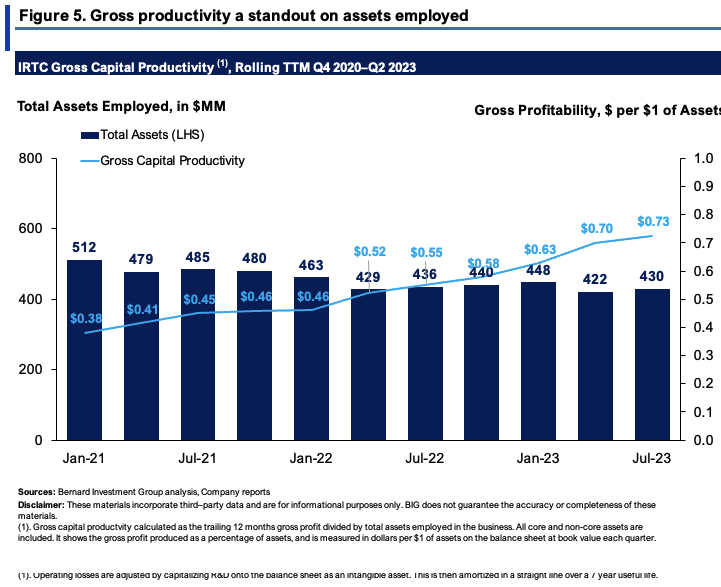
Gross productivity + value drivers
Critically, IRTC is profitable at the gross level, and the c.$430mm of total assets employed in the business are relatively productive. Figure 5 depicts this on a rolling TTM basis. All core and non-core assets are shown. As shown, the company produced $0.73 in gross for every $1 of assets employed last period, up from $0.38 in 2020, on ~$80mm less in gross asset value. For reference, $0.30 is considered high, >$0.7 is considered to be superb. So this is to be considered as an inflection point.
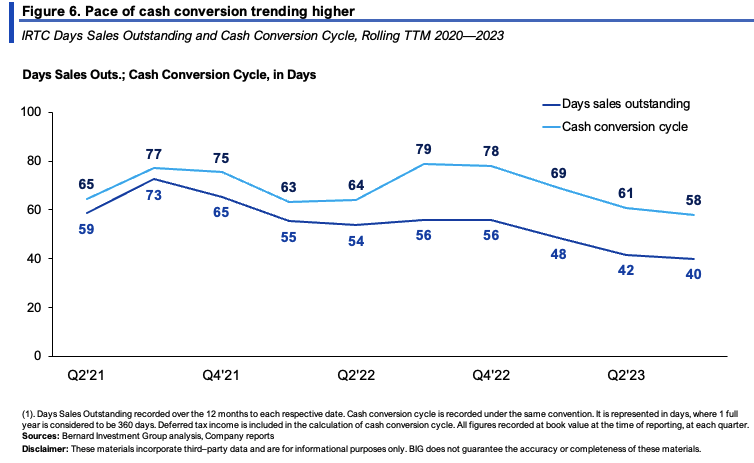
Meanwhile, the pace of cash conversion is picking up, reducing to 58 days from highs of 79 days last year (Figure 6). Each $1 of investment into NWC is therefore recycled back to cash in ~2 months at this rate. It can turn over its NWC ~6.3x per year at this pace as well, which is important given it's inventory and receivables produce its income.
As shown in Figure 7, IRTC's major capital allocations over the last 3 years have been directed to fixed assets and NWC in that order. Each new $1 in sales required $0.15 to fixed capital and $0.04 to NWC. These aren't intensive numbers, also a plus.
Say it 1) continues at this steady-state, and 2) does hit the $490mm in sales this year and ~$580mm in FY'24, this would require:
- $38mm of investment to fixed capital in H2 FY'23, $10.2mm allocation to NWC;
- $13.5mm additional fixed investment in FY'24 plus an additional $3.6mm to NWC.
Without any operating profits forecast, this could burn through an additional $65mm in cash to support the growth. In any scenario, these economics don't corroborate a potential change in expectations in my opinion.
BIG Insights
Market-generated data
Given the firm's lack of profitability, much is gleaned on price visibility from the market-generated data. The cloud charts in Figures 8 and 9 depict this well.
Critically:
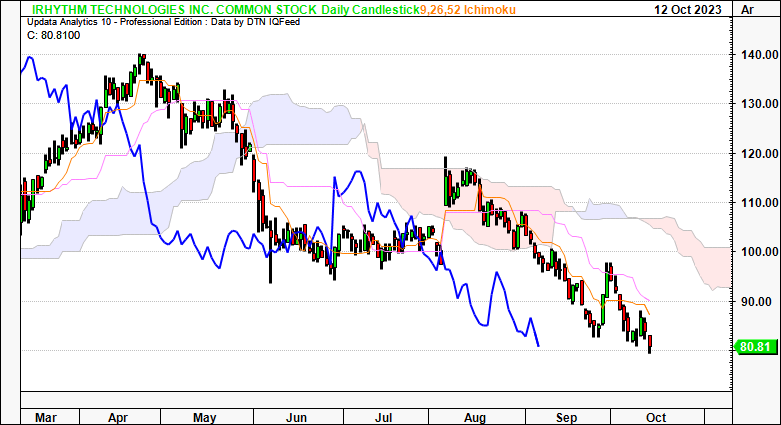
- Daily chart, Figure 8:
- Both price and lagging lines are positioned beneath the cloud.
- The cross in September is well noted and comes after IRTC tested the cloud top in August, being rejected on 3 sessions.
- Break above the $100 mark is needed to corroborate a bullish reversal in my opinion.
Figure 8. Daily chart
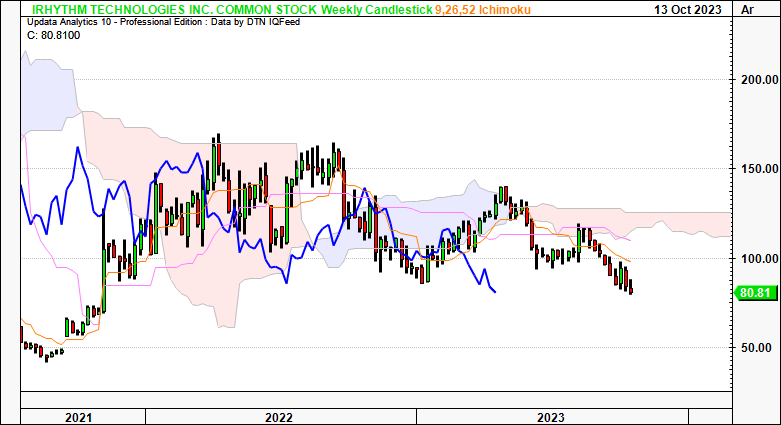
- Weekly chart, Figure 9:
- Again both price and lagging lines beneath the cloud. It did test the cloud base in August, but failed to breach this mark.
- This is further support of a neutral view. You'd need a cross above $120–$125 in order to see a bullish trend forming based on this chart.
- This would need to occur by January next year, so IRTC needs a strong set of catalysts in order to reach this mark in my opinion.
Figure 9. Weekly chart
In addition, as Figure 10 shows IRTC's market profile and price distribution over the last 3 quarters to date. Critically, research shows that markets move from areas of high usage to low usage to complete a full distribution. As you can see below, IRTC's main trading activity has occurred in the low $100s, and there is risk it could push lower in order to 'fill' the distribution to the downside. This also implies the market's pricing to the downside could be justified on a technical basis.
Figure 10.
Data: Updata
Valuation and conclusion
The stock sells at ~5x forward sales as mentioned, and has created $11 in book value for every $1 in net asset value. But keep in mind, the latter figure. may be distorted, as you're buying a declining equity value with the company's ongoing losses.
Moreover, at ~5x forward, this is a 44.5% premium to the sector as I write. Quite the multiple to pay if you ask me—especially given the risk priced into this name. At the 5x multiple, looking to the implied FY'24 estimates of $580mm, this gets you to $2.9Bn in market value, around 17% value gap, and not above the required rate of return priced in by the market outlined earlier. This is a value I am comfortable with looking ahead, nonetheless.
Again market market-generated data is helpful in guiding price visibility downstream. Figure 11 shows the point and figure studies on IRTC on a daily chart, looking to the weeks and months ahead. You can see we have downsides to $57/share certainly not corroborating a bullish view. Should it continue to break lower, this target cannot be ignored in my opinion.
Figure 11.
Data: Updata
In short, the key facts underlining the reiterated IRTC thesis include the following:
- Price implied expectations are low, indicating the market's pessimism in the stock,
- Little evidence exists to suggest these expectations may change, or what could cause said change,
- Market-generated data is unsupportive, in addition to valuations derived from implied expectations.
These factors capture all of the major investment updates since my February publication, what's changed and so on. Consequently, I am reiterating IRTC as a hold.
For further details see:
iRhythm: Implied Expectations Appear Warranted, High Risk Priced In At Current Multiples