IRTC - iRhythm: Recent Snapback Rally Not Validated By Market Generated Data (Technical Analysis)
Summary
- Investors bid up iRhythm Technologies in early January seeing it push to new highs.
- The upside was short-lived, however, and could have been a sucker's rally.
- Market generated data adds substance to this, and objective price studies indicate downside targets to $80.
- The key upside risk is IRTC's earnings at the end of this month, where an upside surprise could spark another upside reversal.
- Net-net, we reiterate IRTC a hold.
Investment Summary
Global equity markets have caught a strong bid so far in FY23 with the Fed's decision to hike another 25bps yesterday received well by the market and adding more market cap to the broad indices. We also noted iRhythm Technologies, Inc. (IRTC) has broken above its long-term resistance levels in January, signalling a potential reversal. With the company heading into earnings later this month, here I'll run through our technical findings on the stock, noting the market expects another flat result from the company. With that in mind, the key upside risk is if IRTC pulls in with an upside surprise versus consensus and company estimates for Q4 and FY22 full-year earnings.
Check out our last 5 publications on IRTC here, in descending order:
- Revenue upsides less visible
- iRhythm remains insulated from peers
- Reimbursement blow equals shareholder downside
- Reimbursement overhand squashed, bull thesis back in tact
- Fairly sized at current multiples, no need to size up
Net-net, advanced trend analysis and market generated data indicate that supply is still heavy and demand isn't sufficient to generate a large reversal. Objectively, we reiterate IRTC a hold.
IRTC - trend analysis lacks evidence of a more constructive positioning
IRTC broke out above its long-term downtrend in January [Exhibit 1]. The snapback rally was short-lived however, and it's congested sideways with tight closes over the last 3 weeks. With the upside leg, it's closed above the 50DMA for this time, but is still well below the 250DMA. Moreover, the weekly volume trend has been on a decline since November last year. We'd note, breakouts often occur when volume has dried up. Hence we have to understand what the rally means for our position within the longer-term downtrend.
Exhibit 1. IRTC breakout above long-term downtrend
Despite the breakout, the daily cloud chart hasn't validated the upside leg and shares have been riding the cloud base to the downside. The daily chart looks out to the coming weeks, and IRTC looks to face resistance at ~$100 by the end of February, with a tight support at $96. Meanwhile, the lagging line is still well below the cloud, meaning we are still agnostic to a further move to the upside. The cloud itself has narrowed in but the price structure is still below the current resistance level of $110. This tells us a breakout above $110 is needed in order for a true reversal.
Exhibit 2. IRTC riding the cloud base to the downside, support at ~$96 by end of February
Looking out to the coming months, the setup is remarkably different. Shares continue to ride the cloud base sideways after breaking through the cloud in December. It's tested the cloud based again but failed. With that, we'd recommend to trade the downside targets after the cloud cross mentioned.
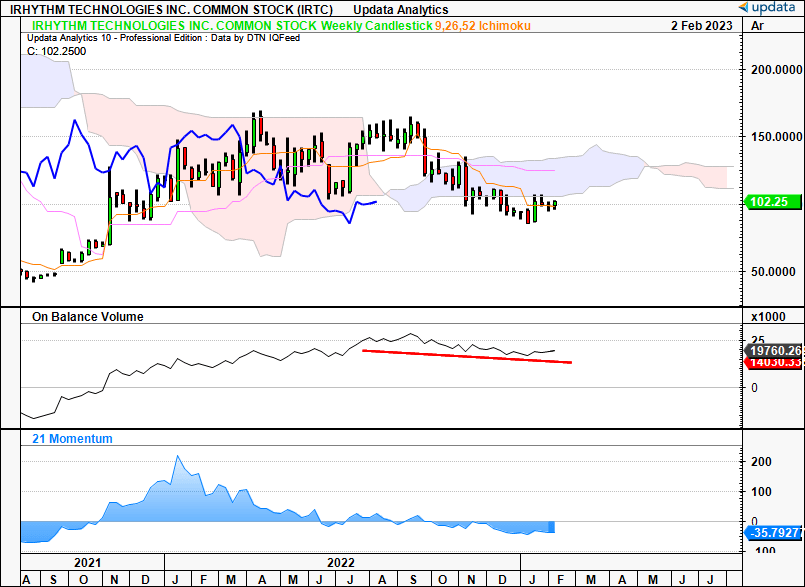
Long-term demand, evidenced by the on-balance volume trendline, has levelled off since November. Moreover, the lagging line is still below the cloud, but is at the precipice and a break to the upside is worth taking note of. Nonetheless, the weekly data tells us sufficient demand hasn't yet arrived to generate a reversal.
Exhibit 3. Shares and lagging line below the cloud after breaking to the downside, testing cloud base and failing 2x.
In addition, tracing the fibs down from the December high to the January low, you'll see IRTC has tested 78% of the downside move and failed with a triple-top reversal. After conforming to the marks on the Fibonacci retracement with confluence between 61-50%, shares are gain testing the 61% level. Hence, there's been good confluence in using the fib channels for price structure in the stock.
Should it push higher, the next target is $105, then $111. If it breaks lower, we're looking to $98, $95, then $91.
Exhibit 4. Fibonacci retracement December-January sees IRTC testing 61% mark once again
IRTC market generated data
The question is what evidence do we have for IRTC to break above the marks shown in Exhibit 4. First, with the snapback in January, we believe it was mainly retail inflows behind the price action, evidenced by the divergence between the positive and negative volume indices in Exhibit 5 ("PVI" and "NVI", respectively). We look to the NVI as evidence of large/institutional buyers as a part of an upside move.
Exhibit 5. Divergence between PVI and NVI suggesting largely retail flows behind the reversal
This is supported by the fact that weekly money flows have remained negative for IRTC over the bulk of H2 FY22 to date. As such, our point on demand being insufficient to drive a further rally.
Exhibit 6. Weekly money flows into IRTC biased to the downside, indicating heavy supply over demand
Looking at the market profile following the breakout you'll see that the IRTC share price has spent the bulk of time in the c.$98 zone, at the point of control ("POC") despite the spike to $102 at the time of writing [Exhibit 7]. The bolus of trading activity has occurred at the POC as well. Those new entries above the POC, particularly at the $102 mark, could indicate that long will be stuck with every move to the downside. Meanwhile, any large buyers present have been active below the POC, yet price hasn't offered many value opportunities below these levels.
Exhibit 7. Market profile indicating market's fair value priced at $98
Consequently, we'd need shares to cross back above the cloud [shown in Exhibit 2 and Exhibit 3] and set a new PCO at the current market price in order to trade the upside targets of $143 shown in our point and figure studies. The charts are set at a 1x3 box reversal, and thus, give bias to the prevailing trend, removing short-term volatility/noise. What's more probable, in our opinion, is a pullback towards the $80 region, the latest downside target thrown off on the study [Exhibit 8].
Exhibit 8. Downside targets to $79
Data: Updata
Moreover, longer-term point and figure studies on a weekly timeframe have generated price targets of $48, then $27. Again, we have a 1x3 box reversal in situ, providing a cleaner view of where the price action is heading. This supports avoiding entering IRTC long at this stage.
Exhibit 9. Long-term downside targets to $48, $27
Data: Updata
In short
Despite an attempted breakout IRTC continues to face challenges in extending the January rally. Advanced trend analysis and market generated data indicate there's still heavy supply and that demand hasn't arrived yet. We have downside targets to ~$80 in the medium-term. The key upside risk is IRTC's earnings later this month. Should it surprise versus consensus estimates, there's a chance investors will rally the stock higher to the marks discussed in this report. Hence, without a directional view on the market, we advocate IRTC is a hold.
For further details see:
iRhythm: Recent Snapback Rally Not Validated By Market Generated Data (Technical Analysis)