IEMG - iShares Frontier and Select EM ETF: Hardly Perfect But Don't Write It Off
2024-01-10 06:45:43 ET
Summary
- The iShares Frontier and Select EM ETF offers coverage to frontier market stocks and some exposure to emerging markets.
- FM has outperformed the popular iShares Core MSCI Emerging Markets ETF since its debut in 2012 but there are question marks over its ability to adequately juggle risk.
- There are promising signs in some of FM's top regional exposures such as Vietnam and Romania whilst the ETF's overall valuations are dirt cheap.
- The long-term chart of FM suggests fair reward to risk at current price levels.
ETF Profile And Relative Performance
The iShares Frontier and Select EM ETF ( FM ) is a $500m sized product that offers coverage mainly to frontier market stocks or pre-emerging market stocks. Note that this portfolio which covers close to 180 stocks doesn’t only focus on frontier stocks, but also offers some exposure to emerging markets, but even its EM exposure comes from those markets where the relative gross national income per capita, and the relative stock market capitalizations are towards the lower end of the broad EM spectrum.
All in all, FM covers stocks from the following countries- Bahrain, Bangladesh, Colombia, Egypt, Estonia, Jordan, Kazakhstan, Kenya, Lithuania, Morocco, Nigeria, Oman, Pakistan, Peru, the Philippines, Romania, Sri Lanka and Vietnam. A fair few may consider some of these markets to be budding, illiquid markets with high idiosyncratic risks, and getting access to that terrain is no mean feat.
Thus, it is little wonder that FM’s expense ratio is hardly cheap at 0.79%; contrast that with the most popular EM ETF (by AUM) around- the iShares Core MSCI Emerging Markets ETF ( IEMG ), whose expense ratio stands at only 0.09%. IEMG also comes across as a lot more stable, with a relatively reasonable annual turnover rate of 21% , which is below the ETF median of 30%. On the other hand, well over half of FM’s portfolio (53% last year) gets turned over every other year.
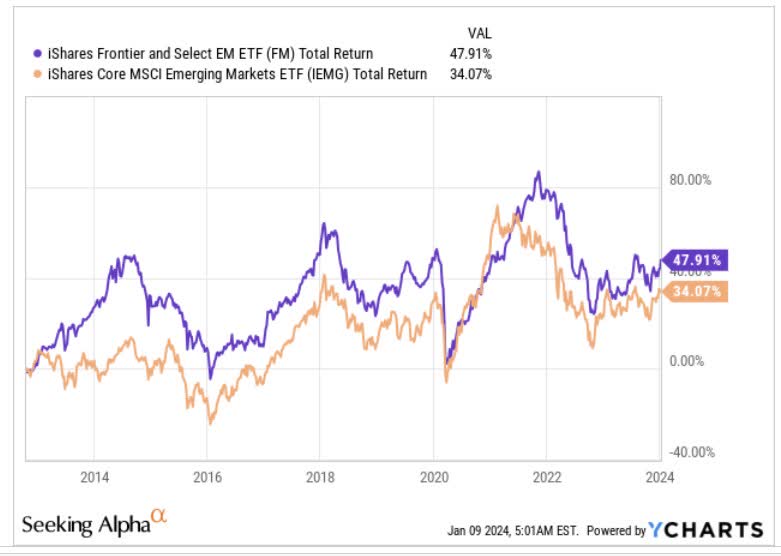
Interestingly enough, note that the listing debuts of both FM and IEMG were in 2012, hardly a month apart, and since then, the low-profile option has actually outperformed the popular option by 1.4x.
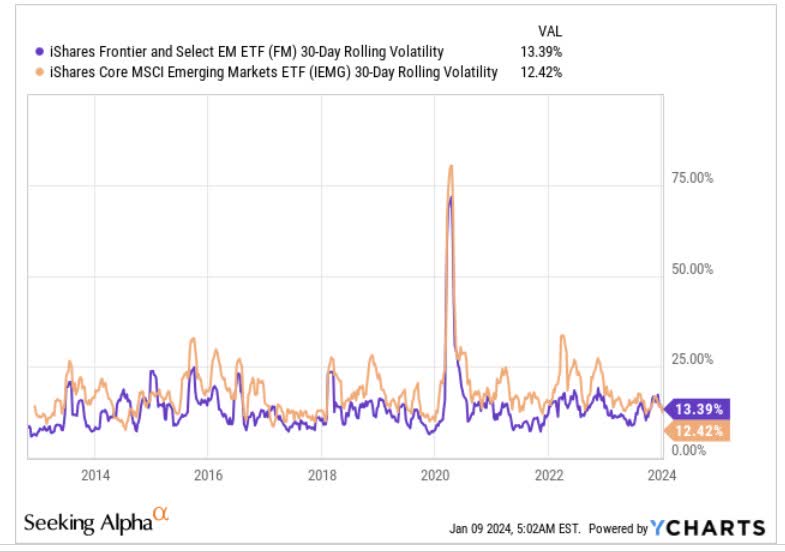
However, given the focus on riskier terrains, it is no surprise to discover that FM has the more pronounced volatility profile of the two.
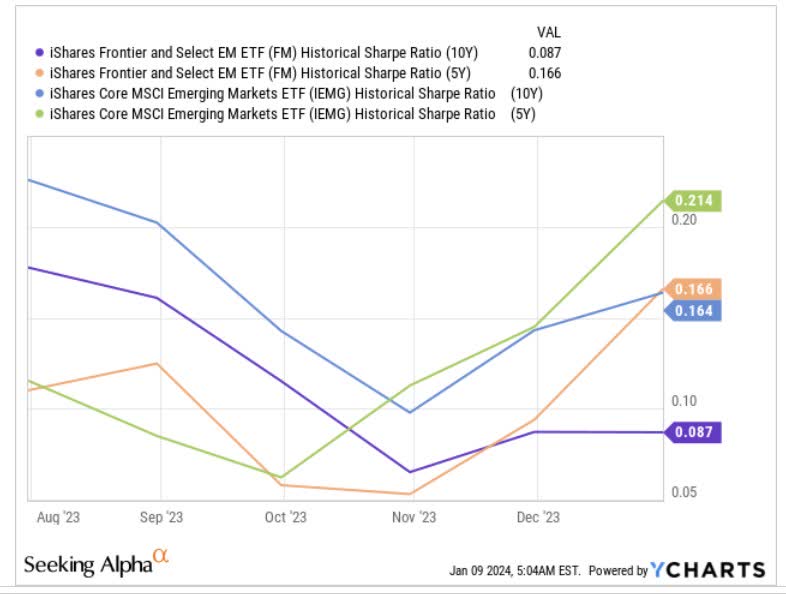
Whilst FM may have beaten IEMG on an absolute return basis, questions can be asked on its ability to generate suitable returns when the risk element is also brought into consideration. To ascertain that, we've looked at the short and long-term Sharpe ratios which measure the degree of excess returns generated for every unit of total risk taken. Note that FM has come up short here, regardless of the period in question.
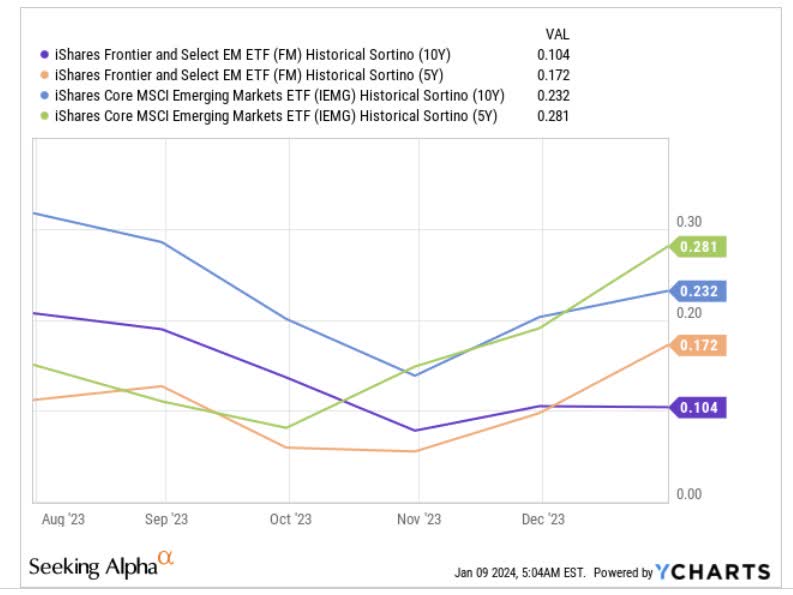
Given that upside deviations are largely favorable, some of you may only be interested to know how these products have fared when coping with downside deviations. For that, we've considered the respective Sortino ratios, and even here one can see that FM isn’t fit to lace IEMG’s boots.
A Few Reasons Why FM Should Not Be Dismissed
As implied in the previous section, FM doesn’t have a particularly great track record of juggling risk, but if you’re willing to dismiss the history, there are still quite a few tailwinds to get behind.
Firstly, the top regional exposures of this product should be welcomed. The dominant region here is Vietnam, whose stocks account for 27% of the total portfolio. After a difficult start to last year, we’ve seen useful progress through the year as growth has only continued to pick up with a strong finish in Q4 (Q2 GDP- 4.25%, Q3 GDP- 5.47%, and Q4 GDP- 6.72%). Basically, the FY23 growth rate came in a 5.05%, higher than the consensus figure of 4.7%. Next year, the economy is expected to kick on even further, with the ADB suggesting that growth could come in at 6% levels.
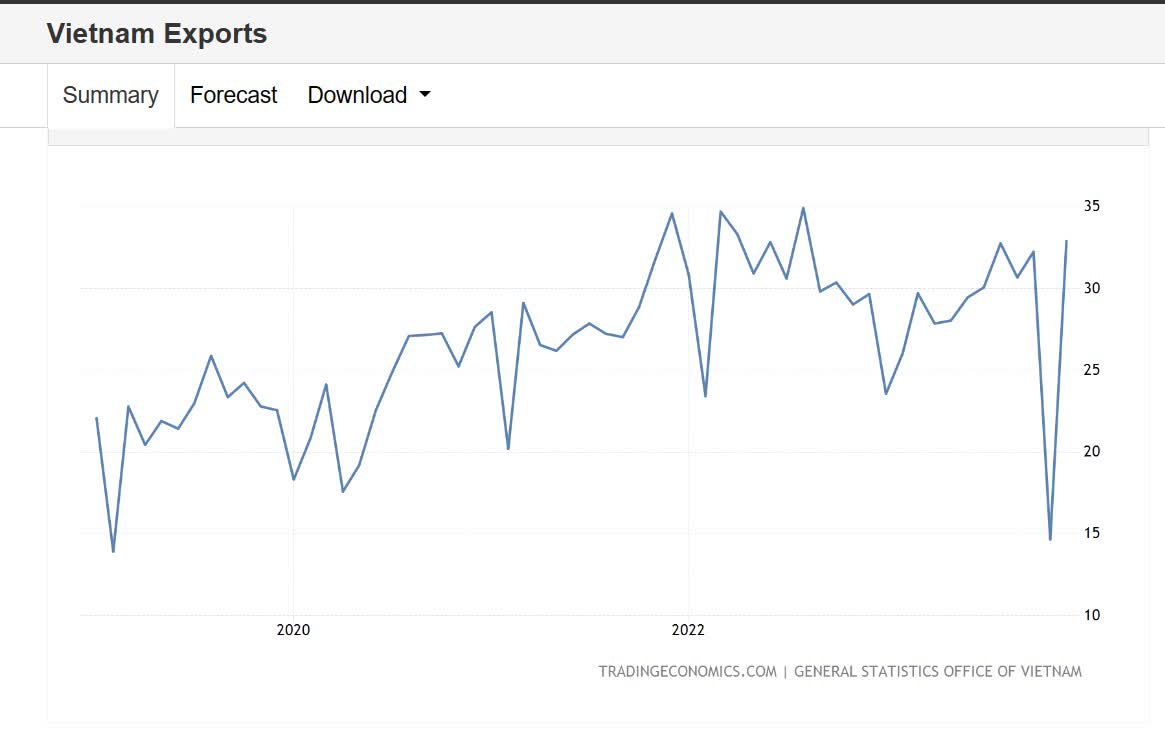
One of the main drivers of Vietnamese growth next year could be exports which account for 94% of total GDP. After an aberration in Nov, Dec exports surged to their highest level in well over a year at almost $33bn.
Besides the weak base effect, a more palatable interest rate environment could also filter through toward healthier trade dynamics from developed economies. It’s also heartening to note that the country has recently also seen an upgrade of its relationship with the US and Japan.
Crucially one of the main reasons for investing in frontier markets such as Vietnam is that these economies offer the potential to transition towards the emerging market bracket and with that comes ample re-rating and higher fund flows (potentially $800m from passive funds alone). Vietnam, it appears, is setting the ball rolling by taking a few steps to boost the Ho Chi Minh Stock Exchange’s status. Steps have been taken to facilitate a potential upgrade from frontier market to second emerging market status by Sep 2025, and if announcements could well be due around or after Q3-24.
After Vietnam, FM’s next biggest regional exposure is towards the Romanian markets, and even here economic conditions appear to be looking up. The Romanian consumer appears to be in fine fettle with YoY retail sales growth hitting 3.3% from the 1.9% level seen in October. With employment at record highs, and real wage growth expected to hit 5-year highs this year, it looks like growth could well hit 3.9% levels, from the 2.3% levels seen in 2023. Stronger domestic demand will likely play a key role in driving better GDP growth of 3.3% relative to the 2% threshold seen last year.
Then, as a product as a whole, FM’s valuations come across as rather cheap, particularly when you consider the long-term earnings growth on offer. As per Morningstar, FM is priced at only less than 8x P/E, yet offers you pretty strong earnings growth of 14%. Contrast that with an IEMG which is priced at a +50% premium (11.92x), but yet only offers less than 11% earnings growth!
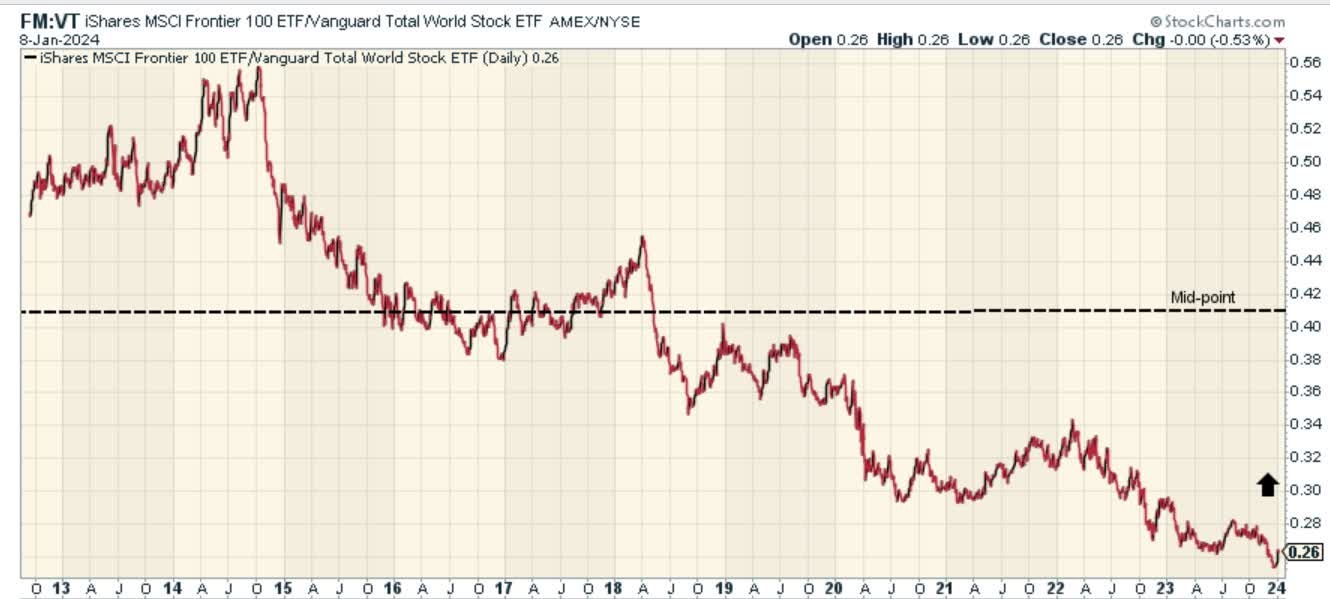
The chart below also highlights how frontier stocks are currently one of the most oversold regions in global markets. The relative strength ratio versus global stocks is not far from record lows, and opens up decent prospects of mean-reversion ahead.
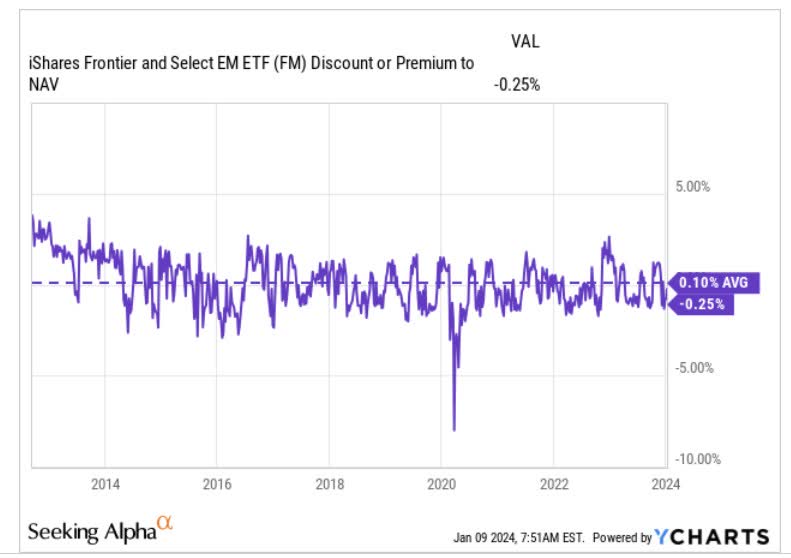
The other thing to note is that this is an ETF that has on average traded at a faint premium of 0.1% over its NAV, but over the last few weeks, an interesting opportunity has opened up as it has been trading at a discount to its NAV (currently at -0.25%).
Closing Thoughts
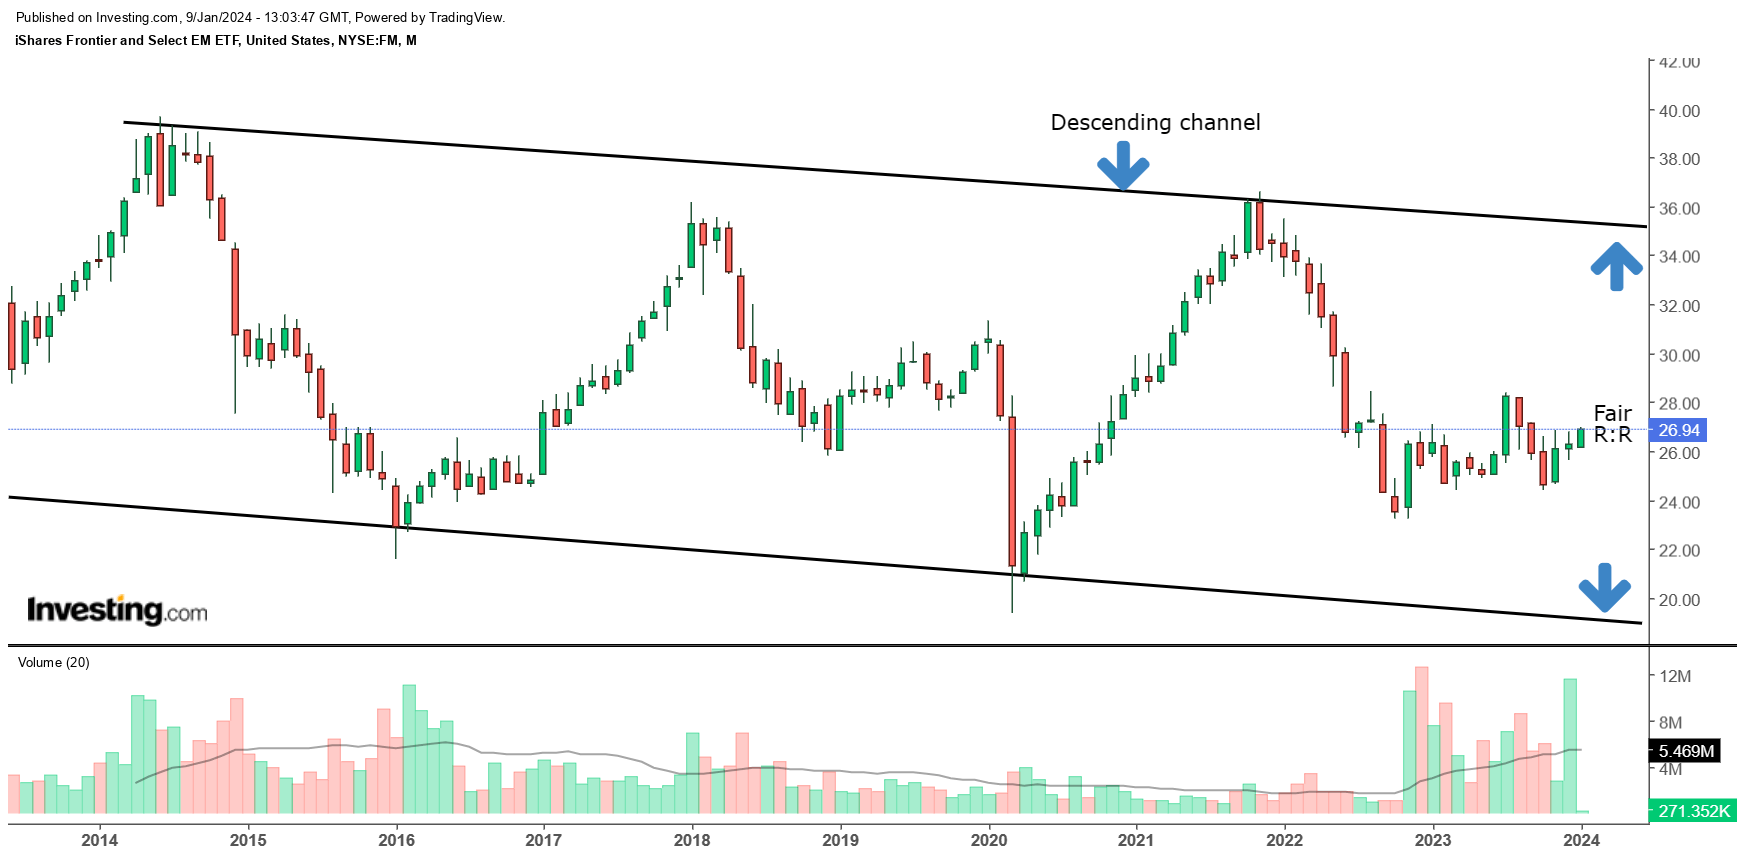
Finally, if we look at FM’s long-term price imprints it appears that this product has moved around in the shape of a descending channel, captured by the two black trend lines. If you're looking to go long, the preferable entry zone would be closer to the lower boundary of this channel. As things stand, we can say that the risk-reward looks fair as the price is currently roughly in the middle of the current channel.
For further details see:
iShares Frontier and Select EM ETF: Hardly Perfect, But Don't Write It Off