EEM - iShares MSCI Emerging Markets ETF: Some Good Some Bad
2023-04-13 12:53:39 ET
Summary
- EEM is heavily exposed to the Asian region, but things look promising here.
- EEM comes across as a sub-optimal EM option relative to its largest peers.
- Forward valuations are cheap, and EEM could benefit from mean-reversion.
Introduction
The iShares MSCI Emerging Markets ETF (EEM) is a financial product that offers investors the opportunity to pursue over 1200 large-and-mid-cap stocks from across 24 emerging market nations. If you're contemplating a position in EEM, here are a few important themes worth noting.
Macros
The IMF came out with its latest economic outlook yesterday and holders of EEM should be relatively enthused with the forecast. I say this because even though EEM is supposed to be a diversified EM vehicle on paper, note that 78% of its holdings come from Asia alone. Now according to the IMF, this is the terrain with the most promising growth prospects in FY23, with expected real GDP growth of 5.3%. This represents almost a 100bps improvement from last year's growth figure of 4.4%, even as global growth in FY23 will slump to 2.8% from 3.4% seen last year.
IMF
EEM is also strongly exposed to China (one-third of the total holdings), and it's fair to say that things are looking up here after a difficult 2022. The Chinese authorities have taken solid monetary easing measures, provided tax relief, and also provided support to facilitate the completion of unfinished real estate projects, which in turn has helped bring a degree of stabilization there. The chart below also highlights how mobility trends have picked up, even as high-frequency indicators such as retail sales and travel trends continue to trend up.
IMF April Report
Meanwhile, the latest Services PMI reading came in at nearly 58 in March, well above expectations, and the highest since November 2020. Crucially, a lot of commentators had been expressing concerns over the external environment and China's ability to foster an improvement in exports which had been on a declining trend for 5 straight months. However, the recent reading for March came in at an impressive figure of 15%, over twice as much as what was expected by a Reuters poll.
Another intriguing facet that may tilt sentiment in favor of EEM is the ongoing weakness of the dollar. The recent US CPI inflation report which came out yesterday rose by only 0.1% m-o-m, below Reuters estimates of 0.2%. Crucially, on a YoY basis, it was the lowest reading since May 2021. More progress on the inflation front should embolden the Fed to pause its rate hike plans. According to the CME Group's Fed Watch Tool , whilst rates look increasingly likely to be raised by 25bps in the May meeting, we could see a cut in rates before the end of the year ( Goldman thinks it could come as soon as June).
A weakening interest rate dynamic should reflect poorly on the dollar index which also does not appear to be benefitting from any near-term technical conditions. Firstly, we have a descending channel that has been in play since October 2022, and despite recent attempts to break past the upper boundary of this channel, it was unsuccessful. Given the gap with the lower boundary of this channel, the risk-reward looks interesting, particularly as the DXY has also just recently broken below the support area of sub$101.5.
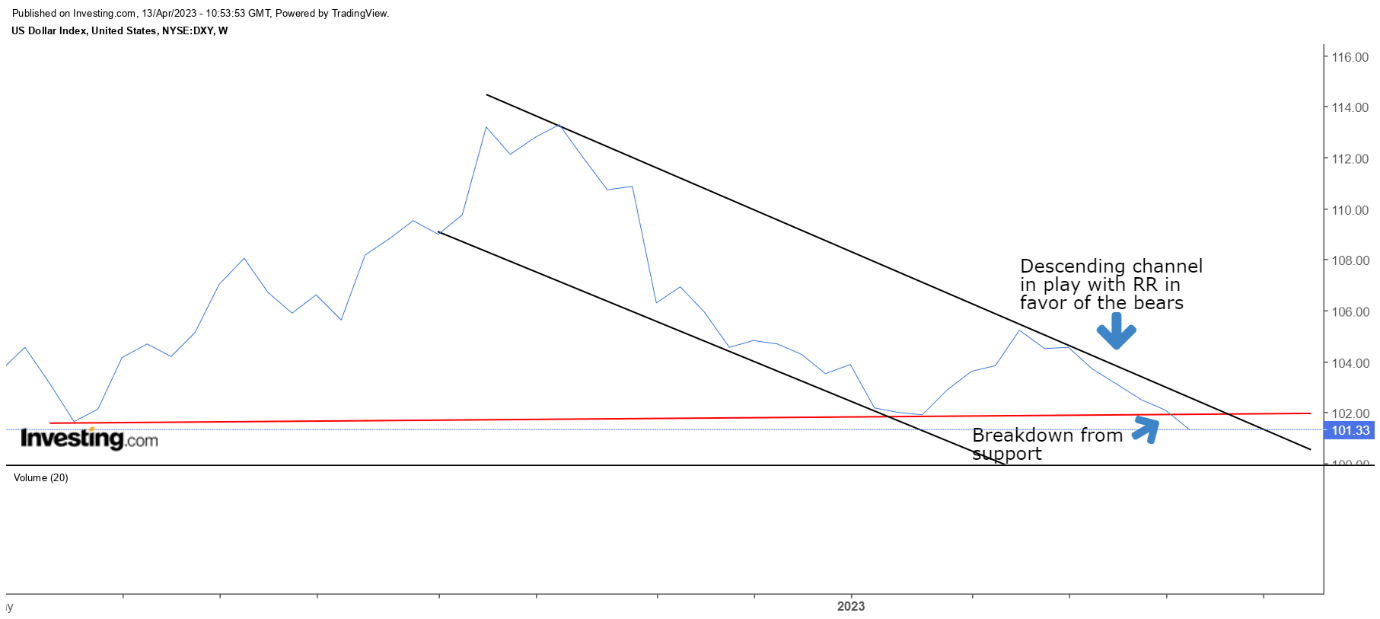
EEM versus its largest peers
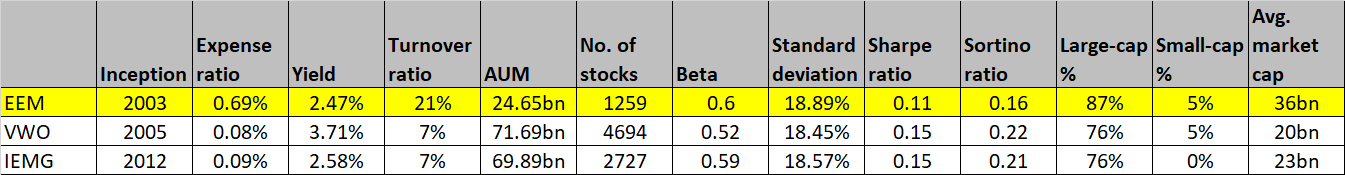
To better understand EEM, I've also looked at its qualities relative to the two largest emerging market ETFs - the Vanguard FTSE Emerging Markets ETF (VWO) which has AUM of ~$72bn, and the iShares Core MSCI Emerging Markets ETF (IEMG) which has AUM of ~$70bn.
Firstly, investors need to note that structurally EEM is quite poorly positioned as a long-term investment vehicle. Its expense ratio of 0.69% is over 7.5-8.5x higher than the corresponding figures of its peers and could likely put off quite a few investors. It is also a portfolio that sees 3x the level of churn witnessed by its peers (see turnover ratio). Then, even from an income perspective, an investment in EEM will currently offer you the lowest yield. In fact something like a VWO offers you a much superior yield of 3.7%.
As far as returns go, we can see that EEM has lagged its peers by over 1000 bps since the inception of IEMG (VWO and EEM were formed much earlier).
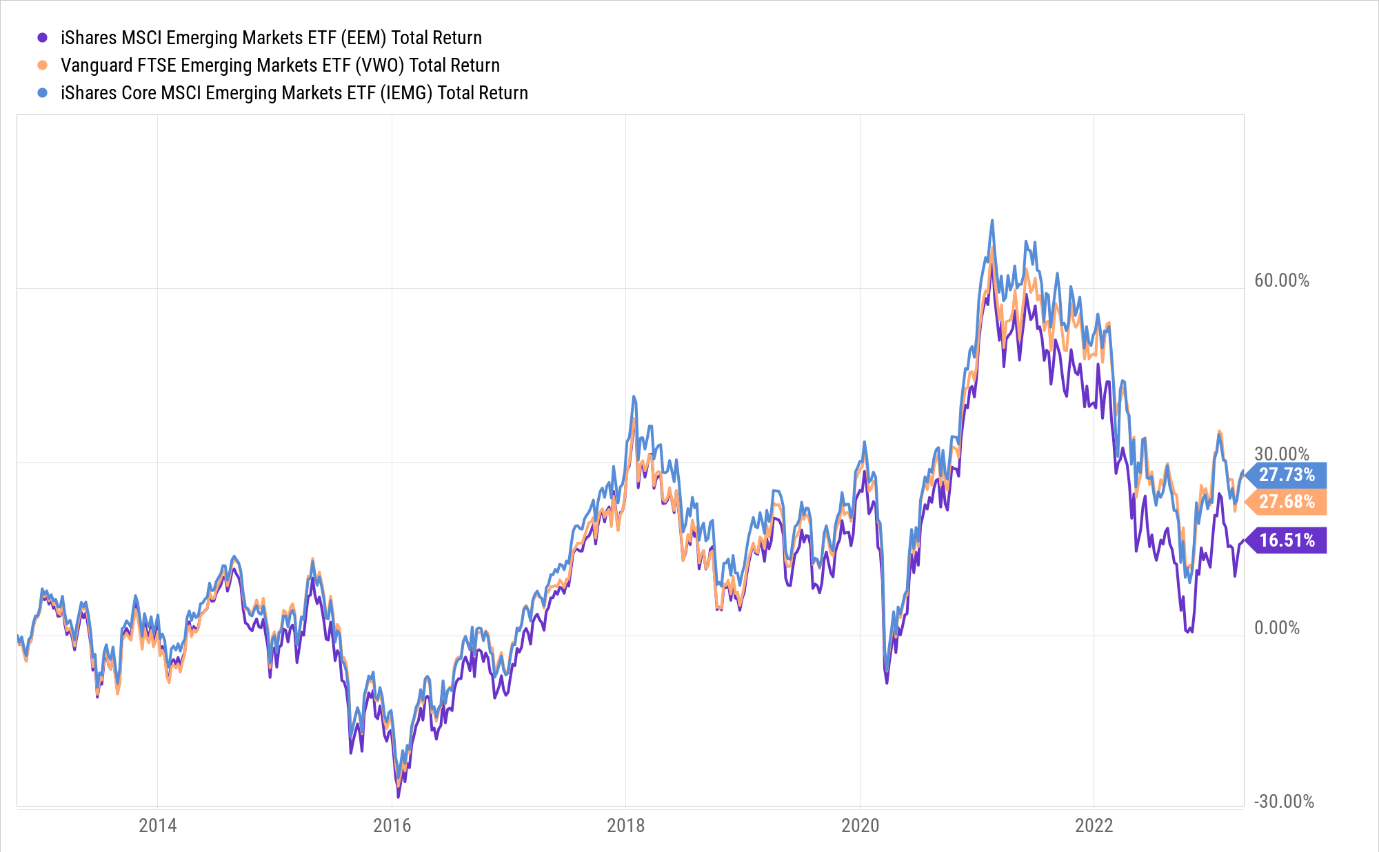
It isn't just the absolute returns, even the overall risk profile, and the capability to digest these risks isn't too encouraging.
Firstly, from a hedging angle, EEM offers the least competence with a beta of 0.6 (relative to the SPY) which is the highest among the three options. Then we can also see that EEM is the most volatile product of the three with the highest standard deviation ((SD)) figure. The relatively high standard deviation figure puts EEM in a difficult spot to deliver excess returns over the risk-free rate. Admittedly whilst none of these ETFs are able to generate a Sharpe ratio over 1x, EEM's is the worst out of the lot. Finally, also consider how poorly EEM fares when it is faced with harmful volatility (the lowest Sortino ratio in the pack).
So why has EEM fared so poorly? Well, I believe there are a couple of things to be noted here. Firstly, it is the more focused ETF out of the three covering only 1200 odd stocks. The number of stocks that IEMG covers is over 2.1x more, whilst VWO is, even more, spread out (3.7x more than EEM). That means the risk for EEM's peers is spread out over a large number of names.
Secondly, EEM is heavily tilted towards large-cap EM stocks with no exposure to small-caps which typically have a better runway of growth and better prospects of P/E expansion. You can also see this being validated by the significant variance in the weighted average market cap of all three options.
In effect, I believe EEM is suffering from a narrower portfolio which also does not get the benefits of small-cap exposure.
Closing thoughts
As implied in the previous section, I don't believe EEM is the most optimal way to play emerging markets but if you still want to persist with this product there are still some good things going for it relative to other terrains across the world. From a valuation angle, EEM is very favorably placed trading at a forward P/E of just 12.2x . When you compare that to the associated multiple of a portfolio of global stocks, as represented by the Vanguard World Stock ETF ( VT ), the discount is quite attractive (~19% ); relative to the S&P500 the discount is even more attractive (~34%) . Crucially also note that EEM's constituents are poised to deliver solid earnings growth of 21% (source: YCharts) whilst VT (~4%), and the S&P500 (~16%) will see much lower earnings growth!
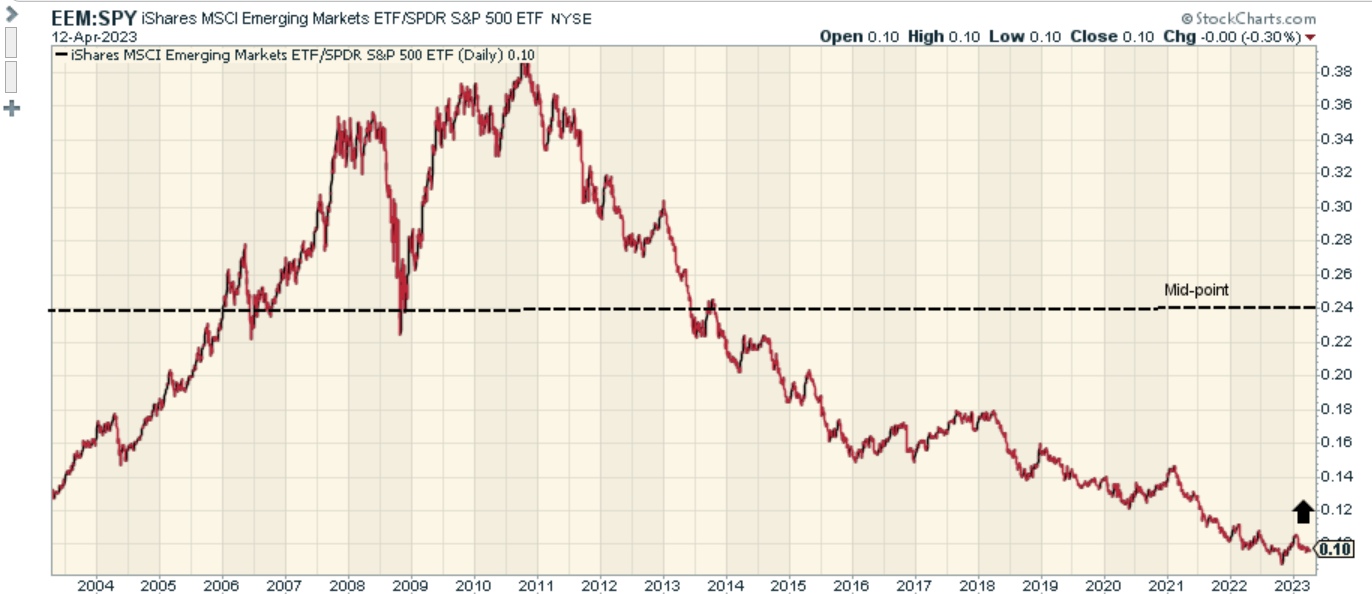
As a rotational theme too EEM could work. The first chart highlights how oversold EEM looks relative to global stocks (~41% away from the mid-point), and the second chart highlights how oversold it looks relative to the S&P500 (~58% away from the mid-point). If you believe in the concept of mean-reversion in the markets, things look promising for EEM.
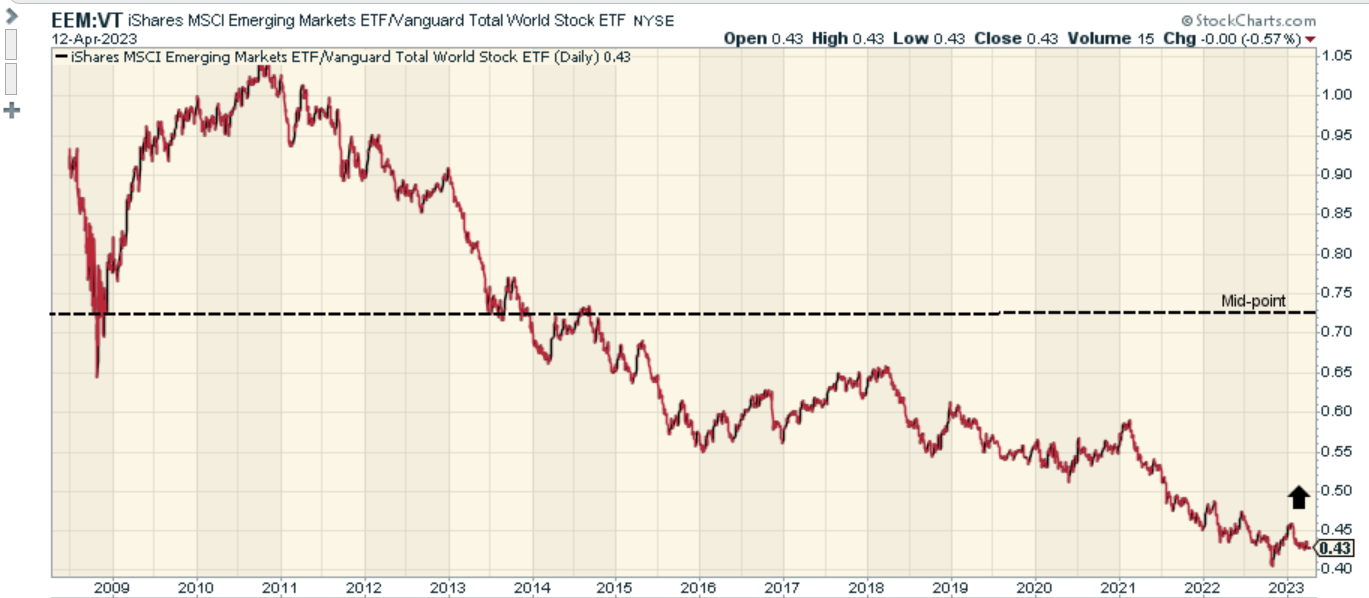
For further details see:
iShares MSCI Emerging Markets ETF: Some Good, Some Bad