EWQ - iShares MSCI Netherlands ETF: The Overall Risk-Reward Does Not Look Appealing
2023-06-08 10:21:15 ET
Summary
- The iShares MSCI Netherlands ETF has done reasonably well since its inception 27 years back.
- The macro picture looks rather underwhelming at this juncture.
- EWN is currently trading at a premium compared to other country-specific ETFs from Europe's top 5 economies, and technically, there is limited incentive to get on board.
Introduction And Track Record
The iShares MSCI Netherlands ETF (EWN) is a long-standing financial product (27-year trading history) that offers investors access to large, mid, and small-cap stocks within the EU's 5th largest economy.
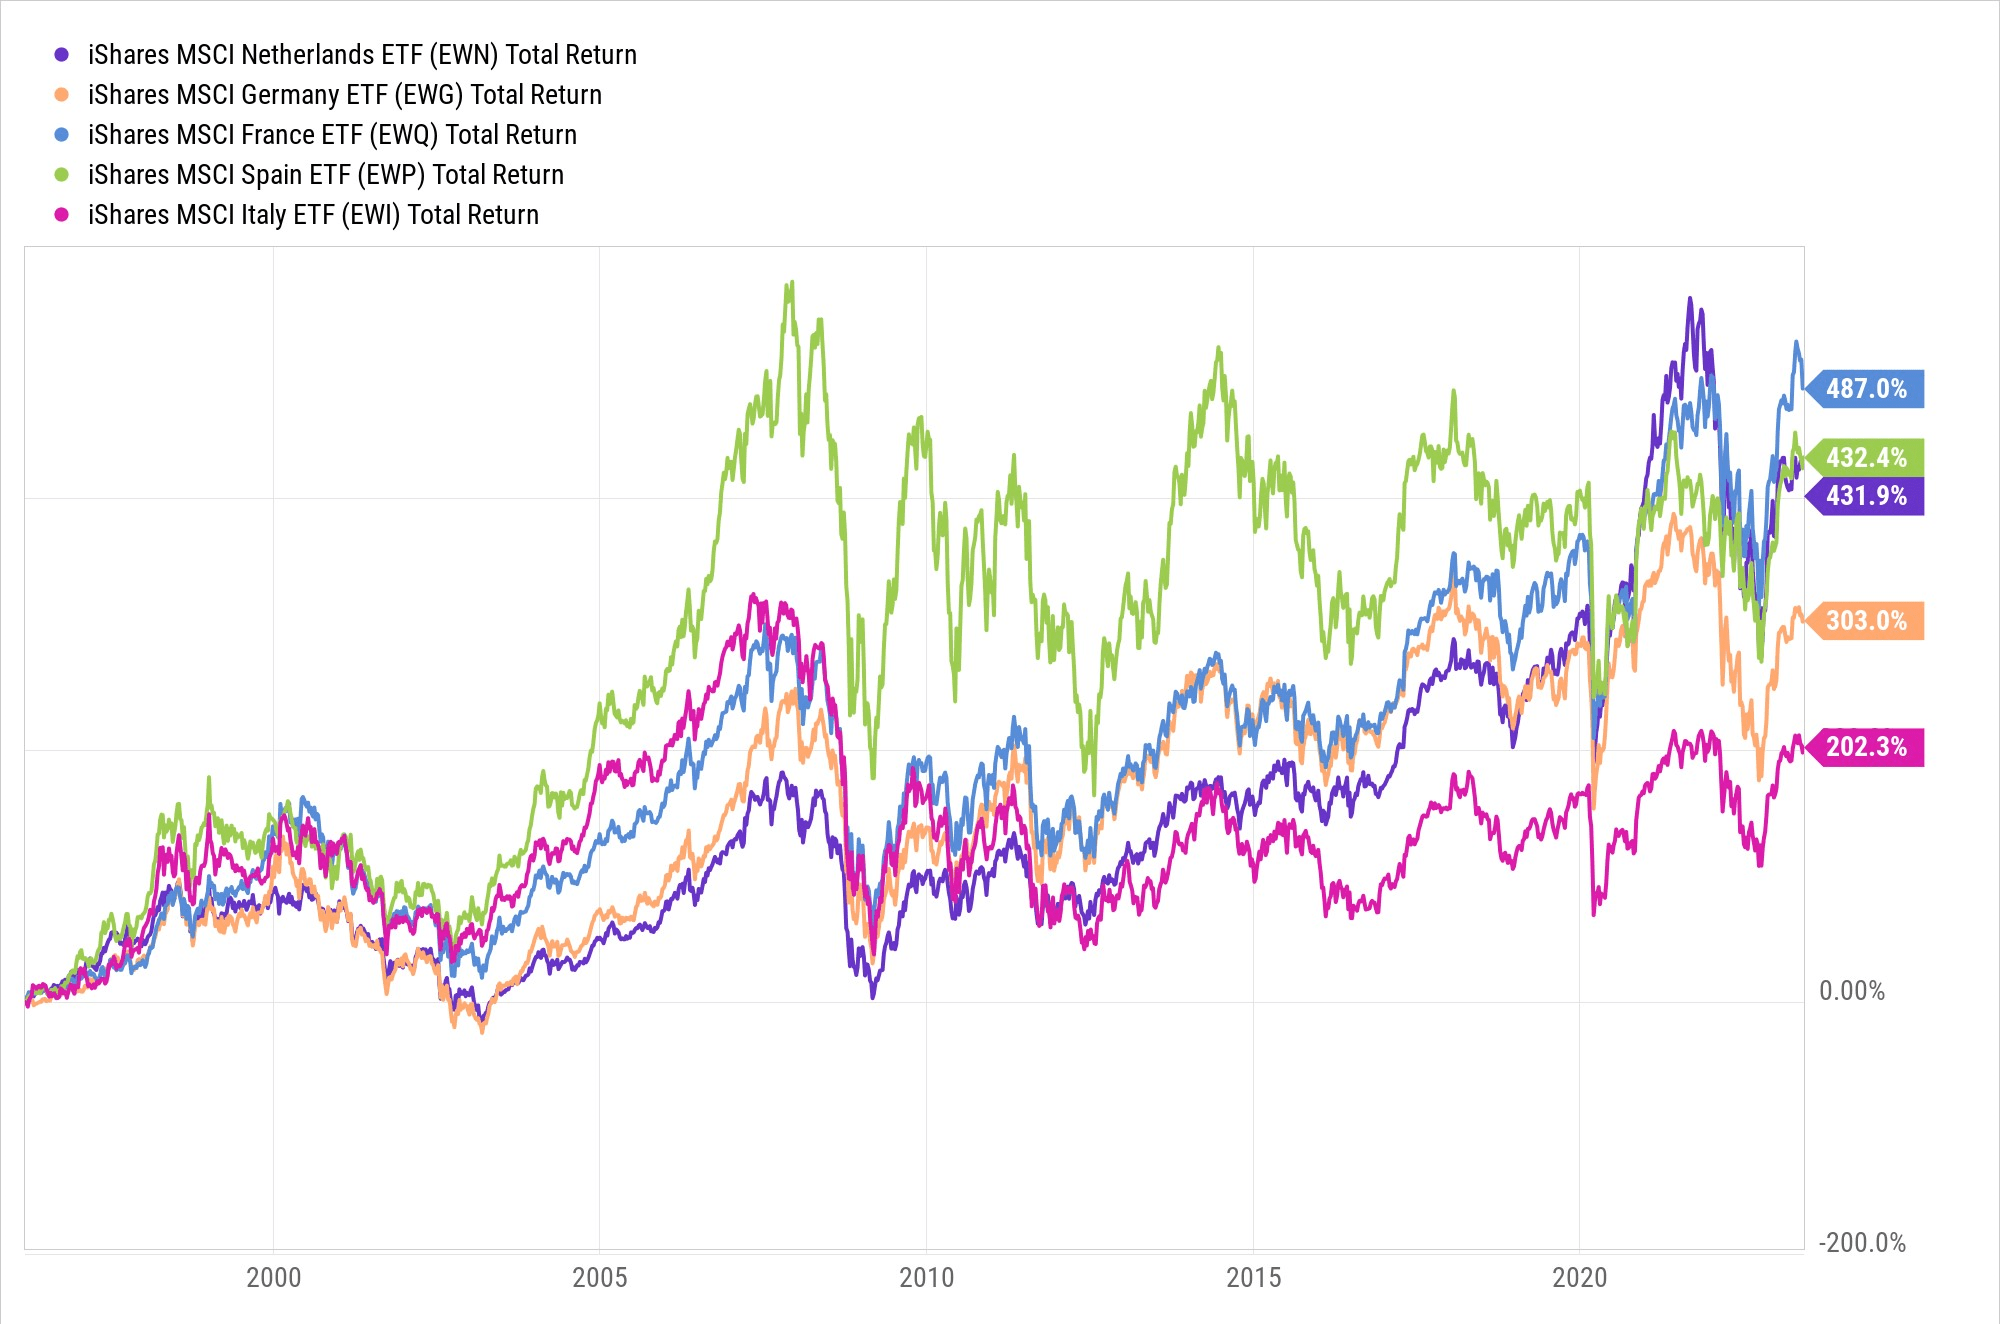
EWN has not fared too badly since its inception in 1996; for instance, if we focus on other country-specific ETFs from the EU's top 5 regions (EWG for German equities, EWQ for French equities, EWP for Spanish equities, EWI for Italian equities), we can see that EWN has delivered sturdy returns that are almost on par with the Spanish alternative ( EWP ), whilst outperforming its Italian ( EWI ), and German ( EWG ) counterparts. Admittedly, as things stand the French alternative ( EWQ ) is leading the pack, but much of this has been driven by this year's performance.
Macro Considerations
Last year, the Netherlands enjoyed its time in the sun, delivering solid enough real GDP growth of 4.5% (for context, the EU had grown at 3.5%), on the back of the 4.9% growth seen in FY21. However, investors would do well not to expect +4% GDP growth for the third year running, as firstly, Q1 has already kicked off on a bad note (GDP contracted by -0.7%) .
Netherlands is one of those economies that tends to benefit from ample external demand (exports account for 83% of GDP), but given weak demand conditions from some of its major trading partners, exports ended up declining by 1.8% in Q1. After growing by 4.7% last year, Dutch exports will likely only grow at 1% in FY23.
Meanwhile, important cogs of the economy, such as the housing market are witnessing drastic reversals in momentum, on account of tighter financing conditions; in April, housing prices dropped by 4.4%, worsening from the 2.3% decline seen in the previous month (the worst is yet to come as DNB expects house prices to drop by 6% over the next two years), whilst the volume of sales slumped by an even greater margin of 20%.
OECD
All in all, the IMF believes that Dutch GDP growth for the whole of FY23 will likely only come in at an underwhelming figure of 1% .
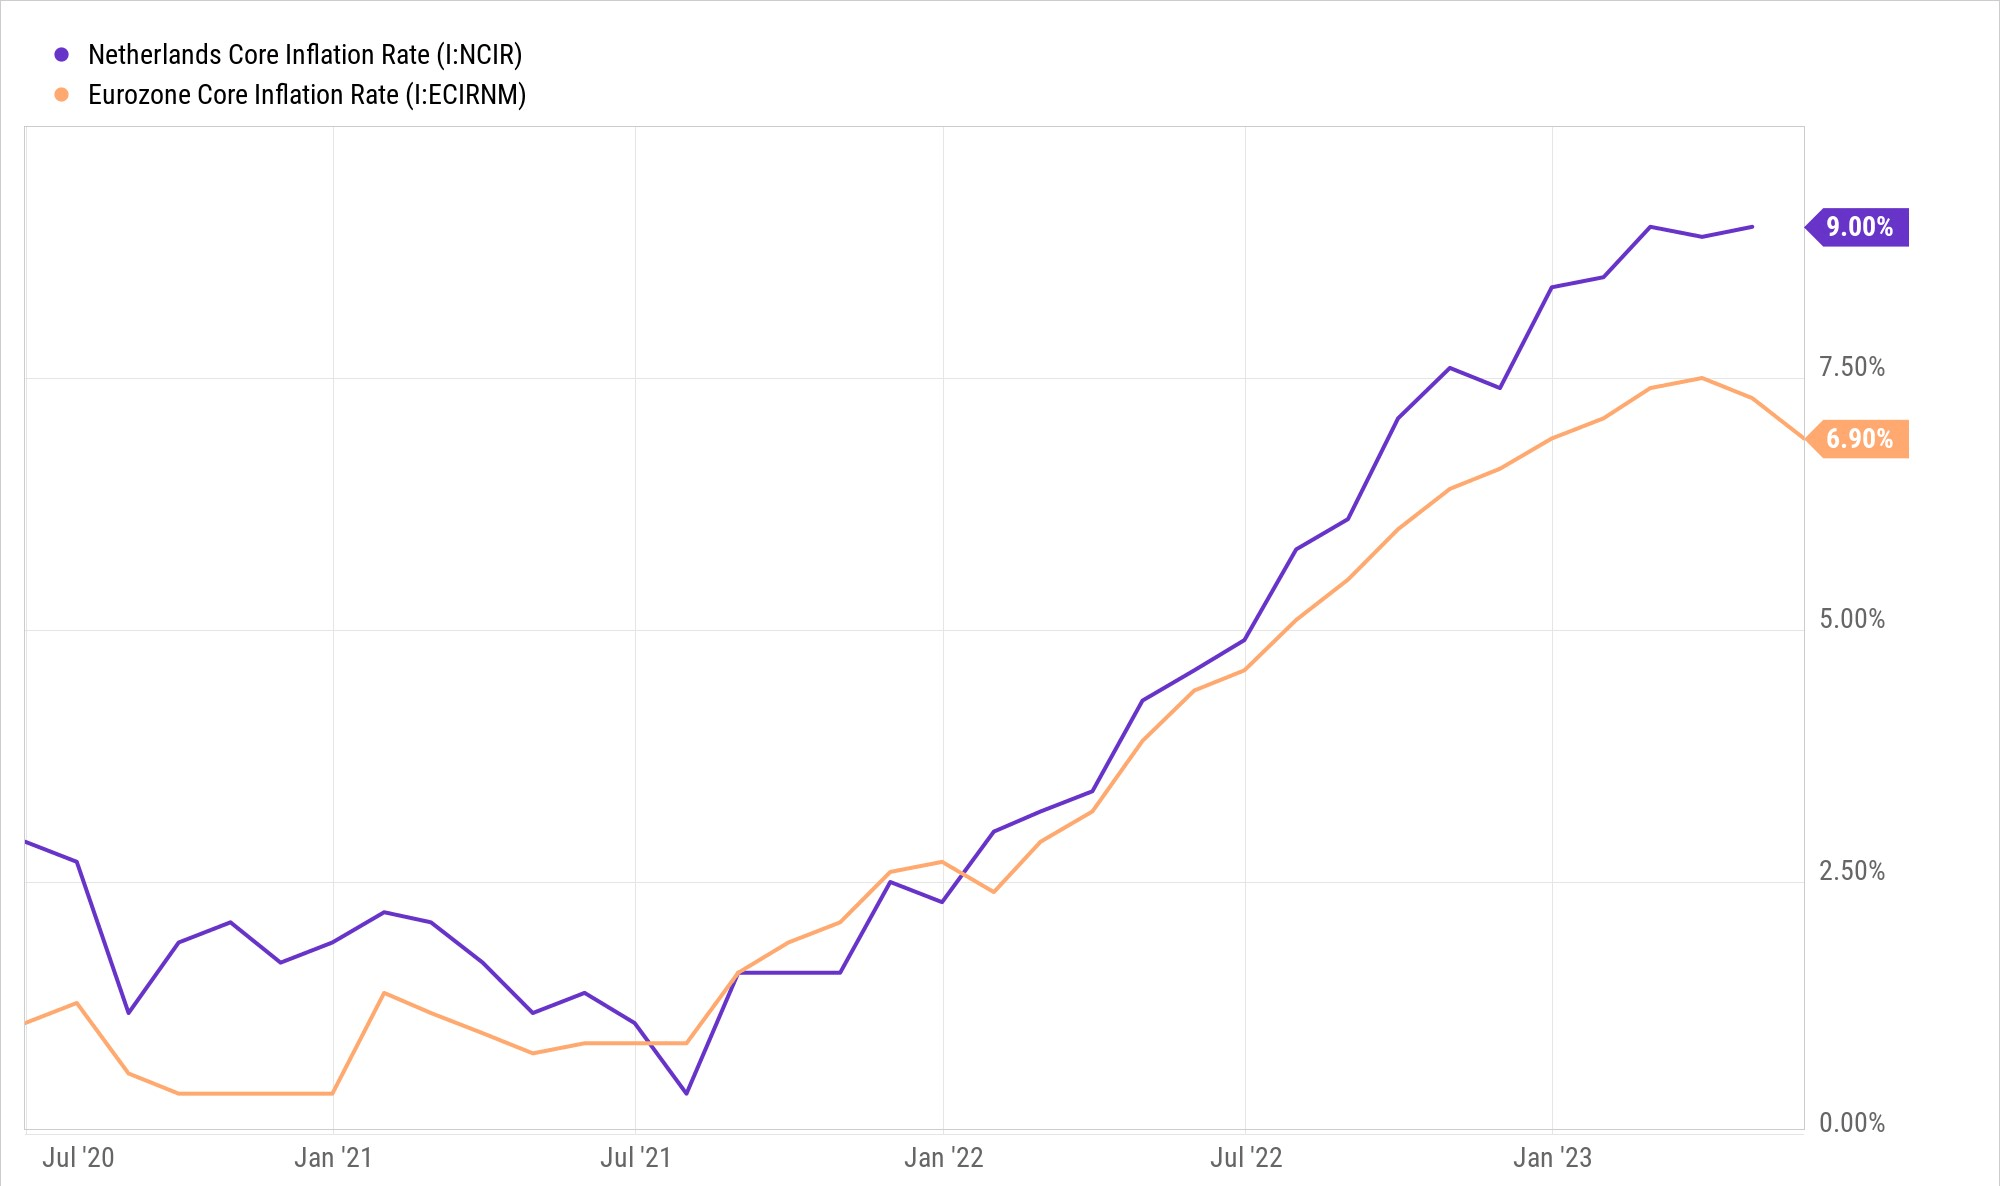
Whilst lower energy prices may be helping headline inflation in the Netherlands to trend lower, we would urge investors should pay greater attention to the dynamics of core inflation which is proving to be stubbornly high and not showing any signs of trending lower (in contrast, core inflation in Europe appears to have pivoted lower)
We believe core inflation could remain obdurate because the Dutch government is in the midst of an expansionary fiscal stance, and has put in place some support measures such as an increase in the energy compensation scheme for households, rising social benefits, lower taxes on labor income, and 10% increase in minimum wages, which will all leave their mark in supporting a general increase in the pricing environment.
In addition to that, the Dutch labor market looks to be increasingly tight, and should bring its own set of pressures. For context, at the end of March, there were close to 450k unfilled vacancies, the same as in December; as things stand, the number of vacancies in the Netherlands is more elevated than the number of unemployed there and conditions such as this should keep wage inflation elevated. We also know that wage inflation typically follows inflation with a lag so the worst is yet to come. The European Commission expects wage growth for the whole of FY23 to be rather hefty at 5.5% .
Closing Thoughts - Technical and Valuation Angles
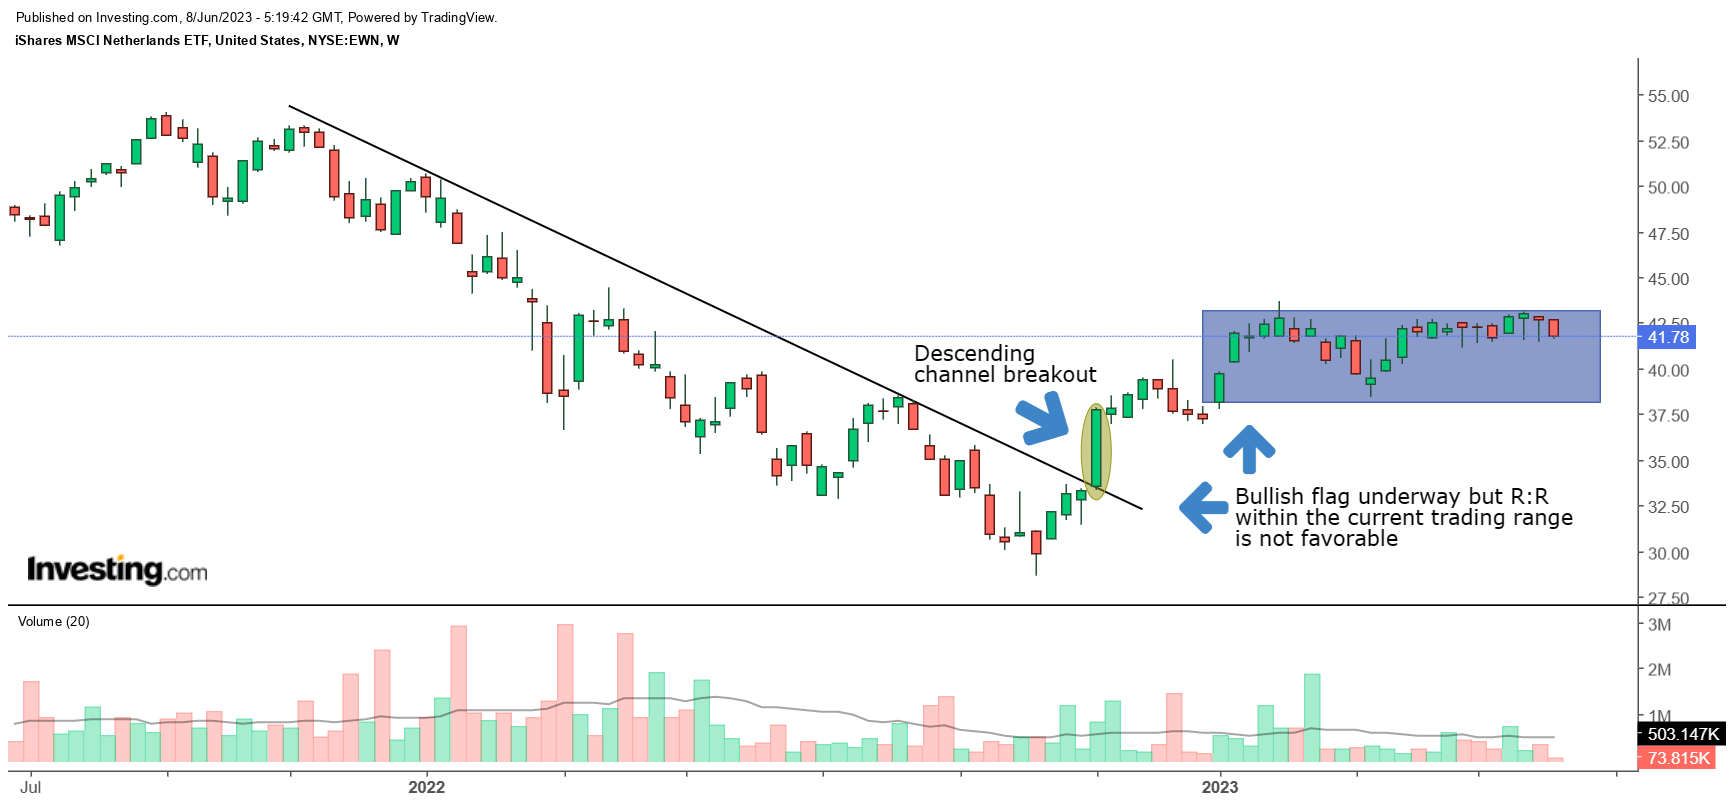
Looking at the price movements of EWN on the weekly chart, we can see that since Nov 2021, it had been on a steep downtrend for roughly one year. After bottoming out in October 2022, we then saw a large full-bodied candle in Nov 2022, breaking out of the descending channel. The stock then continued to trend up but climaxed around the $43-44 level by the end of Jan 2023. Since then, what we've seen in a flattening out of the price action, with the stock maintaining a trading range between the $37-$38 to $43-$44 levels.
EWN may well break out from this range, but we don't think it would be particularly prudent to kickstart a long position when the price is currently close to the upper end of the range. We feel investors would be better served by waiting for a pullback closer to the lower end of the range ($37-$38); at around those levels, the reward-to-risk ratio will be over 1x.
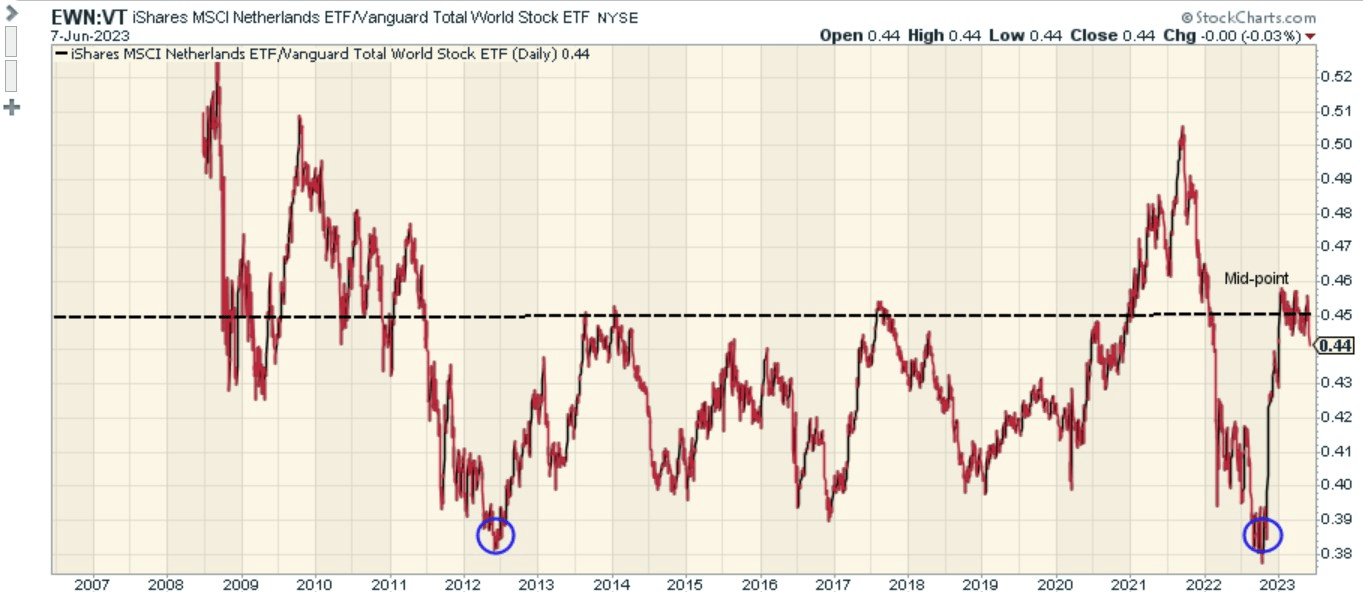
We also don't believe that investors fishing for suitable opportunities around the globe will be too enthused to rotate into Dutch equities at this juncture. The image below highlights how that could have been a suitable trade in late 2022, as EWN's relative strength versus global stocks had dropped to the mid-2012 lows from where it had bounced. That trade no longer burns bright, as the relative strength ratio has now mean-reverted to the mid-point of the long-term range.
Finally, investors should also consider that EWN is not a cheap portfolio to own at this juncture. Relative to the other country-specific ETFs of Europe's top 5 economies, EWN is priced most exorbitantly at a P/E multiple of 16.4x (a 39% premium over the average of the peer set). In addition to that, you also get a sub-par yield of only 1.77% (the lowest amongst this lot), over 100bps worse than the peer set average.
YCharts
For further details see:
iShares MSCI Netherlands ETF: The Overall Risk-Reward Does Not Look Appealing