QVML - It's A Bull Market After All - Expect It To Continue In 2024
2023-12-15 01:07:38 ET
Summary
- I was way off in my 2023 prediction for the S&P 500 but corrected some model errors to improve my prediction for 2024.
- The bear market appears to have ended in October 2022, making it shorter than the long bull markets on which I based my 2023 forecast.
- The Fed looks a little too pessimistic on inflation and GDP growth for 2024. I see a Goldilocks scenario, with the former under 2% and the latter over.
- My S&P prediction for year-end 2024 is 5023, a 6.5% gain from current levels.
Learning From My Mistakes
'Tis the season for 1-year market forecast articles. There will be many published over the next couple weeks predicting where the S&P 500 ( SP500 ) ( SPY ) will be trading at the end of 2024. There probably won't be many such articles that include a review of the author's 2023 prediction. A New York Times study noted that between 2000 and 2020, the median Wall Street forecast since missed its target by an average 12.9 percentage points a year. This same Times article, published in December 2022, noted the average S&P 500 prediction for year-end 2023 was 4009. With two weeks to go as I write this, the S&P is at 4718, nearly 18% higher than the median forecast.
It's easy to see why most forecasters would not want to revisit their predictions, but in my case, I believe in transparency and learning from mistakes. My prediction from last year was slightly more bearish, and therefore slightly more off, than the average. I use a simple earnings discount model where the predicted value of the S&P 500 is E/(r-g), where the variables are defined as follows:
E = S&P 500 as reported earnings per share. Some people use operating earnings. I use as reported to be more conservative. Specifically, I use actual EPS from the trailing three quarters plus the estimates for the current quarter.
r = r(f) + r(p). This is the risk-free rate (current nominal 10-year Treasury note yield) plus the risk premium, for which I use a long-term average of 5%.
g = earnings growth rate. I use an expected GDP growth rate.
Here is the snapshot of the model in last year's article where I predicted 3940 for the S&P.
Author Spreadsheet (Seeking Alpha)
As you can see, I predicted way too low of a 10-year rate. The actual is now around 4%. I also overpredicted the EPS number by about 5%, as the current estimate is $193.82 according to S&P . Both of these errors should have caused me to predict too high a value for the S&P. However, I actually under predicted because I also incorrectly used a real, rather than nominal value for the growth rate. This model has worked well in the past at identifying buying opportunities at market bottoms. At those times, however, inflation expectations are lower, so the real and nominal rates don't differ as much. If I correct this flaw in the model input, we see that it predicts a current value of 4425 for the S&P once I also update it with the latest 10-year rate and earnings estimate, a more respectable 6.2% difference from the current level. (You could also easily match the current level exactly by reducing the risk premium slightly to 4.72%.)
Author Spreadsheet
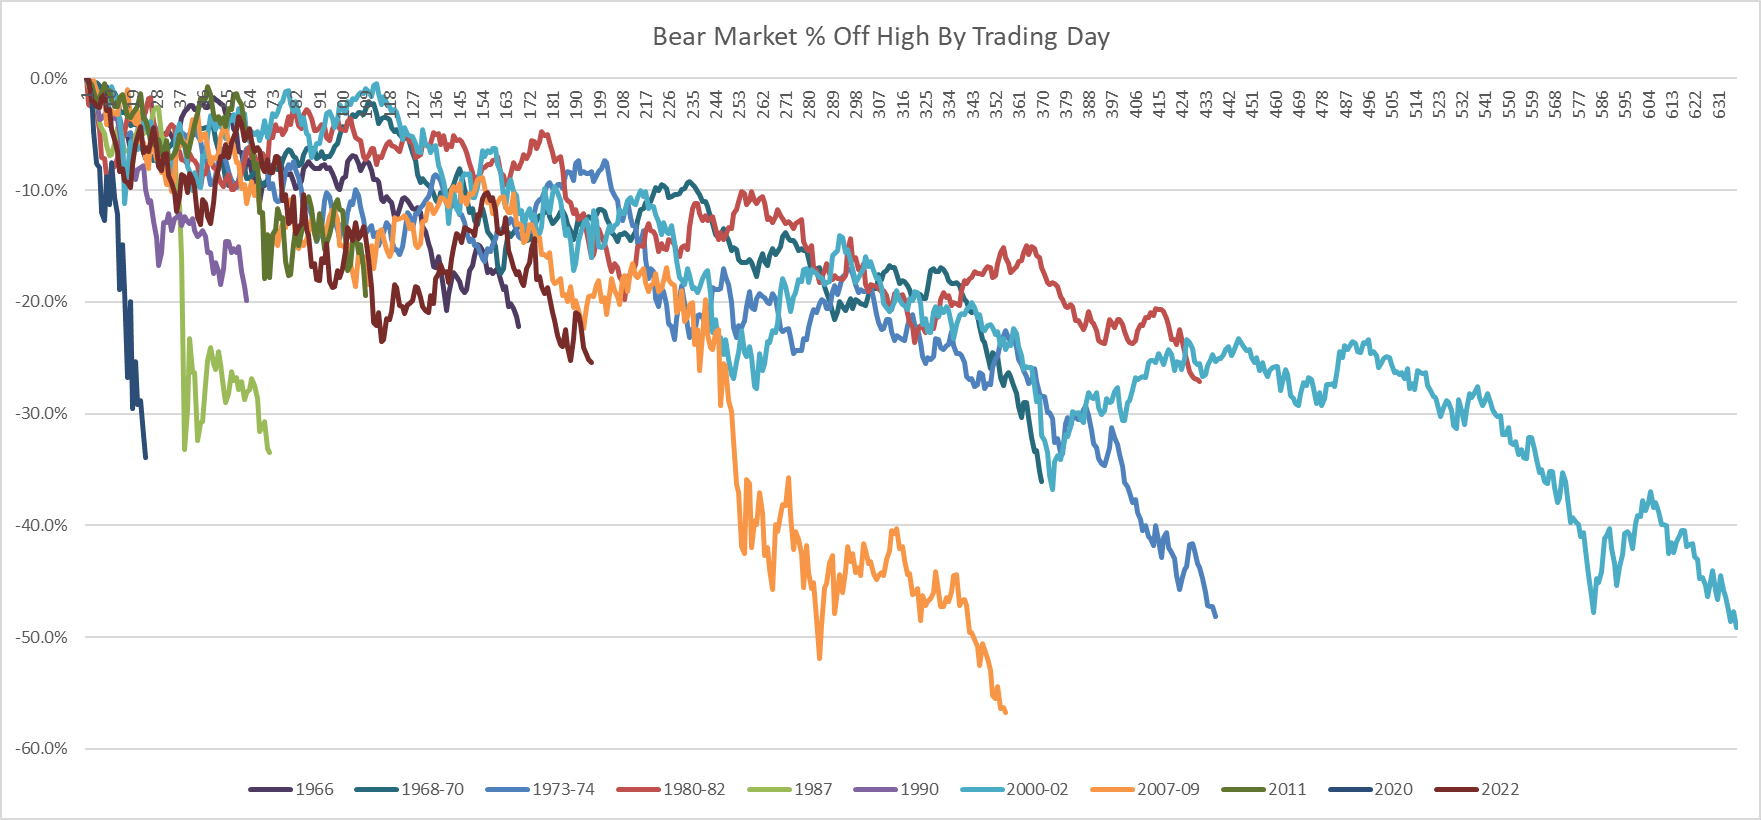
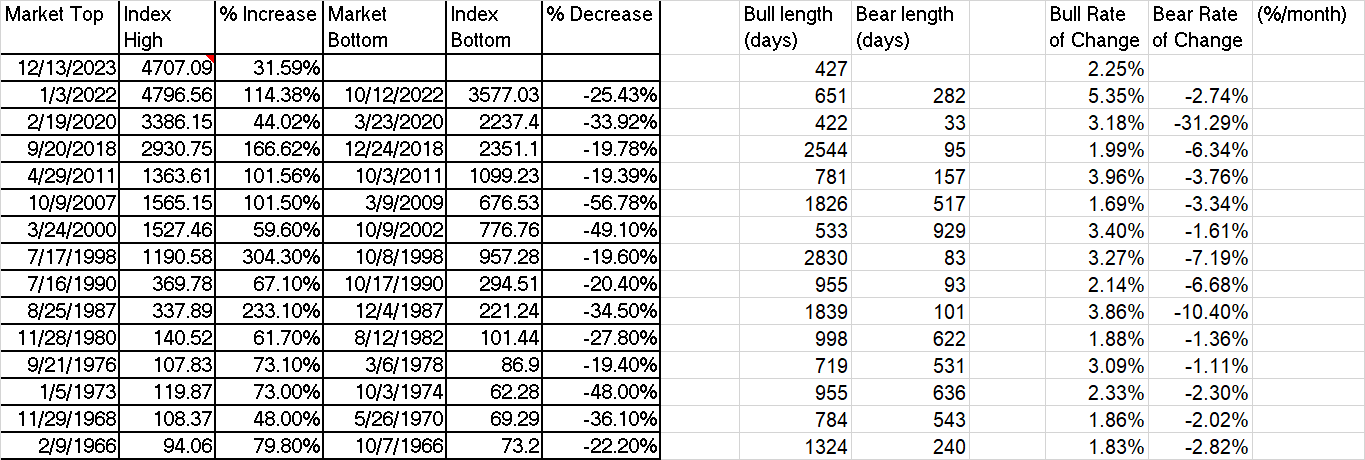
One other thing I got wrong last year was using too limited market history to make the call we were still in a bear market. Last year, I noted that there were two kinds of bear markets since 1973 - those that last a few months and lose around 20%, and those that are longer and deeper. The long bear markets also seem to have a "black swan" event in the second half unrelated to the original conditions that existed at the start. By October 2022, the bear market had already gone on for 10 months and was down 25.4%. My thinking in December 2022 was that there was more to come, possibly driven by some black swan in the first half of 2023.
As of December 2023, we never got a black swan event, and the lows of October 2022 seem to have held. If I had gone back just a few more years, I would have noticed a bear market in 1966 similar to the 2022 bear market in magnitude and duration.
If it's hard to spot the black line in the chart for the 1966 bear, here is some bull and bear market history in table format:
I learned a couple good lessons about forecasting in 2023 - make sure your model inputs are consistent and consider all available history. Did these mistakes cost me anything? As a value-focused buy-and-hold investor, I care more about individual company valuations and don't make big trades based on the macro outlook. As such, I probably wouldn't have done much different if I correctly anticipated a strong bull market in 2023. The opportunity cost of the one trade I considered but passed on, buying Google ( GOOGL ) in December 2022, impacted my overall portfolio return by about 1%. Extending my bond ladder in May rather than buying other Magnificent 7 stocks ( MGK ) had an opportunity cost of roughly another 1% on total portfolio value. See my 2023 mid-year review for more details on these trades.
Maybe the real lesson is don't make market forecasts, but I can't help myself, and I'm curious to see if I can improve even if it doesn't make a big difference in portfolio strategy. With that said, here is my outlook for 2024.
The Fed Is Our Friend Again, But GDP Matters More
Last year at this time, with the Fed Funds rate sitting at 4.25 - 4.50%, the Fed dot plot predicted a most likely case (10 out of 19 FOMC members) of 5.00 - 5.25% at the end of 2023. The market, as measured by the CME FedWatch tool , expected only 2 rate hikes, to 4.75 - 5.00%. The Fed was actually more hawkish than either of these forecasts, with the year ending at 5.25 - 5.50%. Long-term interest rates increased as well, though not as much. The 10-year went from 3.67% when my article was written last year to 4.04% as of the close on 12/13. The stock market had a strong year in spite of the rising rate environment. This is in part because GDP looks like it will grow 2.6% for 2023, compared to the 0.5% predicted by the Fed a year ago.
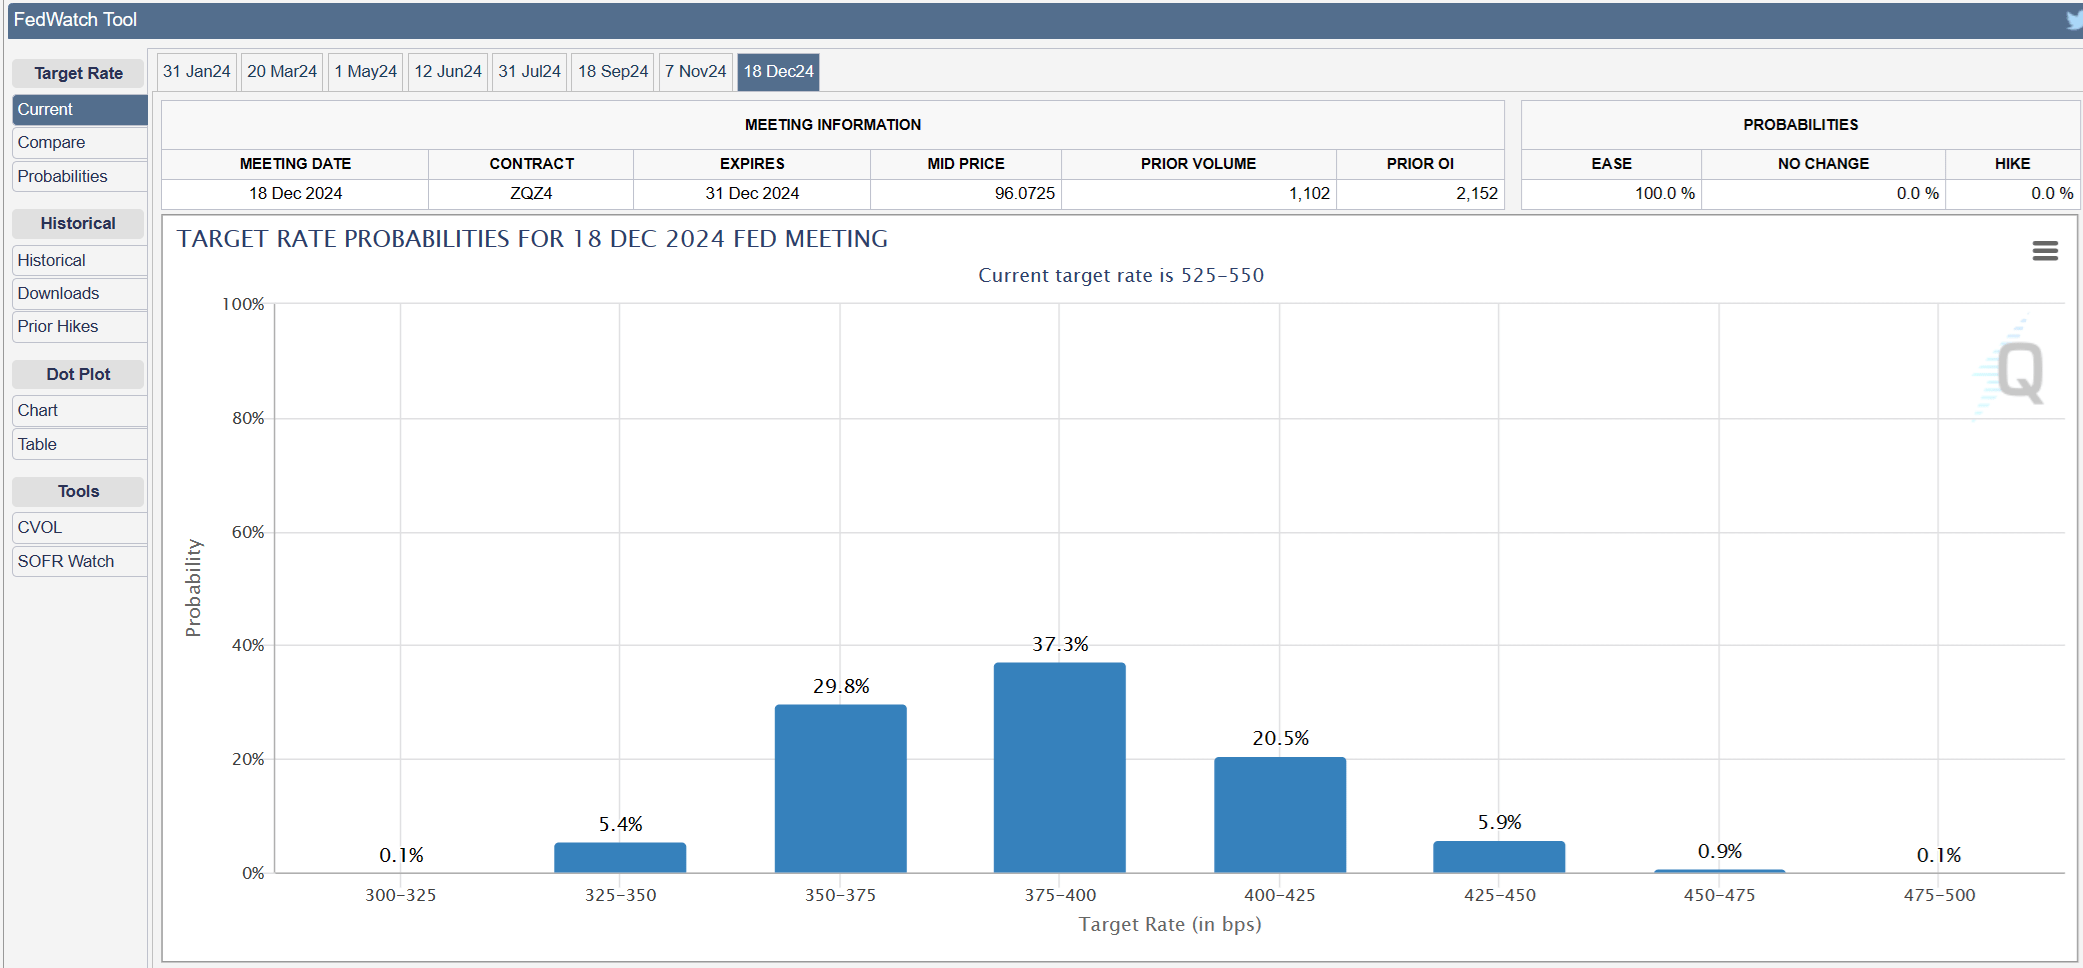
Looking forward, the latest forecast from the Fed is for a most likely case of 3 rate cuts to 4.50 - 4.75% in 2024. The market is much more dovish, with the CME FedWatch tool predicting a most likely range of 3.75 - 4.00%, or 6 rate cuts in 2024.
Regardless of what happens with the Fed Funds rate, I care more about the economy, which improved better than most expected in 2023 with PCE inflation coming down to 2.8% and GDP growing 2.6%. I normally advocate believing the Fed, but I think their current forecast for 2024 is overly pessimistic on both inflation and GDP. The Fed sees inflation only coming down to 2.4% and GDP declining to 1.4%.
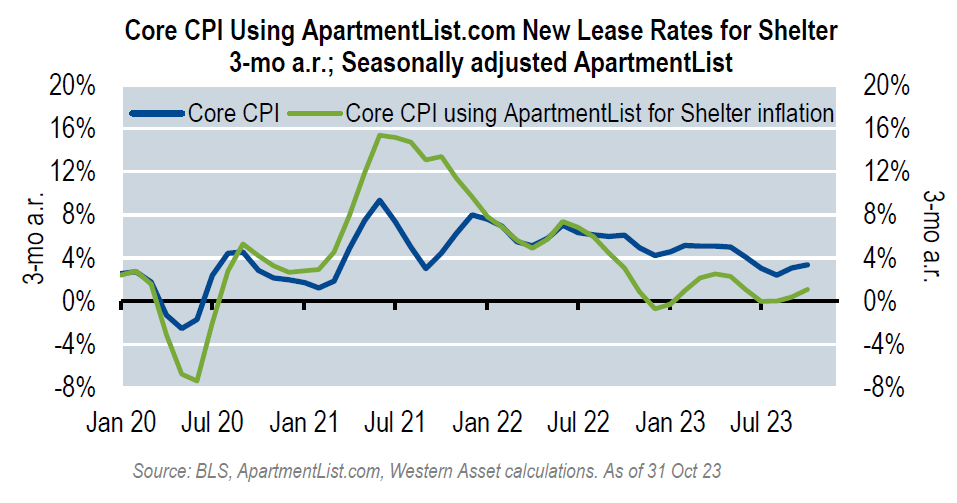
Inflation to me appears well on its way to 2% or lower in 2024. If we look at the last 3 months (Aug.-Nov. 2023), CPI-U increase has been close to zero. It would be even lower if shelter inflation was measured using current rent costs rather than the lagged values now in the calculation.
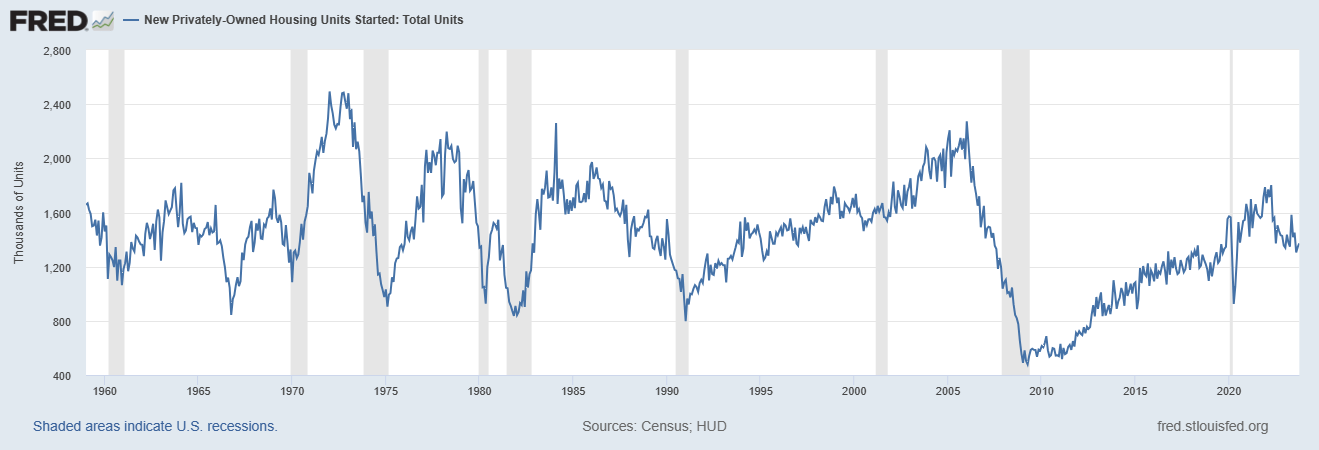
Economic growth could surprise to the upside as well. Housing starts, while down from 2022 levels, are still better than at any time during the 2010-2019 period despite the highest mortgage rates in 20 years. The current level looks more like the average from the 1960's-1980's rather than the last two cycles distorted by the early 2000's housing bubble and subsequent crash.
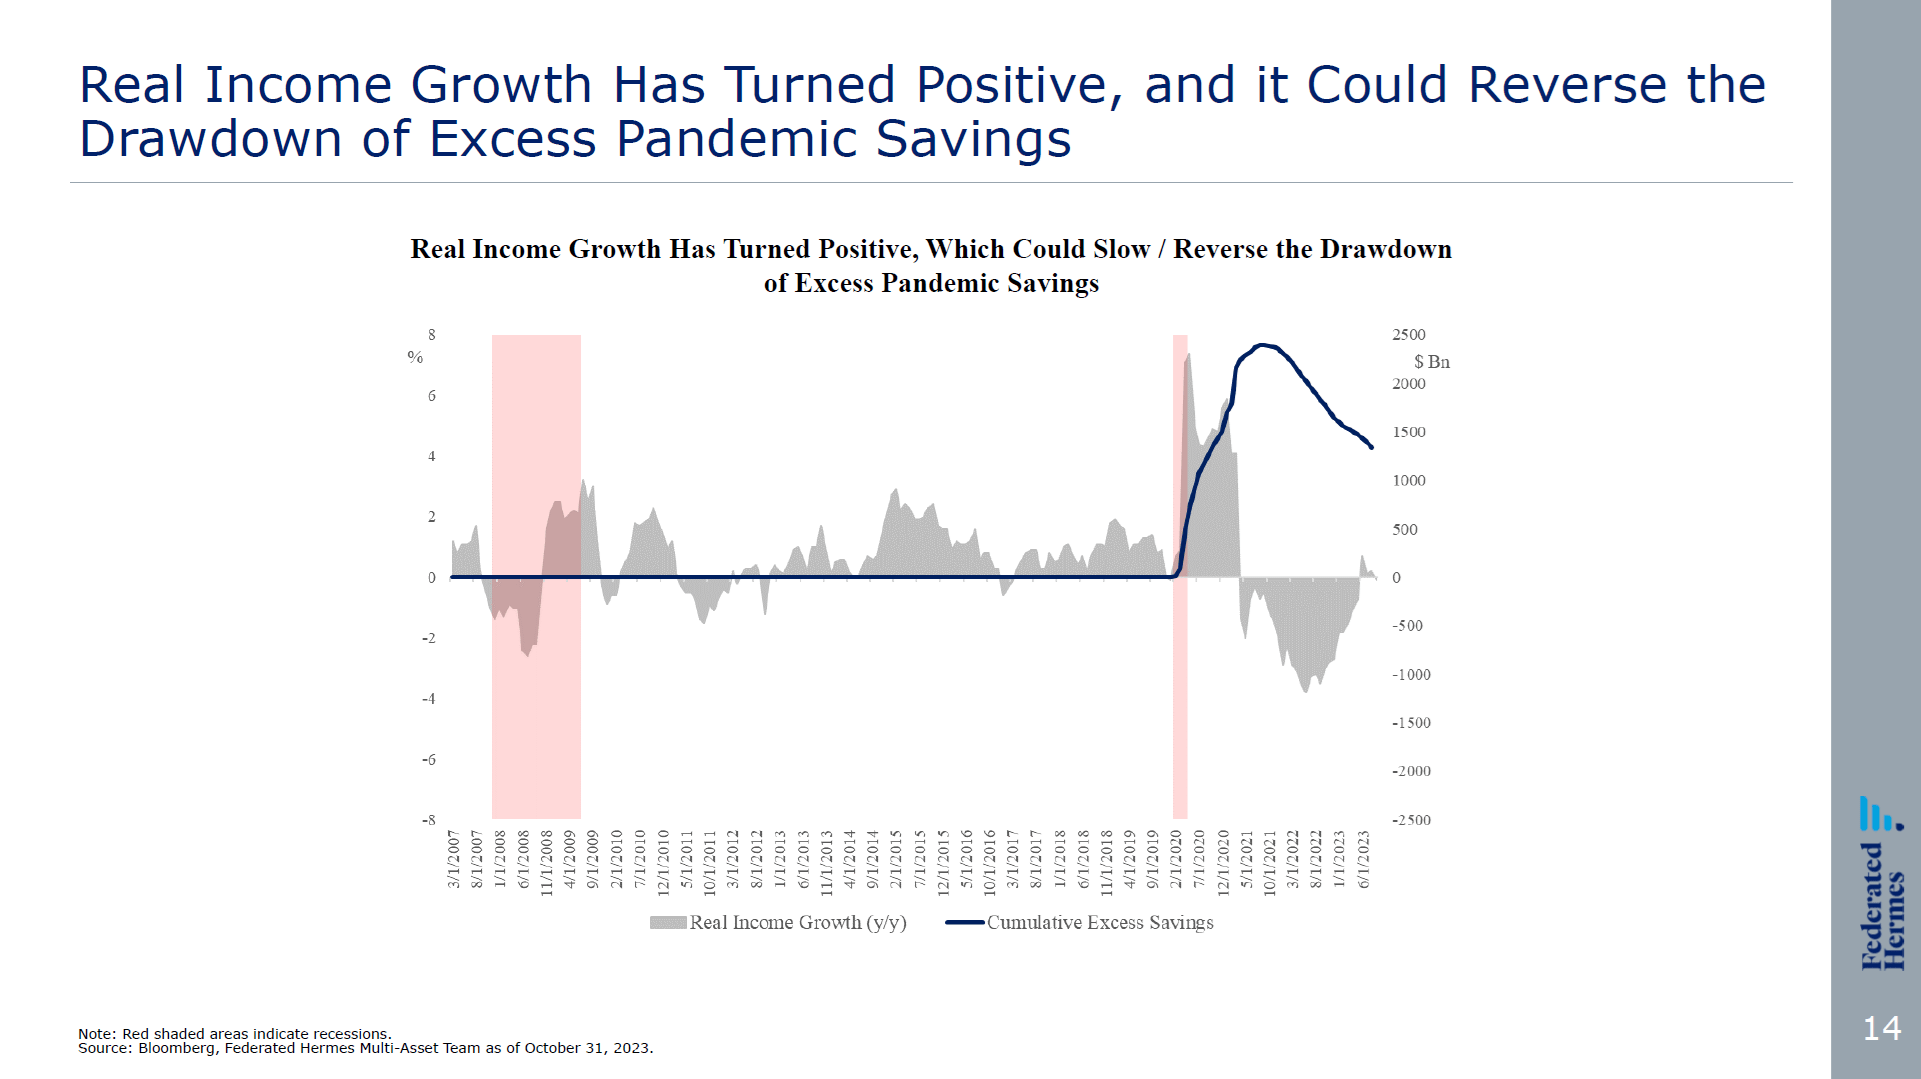
Consumer spending is also holding up well. Retail sales just surprised to the upside for November 2023 with 0.3% monthly growth compared to an expected decline of -0.1%. While consumer saving rates are lower, some sources estimate that excess savings from the pandemic still exists, and real income growth has turned positive again. These factors can support continued strong spending, at least into 2024.
If the economy stays strong, I expect no change in the real 10-year yield from the current 1.88%. The 10-year foreword inflation expectation should return to 2% resulting in a nominal 10-year rate of 3.88%. The Fed Funds rate could be even with or higher than this at the end of 2024, but I expect the 2-10 year yield curve to turn positive, with my prediction for the 2-year at 3.7% based on Fed Funds dot plot estimates from 2024-2026.
My Year-End 2024 Target: 5023
Although he guessed a little high for 2023, my outlook for a decent economy leads me to accept S&P analyst Howard Silverblatt's as reported earnings prediction of $220 for 2024. This is a 13.5% increase from the current expectation for 2023. Feeding this into the valuation model, along with a 3.88% 10-year and 4.5% nominal long-term growth rate (2.5% real), I get a value of 5023 for the S&P 500.
Author Spreadsheet
This forecast is an increase of 6.5% from current levels.
What About Politics?
2024 is a presidential election year. I strongly advise keeping your personal views toward any individual politician separate from your investing outlook. Otherwise, you could end up looking like Paul Krugman on election night 2016 .
It really does now look like President Donald J. Trump, and markets are plunging. When might we expect them to recover?
Frankly, I find it hard to care much, even though this is my specialty. The disaster for America and the world has so many aspects that the economic ramifications are way down my list of things to fear.
Still, I guess people want an answer: If the question is when markets will recover, a first-pass answer is never.
Source: New York Times
Spoiler alert: The S&P ended up 1.1% the day after the 2016 election and went on to set 84 new closing highs before settling down a bit in 2018.
It would have been equally silly to bemoan the 2020 election results from a market standpoint. The S&P was up 2.2% the day after the election and set 82 new closing highs before the bull market top on 1/3/2022.
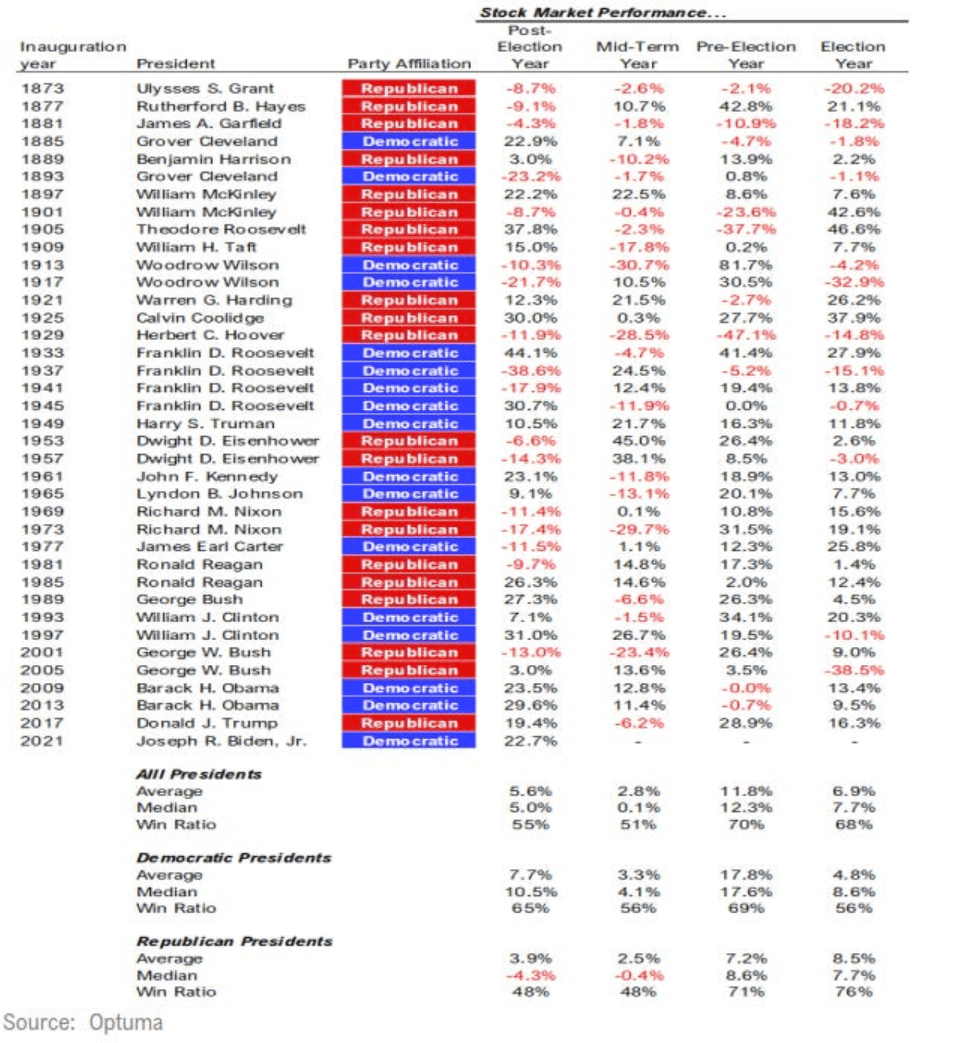
The predictions for doom and gloom will probably be ramped up in 2024 way beyond any prior election year. The best thing you can do is tune them out. Nevertheless, the pattern of varying S&P returns by year within a presidential term is a real phenomenon. Year 3 tends to be the best with double digit returns on average, which matched what we have seen in 2023. Year 4 and Year 1 (2024 and 2025) tend to be the second and third best with returns around the long-term average. Year 2 has the lowest average returns and has been negative half the time, matching what we saw in 2022.
My 2024 prediction of a 6.5% return is very close to the long-term average return for an election year.
Conclusion
Forecasting 1-year returns for the S&P 500 is notoriously difficult, and not that useful for long-term buy and hold value investors who own individual stocks. I did a terrible job in 2023, no better than the average Wall Street analyst, although I can partially blame it on an input error to my model, using a real rather than nominal growth rate. I also expanded my thinking about how bear markets can end by looking at a broader range of history than I did last year. Still, it was worth going through the exercise because it helped me think about what could happen to interest rates and GDP in 2024, factors which do impact the performance of individual companies.
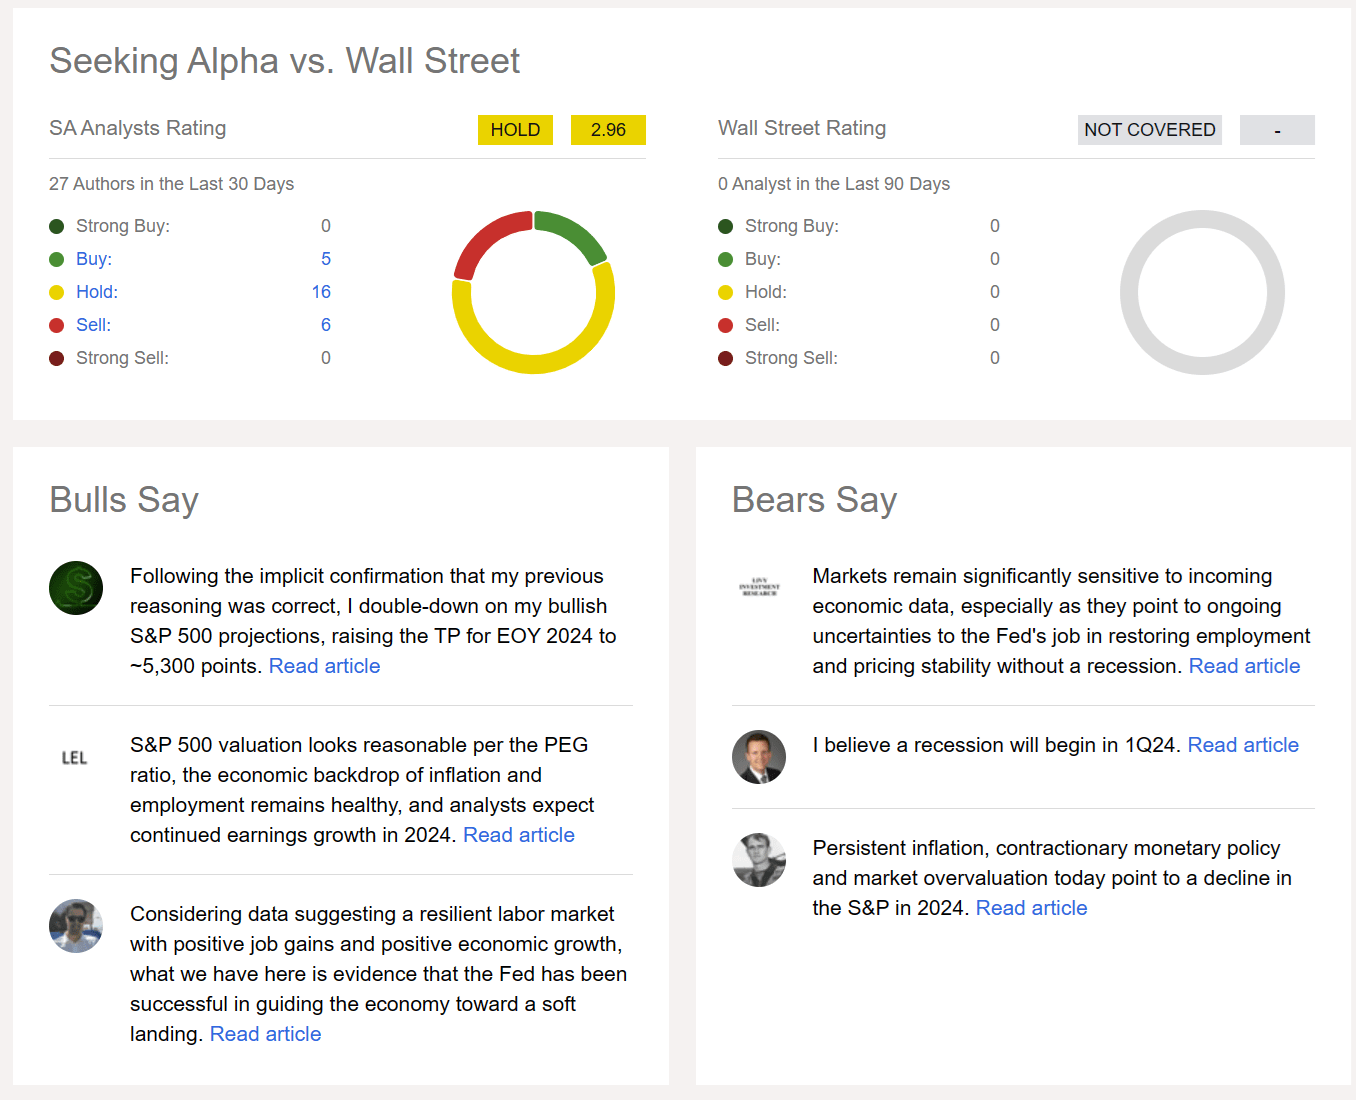
My resulting 2024 forecast of 5023 on the S&P should be taken with several grains of salt. If you feel like you have to have an S&P 500 forecast to help you invest in 2024, I suggest using the method that Ken Fisher employed for many years. Ken would look at all the forecasts, lump them into groups of "up a little", "up a lot", "down a little", and "down a lot". He would then pick the category with the fewest predictions in it for his forecast. Ken's thesis was that the market worked to humiliate the largest number of people as possible the largest number of times. Looking at Seeking Alpha analyst ratings under the ( SP500 ) ticker, I notice a majority of "Hold" ratings, followed by "Sell", with "Buy" the fewest.
I equate "Sell" with "down a lot" and "Hold" with "down a little". Considering some of the "Buys" fall into the "up a lot" category, I am happy to see that my 6.5% return prediction is in the contrarian sweet spot of "up a little". Ken was also a big believer in the presidential cycle, which for Year 4 in 2024 is also consistent with my prediction.
S&P target aside, the main takeaway is that I expect Goldilocks "just right" inflation and GDP in 2024, as we got to that point in 2023 faster than most people anticipated. These conditions could help value stocks ( IVE ) and small caps ( IWM ) ( IJR ) outperform while the Magnificent 7 are a drag on the market, limiting the S&P to my up a little forecast. We've seen that over the last couple days since the Fed announcement, and I expect it to persist into the new year.
Editor's Note: This article was submitted as part of Seeking Alpha's 2024 Market Prediction competition , which runs through December 20. With cash prizes, this competition -- open to all contributors -- is one you don't want to miss. If you are interested in becoming a contributor and taking part in the competition, click here to find out more and submit your article today!
For further details see:
It's A Bull Market After All - Expect It To Continue In 2024