SPG - It's The Best Time In 10 Years To Buy These Sweet REIT Bargains
2023-09-19 07:05:00 ET
Summary
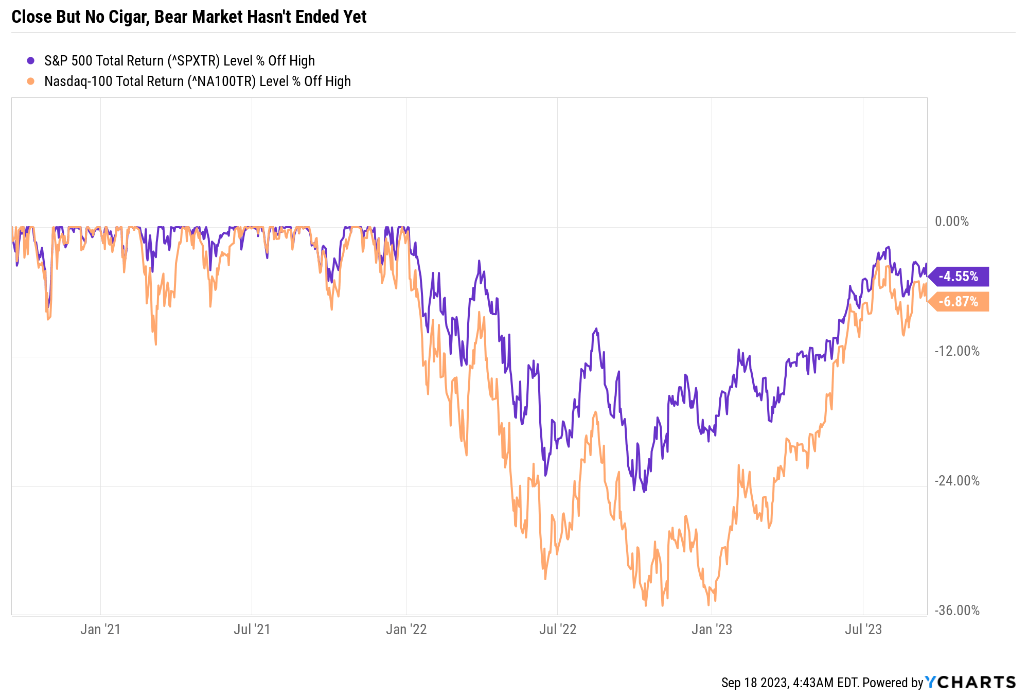
- The S&P and Nasdaq came close to brand-new highs, but most stocks haven't.
- REITs are the most historically undervalued sector. In fact, statistically, it's the best time in 10 years to buy REITs.
- The market is worried about higher for longer interest rates hurting REITs. The market is dead wrong, because it's focusing on the wrong metric.
- The investment spread is what matters, interest rates on their own are irrelevant to REIT profitability. REITs were thriving in the 70s and early 80s with 20% borrowing costs because properties were so cheap.
- Here are four 5+% yielding REIT blue chips with strong balance sheets, low costs of capital, and very safe yields as high as 6.6%. They offer 17% to 30% annual total return potential through 2025 and over the next decade, are expected to more than triple in value, beating the S&P by almost 100% of returns.
The party of Wall Street appears to be ending, and Morgan Stanley's earlier prediction that we'd get close to a new record high before falling to new lows (about 30% below record highs) appears to be coming true.
The market gods have been teasing investors, letting them think that the worst was over, when the data says that most likely more pain is coming.
S&P Base-Case 2024 Recession Scenario (July 2024 Recession Start, October 2024 Market Bottom)
| Earnings Decline |
| S&P Trough Earnings |
| Historical Trough P/E Of 14 (13 to 15 range) |
| Decline From Current Level |
| Peak Decline From Record Highs |
| 0% |
| 276 |
| 3863 |
| 13.2% |
| -19.8% |
| 5% (consensus) |
| 262 |
| 3670 |
| 17.5% |
| -23.8% |
| 10% (Bank of America) |
| 248 |
| 3477 |
| 21.9% |
| -27.8% |
| 13% (historical average since WWII) |
| 240 |
| 3361 |
| 24.5% |
| -30.3% |
| 15% |
| 235 |
| 3284 |
| 26.2% |
| -31.9% |
| 20% (Morgan Stanley, Moody's) |
| 221 |
| 3091 |
| 30.5% |
| -35.9% |
(Sources: FactSet, Bloomberg, DK S&P Valuation Tool.)
The pain for index investors could be very nasty indeed.
The 2022 bear market might not bottom until October 2024. In fact, that is the current base-case given the data.
That means the 2022 bear market might not end until 2025 (with a new record high) or possibly not until early 2026.
That would put it on par with the tech crash in duration, the 2nd longest bear market in history.
Though one whose severity at -30% peak decline is perfectly average for bear markets.
| Time Frame |
| Historically Average Bear Market Bottom |
| Non-Recessionary Bear Markets Since 1965 |
| -21% (Achieved May 20th) |
| Median Recessionary Bear Market Since WWII |
| -24% (Citigroup base case with a mild recession) June 16th |
| Non-Recessionary Bear Markets Since 1928 |
| -26% (Goldman Sachs base case with a mild recession) |
| Average Bear Markets Since WWII |
| -30% (Morgan Stanley base case) |
| Recessionary Bear Markets Since 1965 |
| -36% (Bank of America recessionary base case) |
| All 140 Bear Markets Since 1792 |
| -37% |
| Average Recessionary Bear Market Since 1928 |
| -40% (Deutsche Bank, Bridgewater, SocGen Severe Recessionary base case, Morgan Stanley Recessionary Base Case) |
| (Sources: Ben Carlson, Bank of America, Oxford Economics, Goldman Sachs.) |
Of course, "average" bear markets never feel average. And few of us are truly 100% index investors.
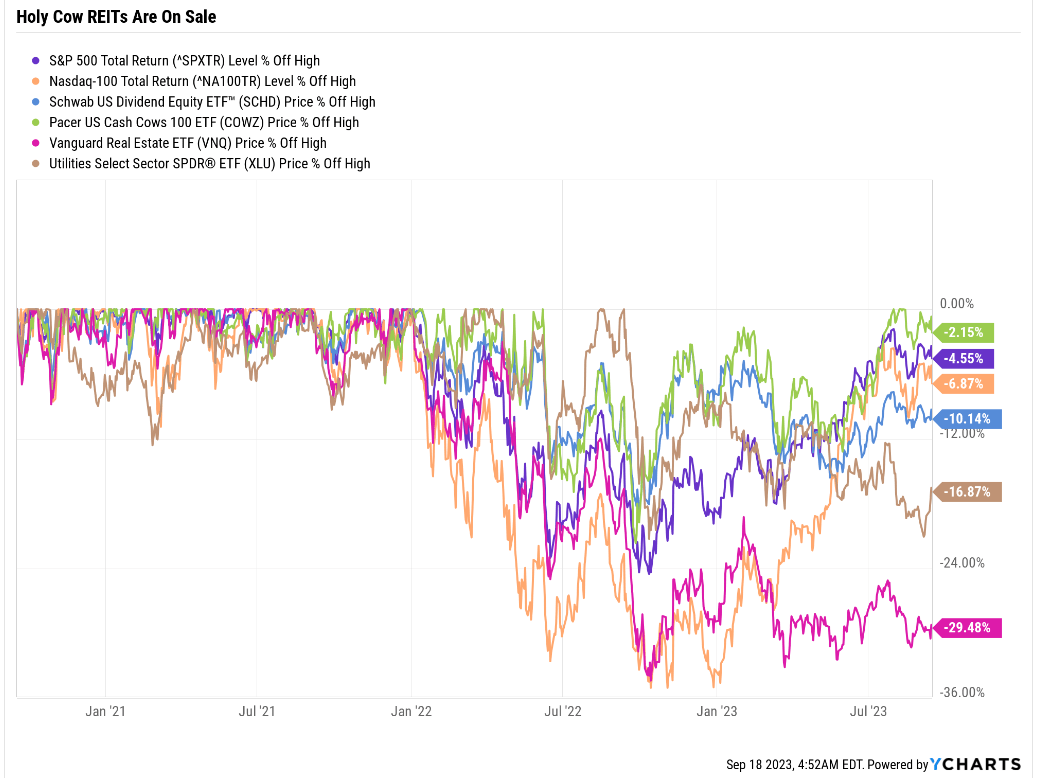
A market of stocks, not a stock market. Just look at how utilities quickly ended their bear market in mid 2022 and are now in a brand new one.
Look at how high-yield blue-chips ( SCHD ) have languished due to the regional banking crisis.
Or look at how real estate investment trusts, or REITs, have been stuck in high rate hell for the entire time.
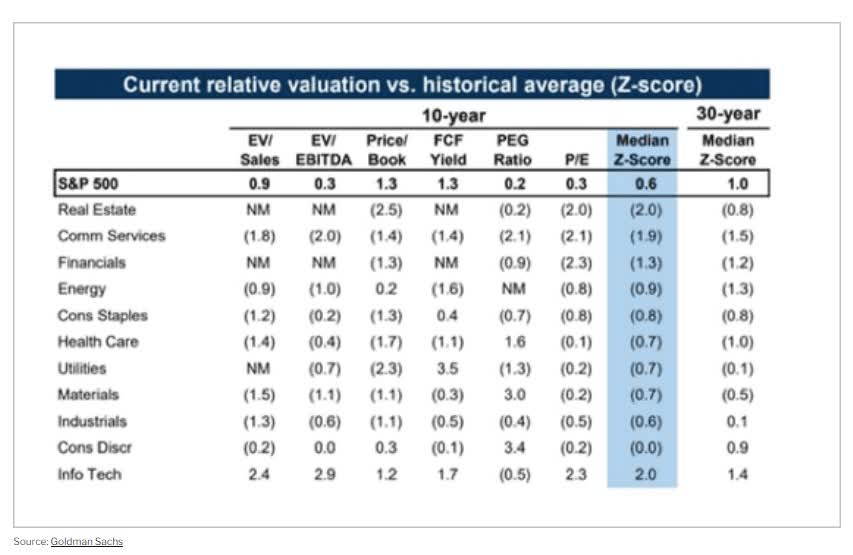
REITs are now, as a sector, the most undervalued thing you can buy. In fact, REITs are the cheapest they've been in a decade!
Why The Market Is Dead Wrong About REITs Right Now
The market likes to focus on one metric at a time, and pretend that metric is all that matters. Interest rates have been that metric for over a decade.
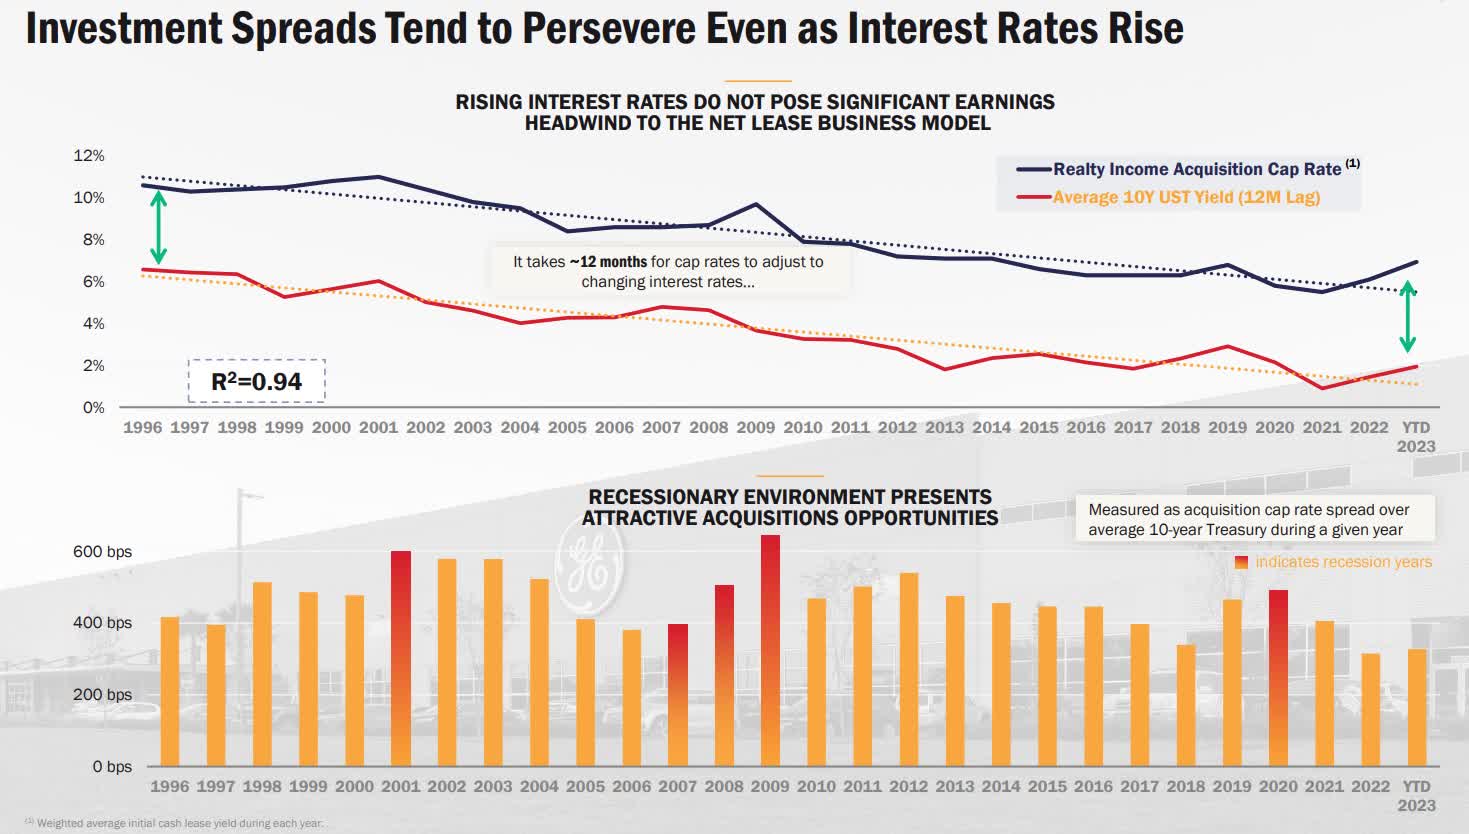
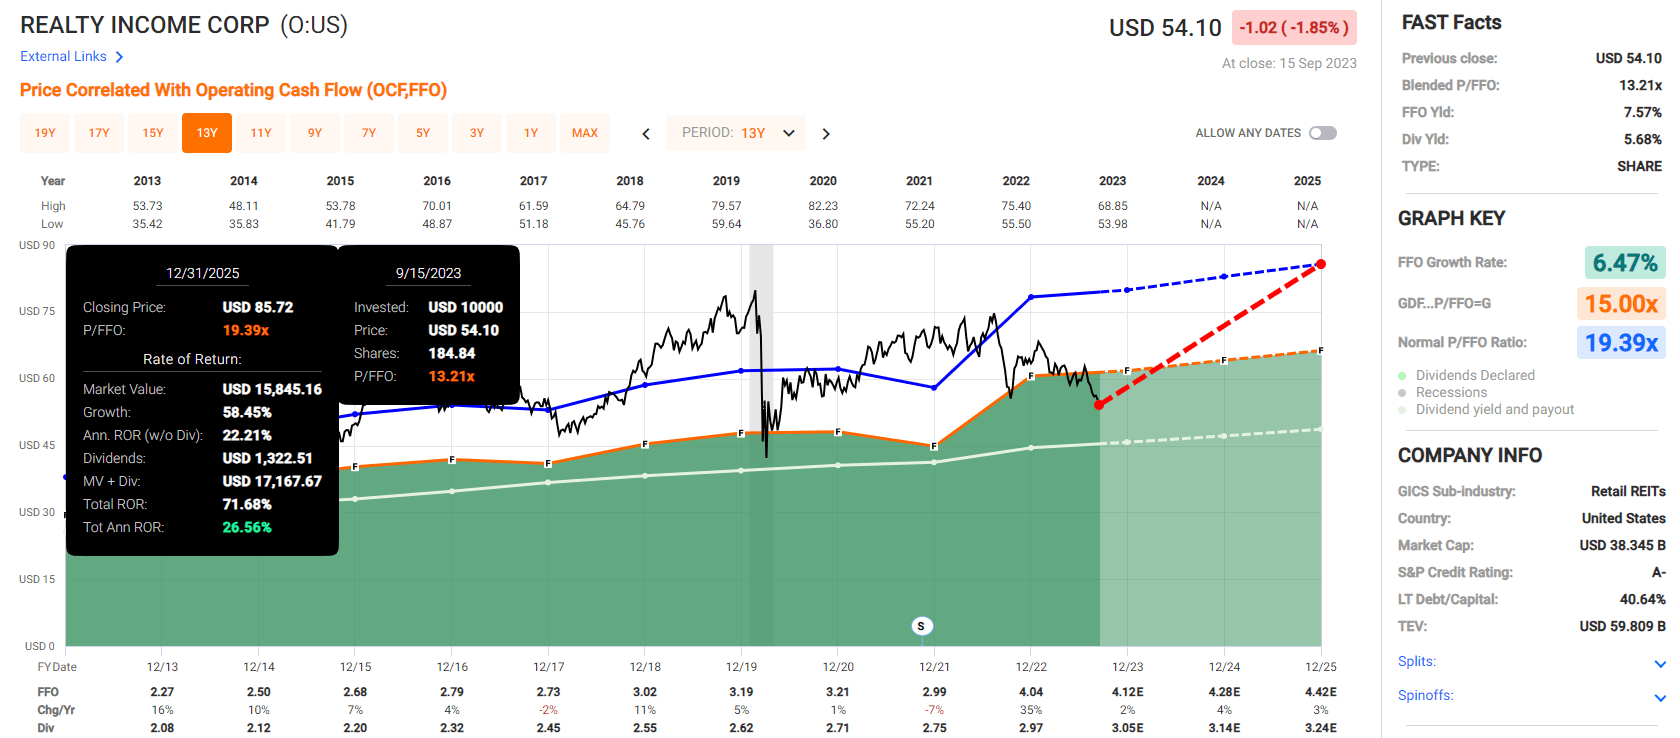
Realty Income Corporation ( O ) is a great example of how interest rates are irrelevant to the profitability of a REIT.
Even when interest rates were as high as 7% in the 1990s Realty was able to generate consistent and healthy investment spreads.
This is pretty much how all REITs work. Management borrows and sells shares to buy properties that it will rent out.
- cap rate (cash yield) on property - cost of capital (borrowing cost, equity, and retained cash flow) = investment spread.
If you must obsess over one metric for REITs it's the investment spread.
Want proof that this is the metric that matters and interest rates are 100% irrelevant?
In the Volker era 10-year yields hit 16%.
REITs were created in 1960 by Congress and Realty Income was founded in 1969.
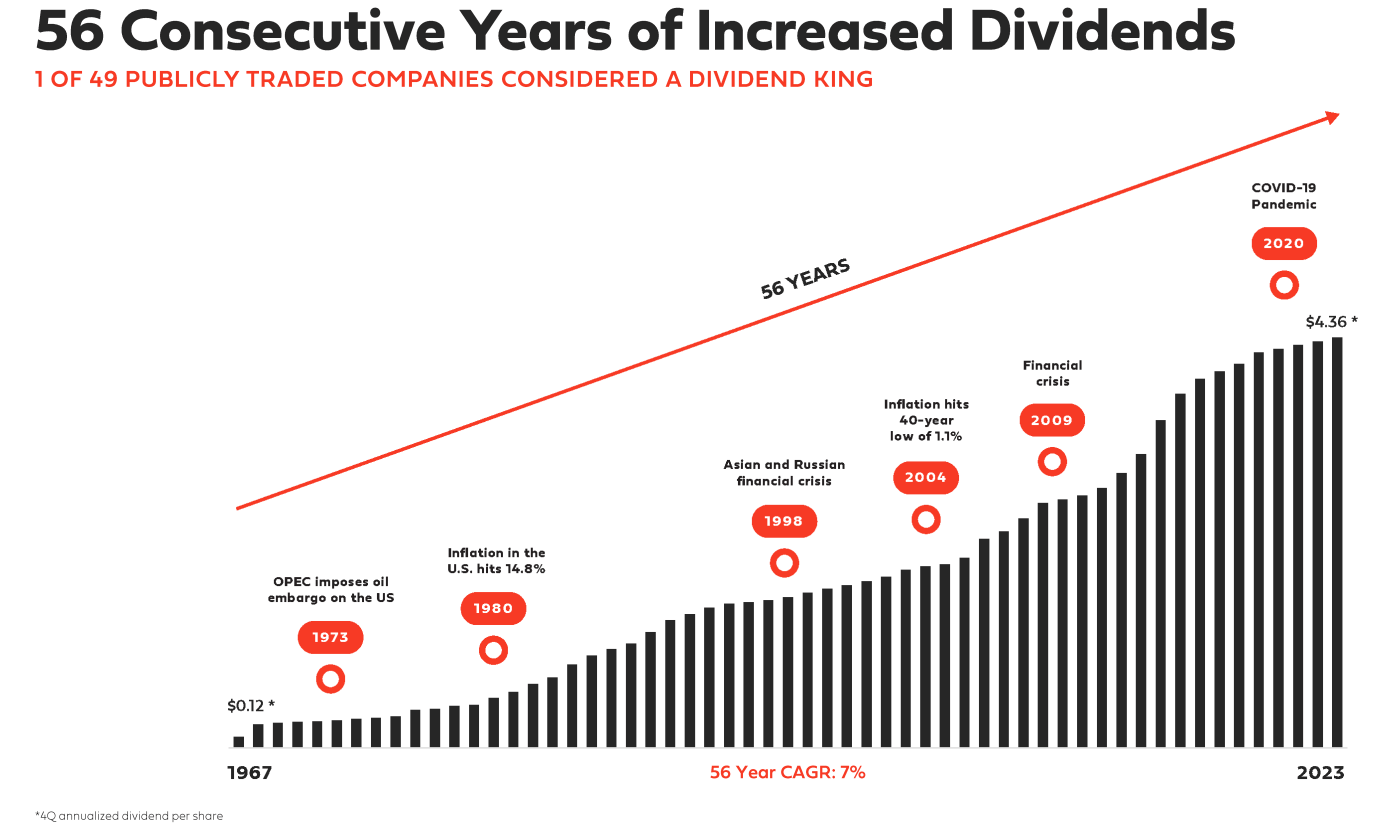
Realty was around and growing when rates were 16%. It's borrowing costs at the time were close to the 20% Fed funds rate.
Or how about Federal Realty Investment Trust ( FRT )? That is the only dividend king in REITdom and was founded in 1962.
This Happened Despite 20% Borrowing Costs In 1981!
If interest rates are 0% and REITs like O and FRT are paying 5% cap rates (20X FFO) or interest rates are 20% and O and FRT are paying 25% cap rates and 4X FFO, the profitability of their businesses are the same.
That is what REIT investors often forget. Just like new income investors might forget that debt is 100% irrelevant.
- rating agencies never worry about debt
- debt/EBITDA and interest coverage and cash flow stability are what matter most.
Ratios are what matter, not individual metrics.
That is why it's the best time in a decade to buy the world's best blue-chip REITs, and here are some ideas.
How To Find The Best Sweet REIT Bargains Today
From 504 stocks in the Dividend Kings Master list to four 5+% yielding non-speculative investment grade, non-speculative REITs.
All in one minute thanks to the DK Zen Research Terminal. This is how I find all my investment ideas.
| Step |
| Screening Criteria |
| Companies Remaining |
| % Of Master List |
| 1 |
| "sectors" and "REITS" |
| 53 |
| 10.60% |
| 2 |
| Non-Speculative (No Turnaround Stocks, investment grade) |
| 37 |
| 7.40% |
| 3 |
| BHS Rating "reasonable buy, good buy, strong buy, very strong buy, ultra value buy" |
| 34 |
| 6.80% |
| 4 |
| Investment Grade Credit Rating (BBB- or higher) |
| 31 |
| 6.20% |
| 5 |
| Dividend Safety 81+ (very safe, 2% or less risk of cut) |
| 26 |
| 5.20% |
| 6 |
| Yield 5+% |
| 6 |
| 1.20% |
| 7 |
| Total Return Potential 8+% (for defensives) |
| 4 |
| 0.80% |
| Total Time |
| 1 minute |
And here they are, sweet REIT bargains, two of which are in Brad Thomas's top 5 REIT investment ideas for September.
I screened for credit rating because cost of capital is everything in a high rate environment. You don't want to mess around with junk bond rated REITs that might be forced to slash dividends if rates stay higher for longer.
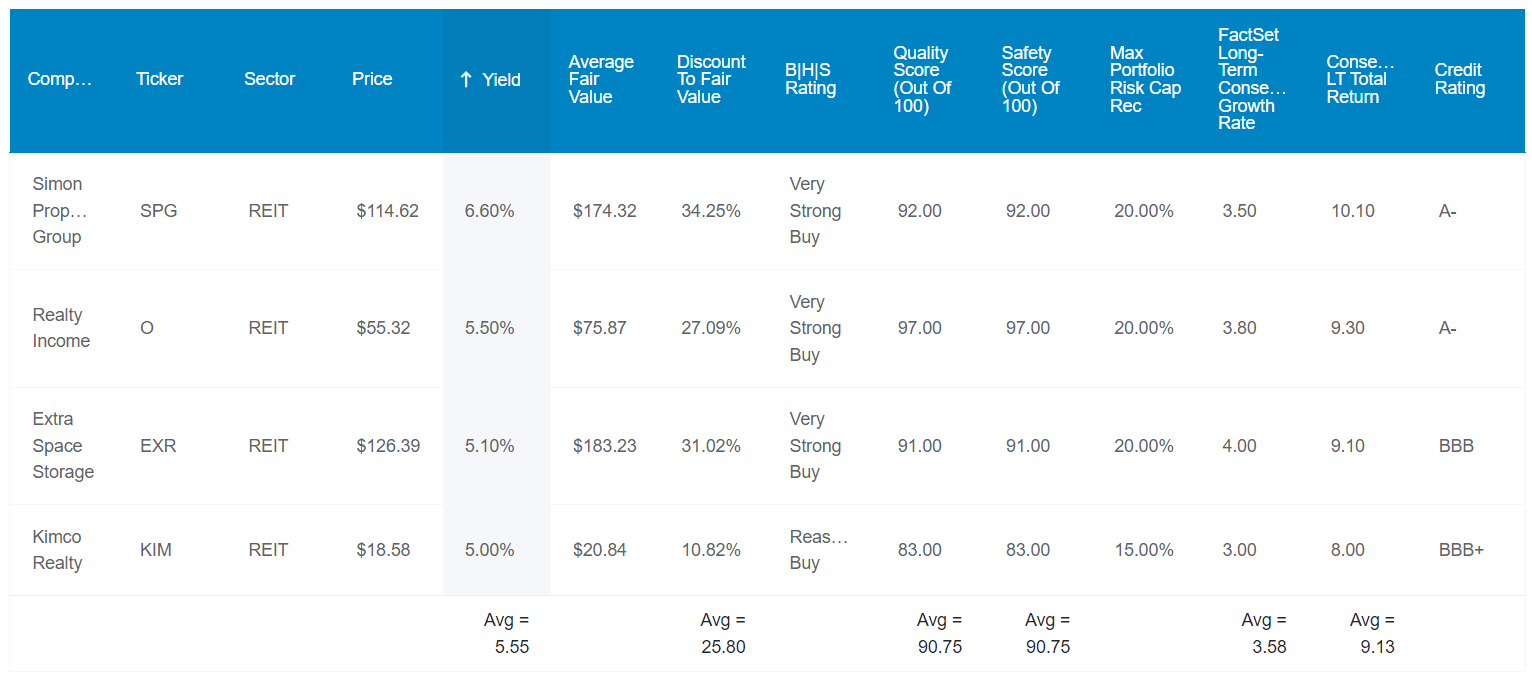
I sorted these by yield and have linked to articles for further research.
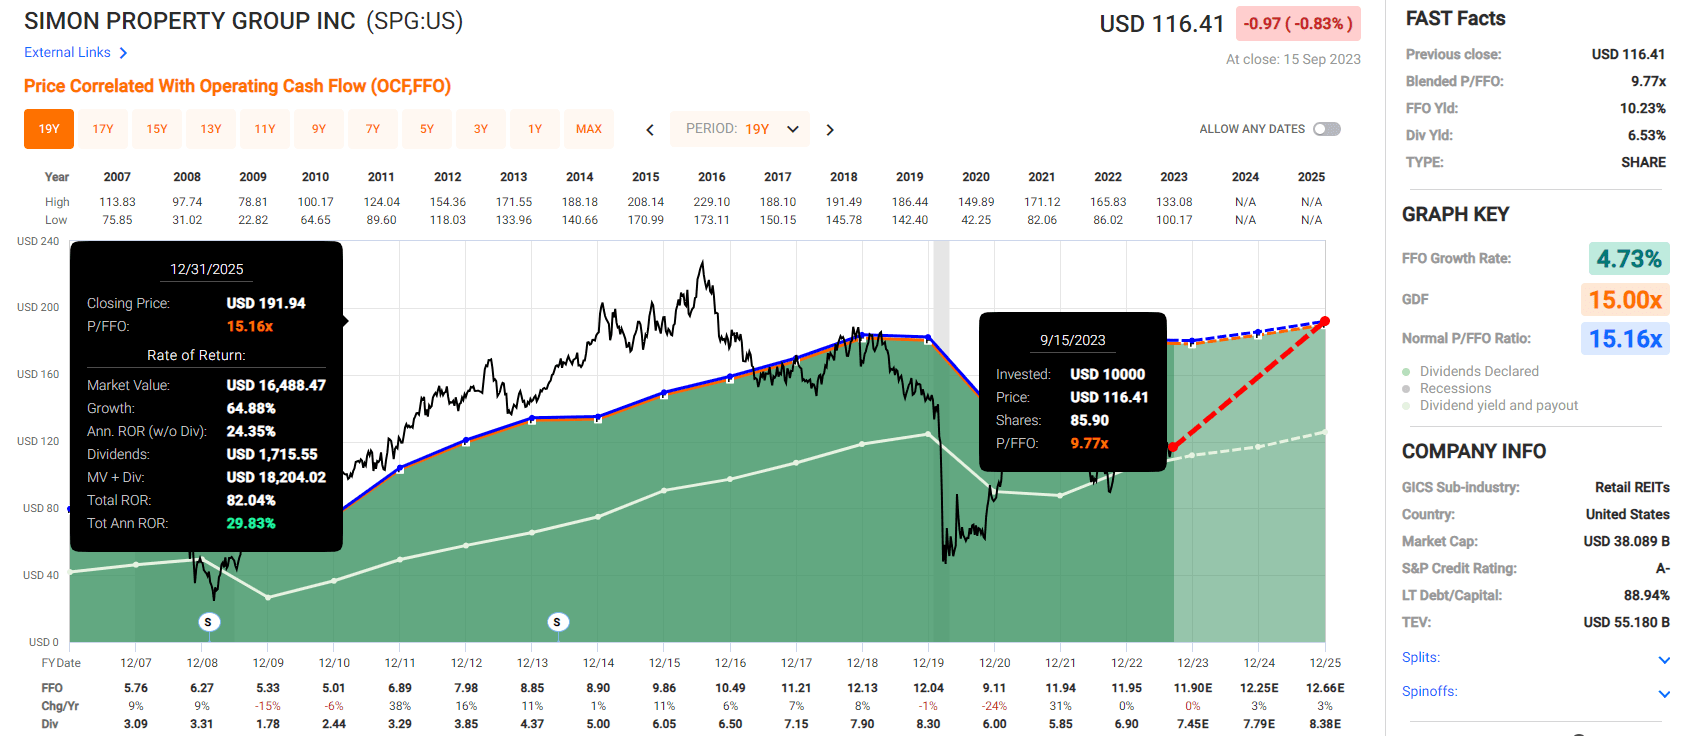
- Simon Property Group ( SPG )
- Realty Income ( O )
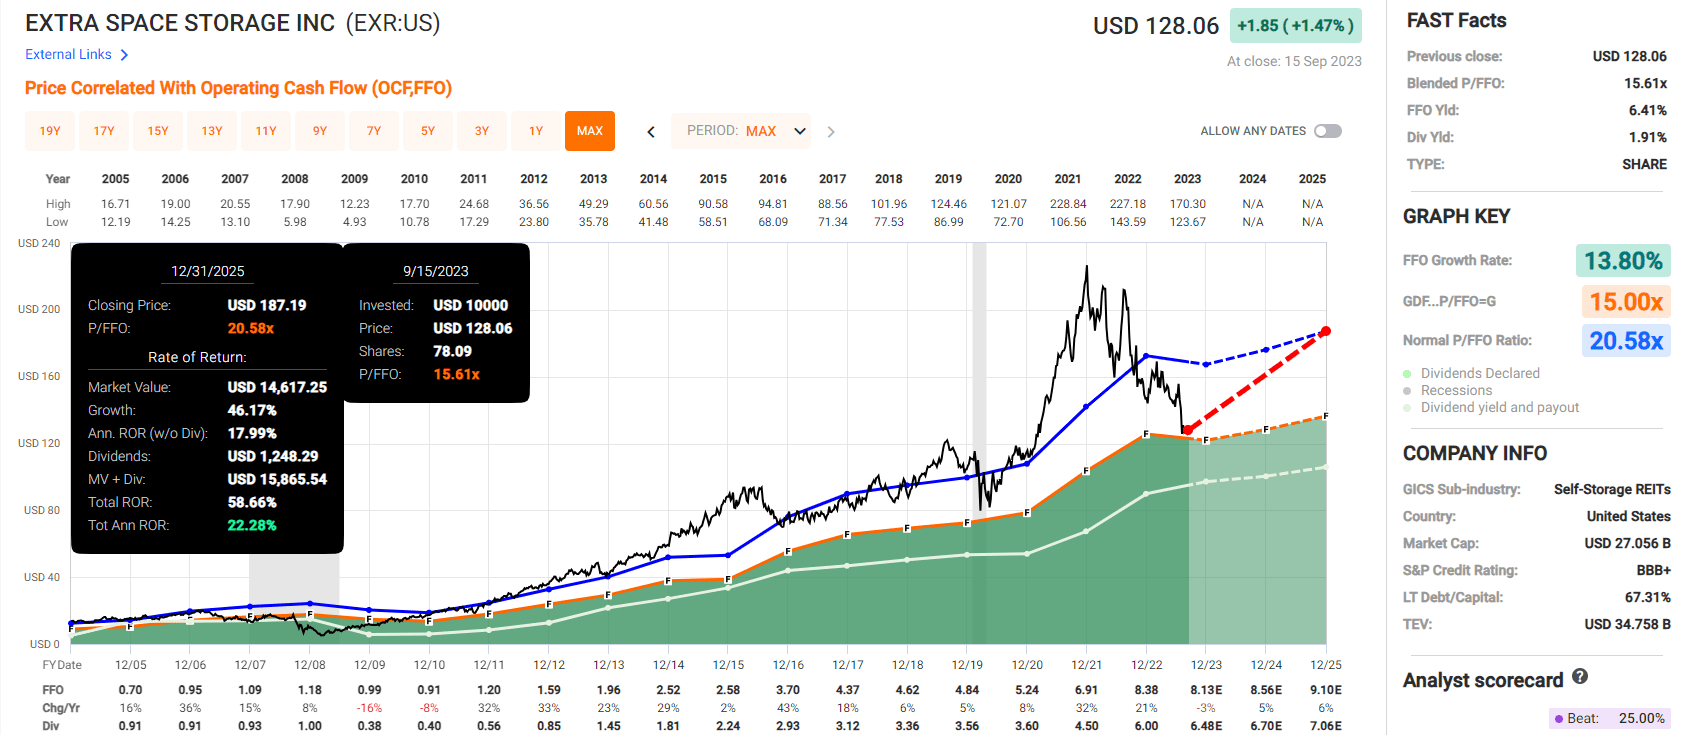
- Extra Space Storage ( EXR )
- Kimco Realty ( KIM )
Fundamentals Summary
- yield: 5.6%
- dividend safety: 91% very safe (1.45% dividend cut risk)
- overall quality: 91% medium-risk 12/13 Super SWAN
- credit rating: BBB+ average (good cost of capital)
- long-term growth consensus: 3.6%
- long-term total return potential: 9.1%
- discount to fair value: 26% discount (very strong buy) vs 15% overvaluation on S&P
- 10-year valuation boost: 3.1% annually
- 10-year consensus total return potential: 5.6% yield + 3.6% growth + 3.1% valuation boost = 12.2% = 216% vs 130% S&P 500.
Triply your money in a decade while locking in a very safe 5.6% yield from industry leading REITs in four different sectors.
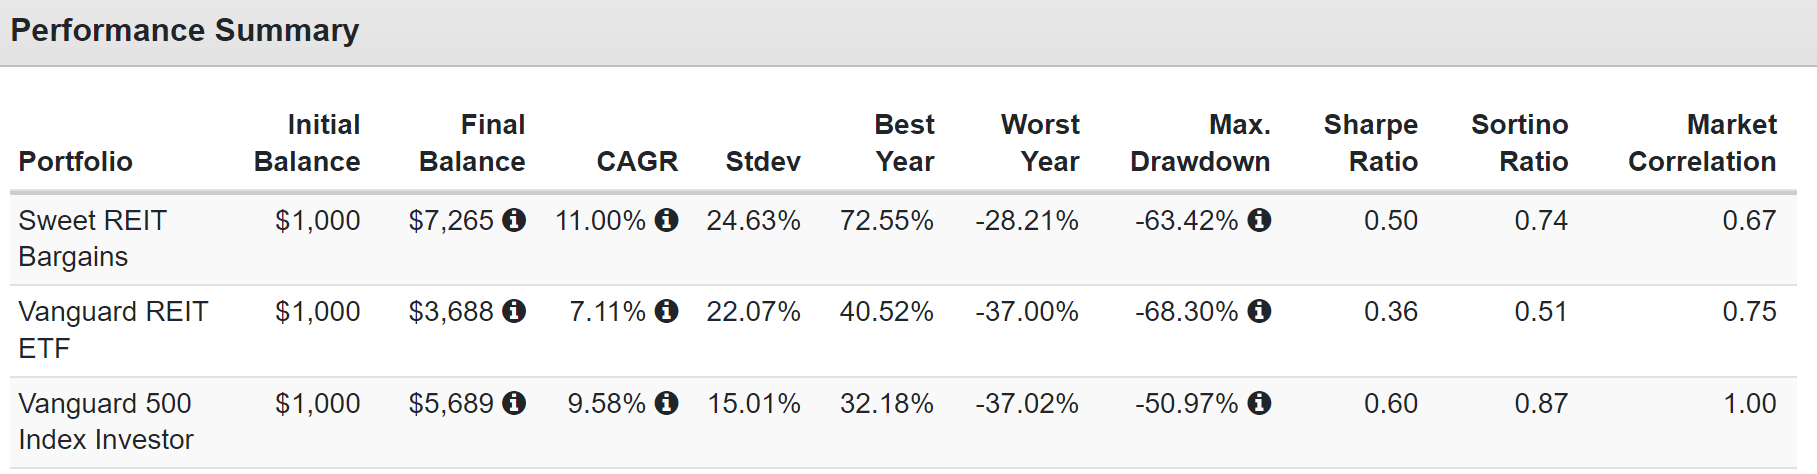
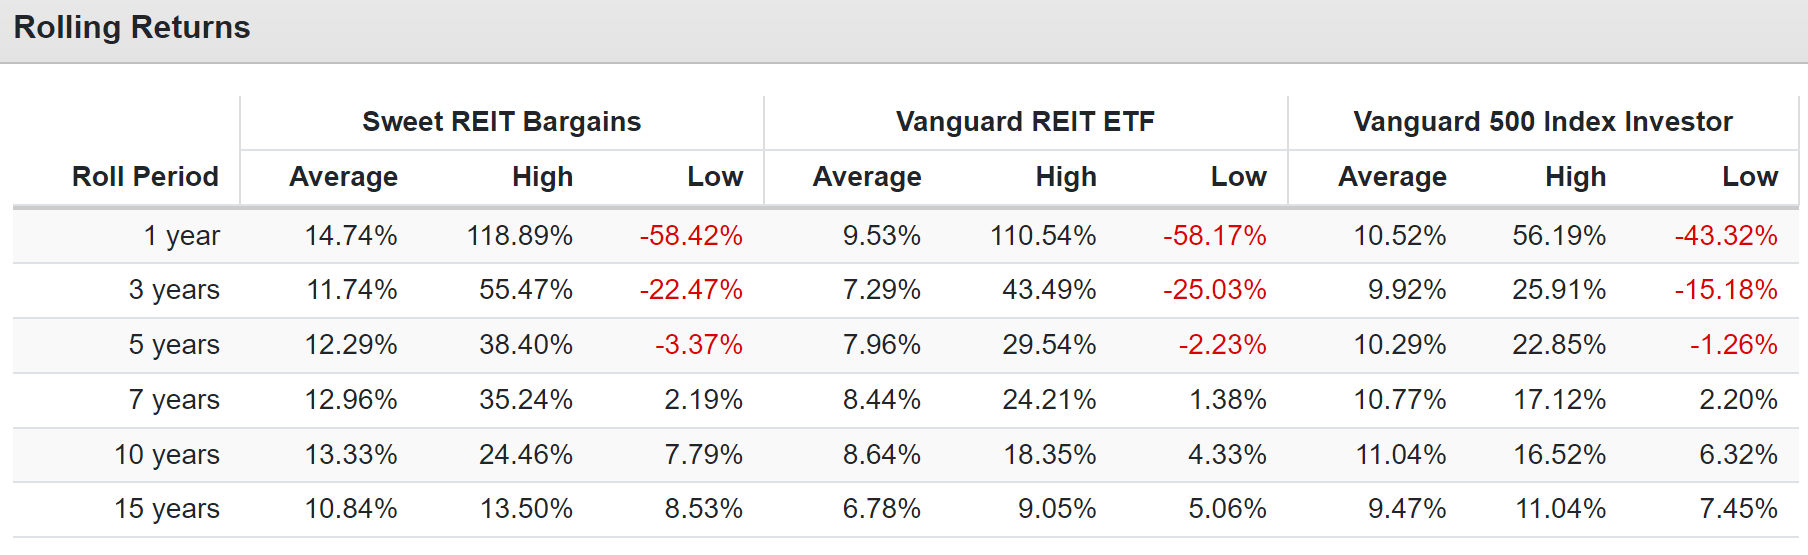
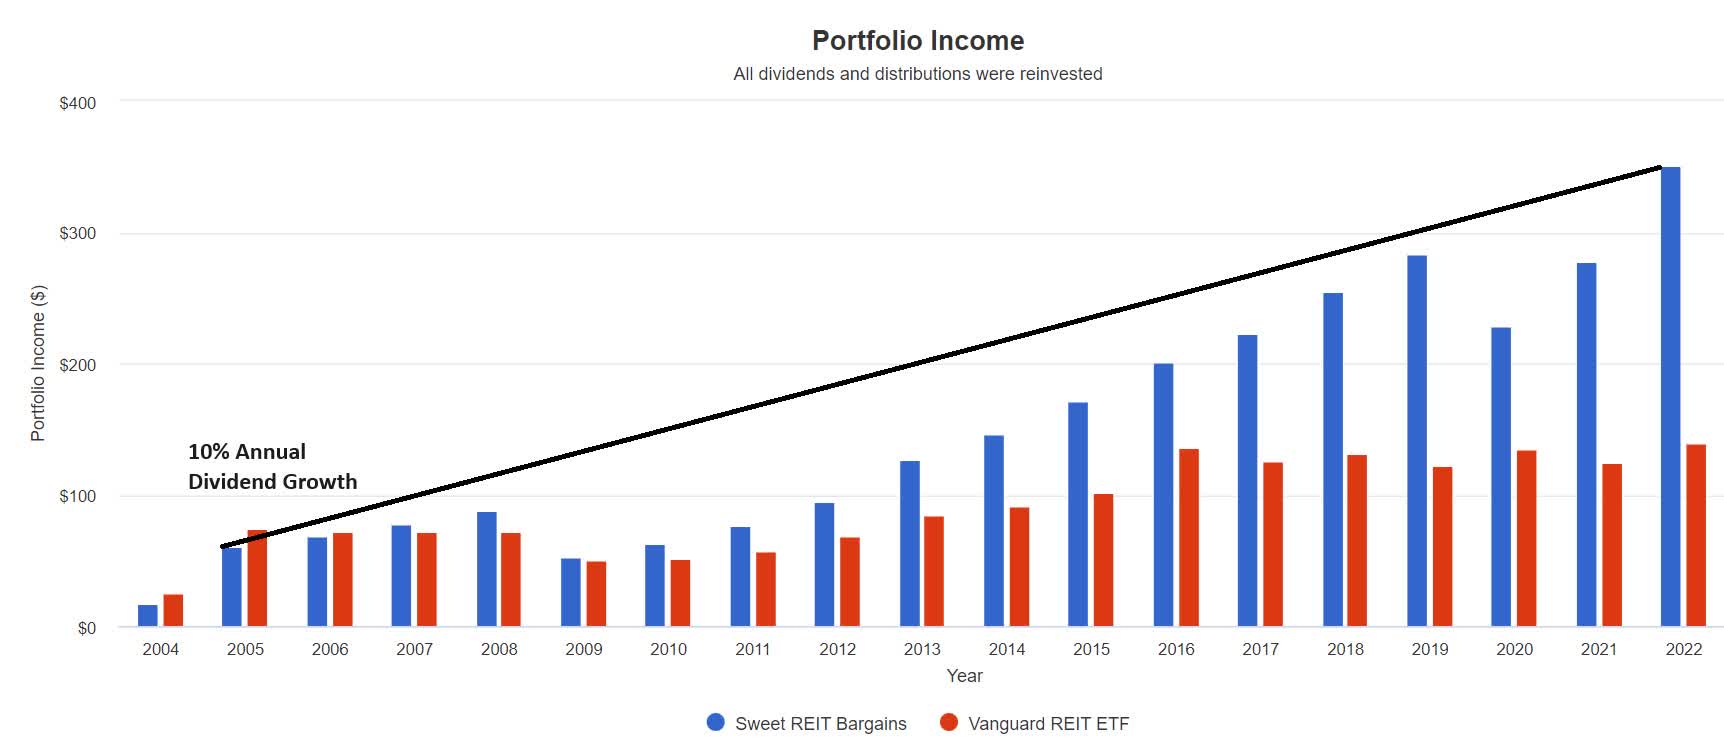
Historical Returns Since 2004
VNQ's dividend have grown at 4% annually since 2005 while these REITs have delivered 10% annual income growth.
- today's yield on cost:
- 4 Sweet REIT bargains: 35.1%
- VNQ: 13.9%
- future consensus income growth: 8% to 10%.
Consensus Total Return Potential Through 2025
- if and only if each company grows as analysts expect
- and returns to historical market-determined fair value
- this is what you will make
Simon Property Group
Realty Income
Extra Space Storage
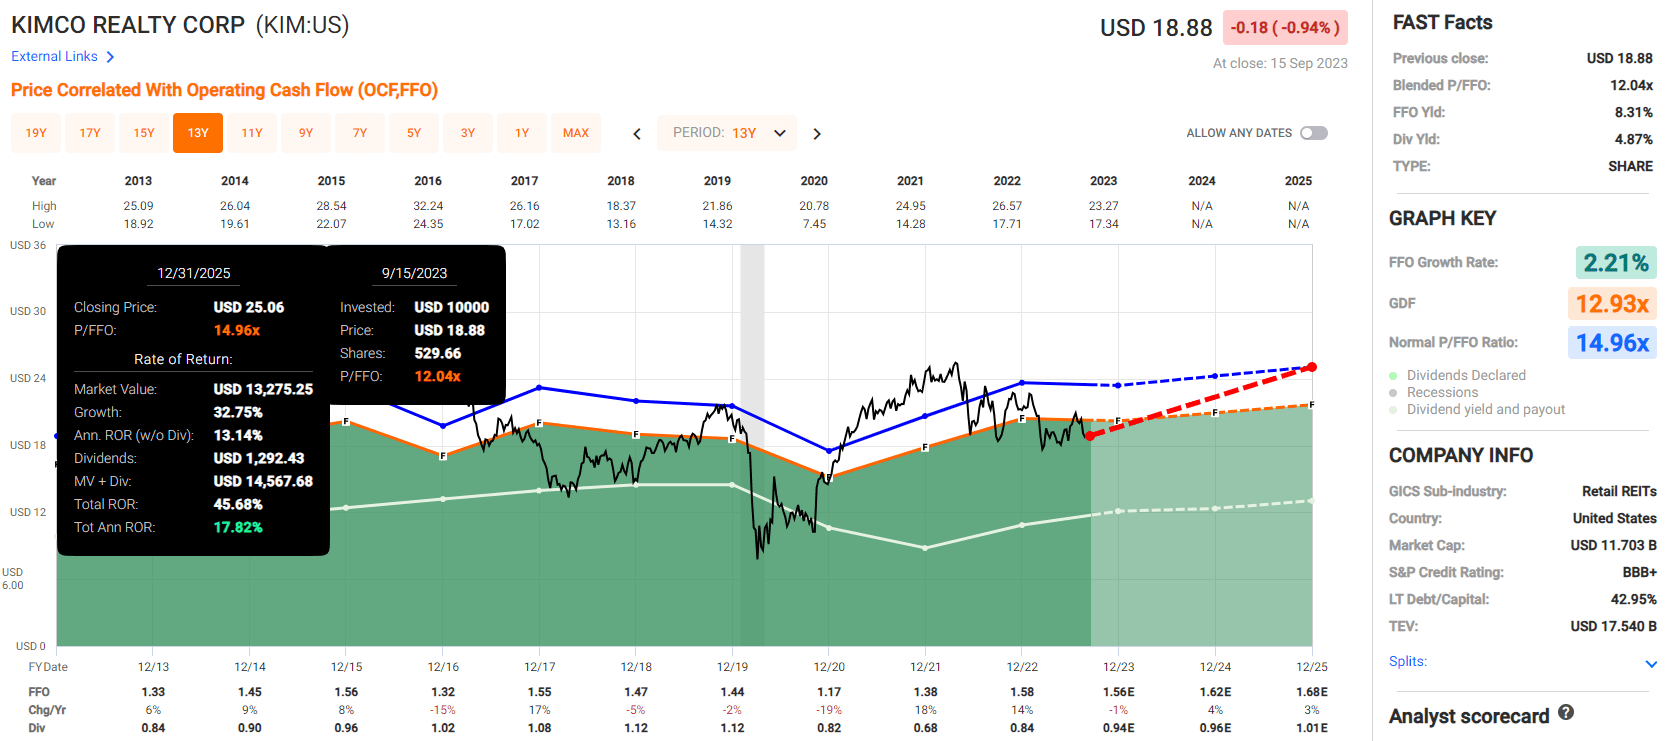
Kimco Realty
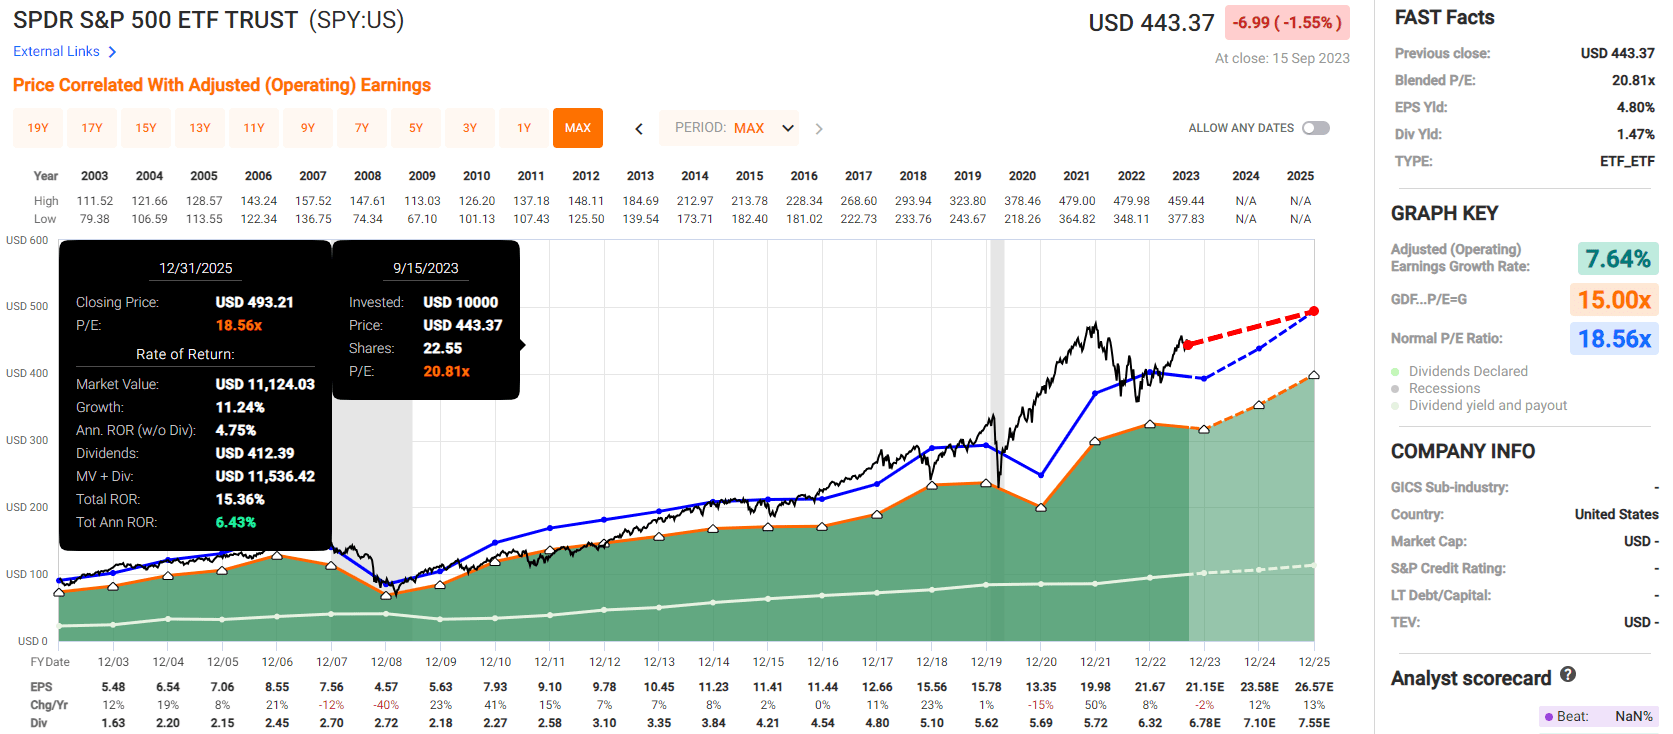
S&P 500
Bottom Line: It's The Best Time In 10 Years To Buy REIT So Consider These Sweet Bargains
The S&P is expected to deliver around 15% total returns by the end of 2025.
Each of these four 5+% yielding REIT blue-chips is expected to deliver 17% to 30% annual returns through 2025.
That is the power of combining very safe high-yield with strong balance sheets and the best valuations in years.
The REIT sector is now the most historically undervalued sector you can buy.
And SPG, O, EXR, and KIM are the top 5+% yielding REITs with decent to strong growth prospects I can recommend right now.
For further details see:
It's The Best Time In 10 Years To Buy These Sweet REIT Bargains