HOMZ - ITB: Why We Believe It's The Best Homebuilding ETF
2023-07-19 12:20:30 ET
Summary
- A rigorous regression analysis identified private residential construction investments and home price growth as the key drivers of the US Homebuilding subindustry.
- The top 10 Homebuilding companies in the US, however, were found to be driven more by company-specific factors rather than these industry-wide drivers.
- Our analysis suggests the top Homebuilding companies are likely to continue their outperformance, driven by M&A activities and potential industry consolidation.
We utilized our proprietary Quant Factor Score to determine the best investment areas in the home consumer market. The table below details the subindustries that are related to the home consumer market with their respective quantitative scores.
| Sector |
| Industry Group |
| Industry |
| Subindustry |
| Khaveen Investments Quant Factor Score (1 to 7)* |
| Average Historical Returns (6-year Average) |
| Consumer Discretionary |
| Consumer Discretionary & Distribution |
| Specialty Retail |
| Home Improvement Retail |
| 5 |
| 16.3% |
| Home furnishing Retail |
| 3 |
| 6.5% |
| Consumer Durables & Apparel |
| Household Durables |
| Homebuilding |
| 2 |
| 15.7% |
| Consumer Electronics |
| 2 |
| 7.5% |
| Household Appliances |
| 1 |
| -3.1% |
| Home Furnishings |
| 1 |
| -4.6% |
*The Khaveen Investments Quant Score is formulated by evaluating the historical return performances of each Subindustry factoring in outperformance and underperformance of returns relative to their corresponding Industry, Industry Group, and Sector.
Source: Company Data, Seeking Alpha, Khaveen Investments
Our table above shows the Home Improvement Retail industry with the highest Quant Factor Score of 5 followed by Home Furnishing Retail at 3, and Consumer Electronics and Homebuilding tied at 2. In terms of returns, Home Improvement Retail has the highest average returns followed by Homebuilding. Therefore, we believe the Home Improvement Retail subindustry is the best among home consumer-related subindustries with the highest Quant Factor Score of 5 and highest return followed by Homebuilding with a score of 3 and second highest average historical returns. However, we could not identify any ETFs that have a majority allocation to the Home Improvement Retail subindustry, thus we focus instead on Homebuilding ETFs such as ITB, XHB, HOMZ and PKB.
| ETF |
| Average Return (6-year) |
| Standard Deviation |
| Holdings |
| Risk-Adjusted Returns* |
| AUM ($ bln) |
| Average Spread (%) |
| Average Daily Volume ($ mln) |
| iShares U.S. Home Construction ETF ( ITB ) |
| 14.35% |
| 39.79% |
| 50 |
| 0.57740 |
| 2.45 |
| 0.02% |
| 183.66 |
| SPDR S&P Homebuilders ETF ( XHB ) |
| 10.35% |
| 34.27% |
| 36 |
| 0.43320 |
| 1.4 |
| 0.02% |
| 214.64 |
| Hoya Capital Housing ETF ( HOMZ ) |
| 6.44% |
| 28.56% |
| 103 |
| 0.38392 |
| 0.03811 |
| 0.27% |
| 0.08 |
| Invesco Dynamic Building & Construction ETF ( PKB ) |
| 6.69% |
| 30.80% |
| 32 |
| 0.28672 |
| 0.24653 |
| 0.16% |
| 1.51 |
*Based on our proprietary calculation of risk-adjusted returns factoring in diversification, concentration risk, and standard deviation of returns.
Source: ETF.com, Khaveen Investments
Based on the table above, we derived each ETF's historical risk-adjusted return and compiled their AUM and average spread. Our minimum requirements for investible ETFs are a minimum AUM of $0.5 bln and an average spread not lower than 0.2%. Thus, HOMZ and PKB are eliminated from our consideration with AUMs below $0.5 bln. Furthermore, both HOMZ and PKB have very low average daily volumes in comparison with ITB and XHB.
Between the remaining ETFs which are ITB and XHB, we derived a higher risk-adjusted return for ITB (0.5774) compared to XHB (0.4332). The higher score for ITB is due to the stronger performance with a higher average 6-year return (14.35%) compared to XHB (10.35%). Despite the higher standard deviation of returns, ITB still has a higher risk-adjusted return due to its higher return as well as lower diversification risk as ITB has more holding (50) compared to XHB (36) despite the higher concentration risk as the top 2 ITB holdings, which are DR Horton (DHI) (15.14%) and Lennar (LEN) (12.73%), have high concentration in the ETF representing above 10% weighting of the ETF but our proprietary risk-adjusted return calculations have accounted for the higher concentration risk of ITB by factoring the excess weighting on its risk. Thus, we believe that ITB edges out all the other ETFs.
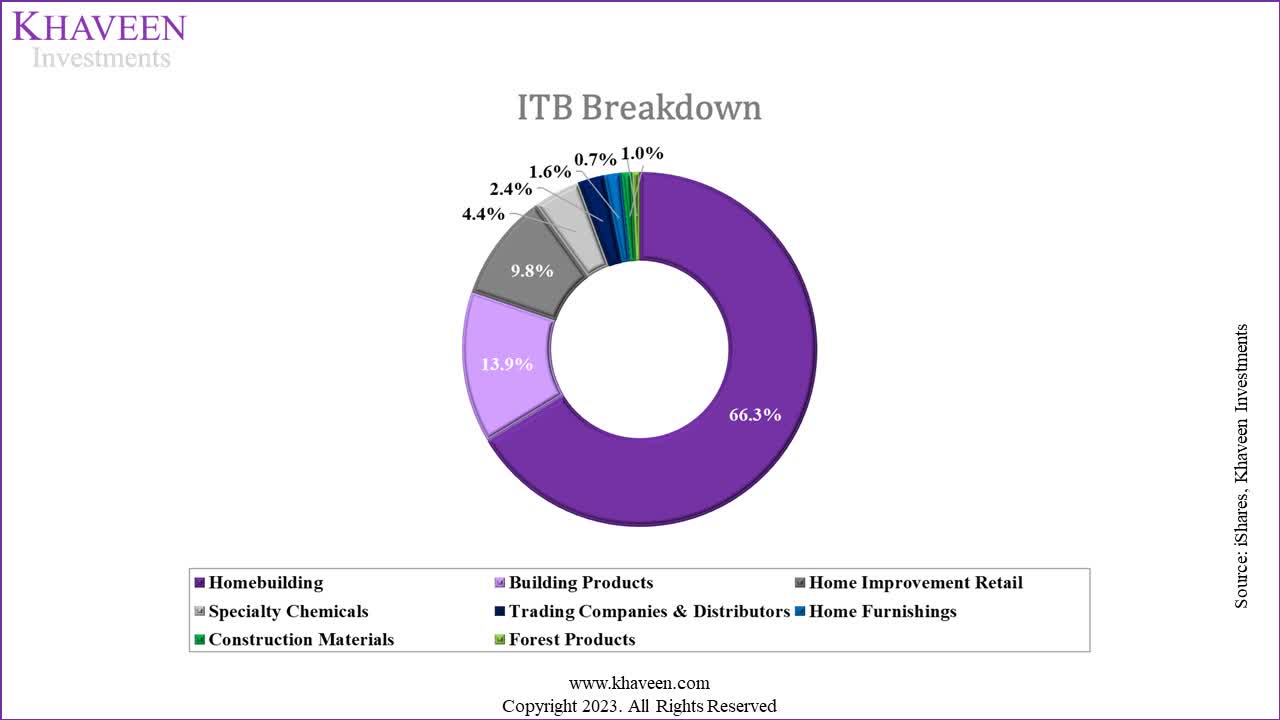
Based on our compiled breakdown of ITB by subindustries, the largest subindustry allocation is in Homebuilding. As such, we covered the Homebuilding subindustry with the aim to uncover the key factors that drive the success of the top Homebuilding companies in the US. To achieve this, we conducted a rigorous regression analysis, carefully scrutinizing several potential drivers. Our primary goal was to identify the significant factors responsible for the remarkable performance of these top Homebuilders which have been gaining market share.
Upon completing the regression analysis, we proceeded to investigate any distinctive company-specific attributes that might contribute to the outstanding performance of the top 10 Homebuilders in the US. By thoroughly assessing these individual factors, we gained valuable insights into the reasons behind their outperformance.
Possible Drivers of the US Homebuilding Subindustry
Firstly, we identified several factors which could be possible drivers of the US Homebuilding subindustry including mortgage rates, private residential construction investments, new home sales, prices of homes, employment, population, GDP, income growth, consumer confidence, availability of credit and homeownership rates.
Mortgage Rates
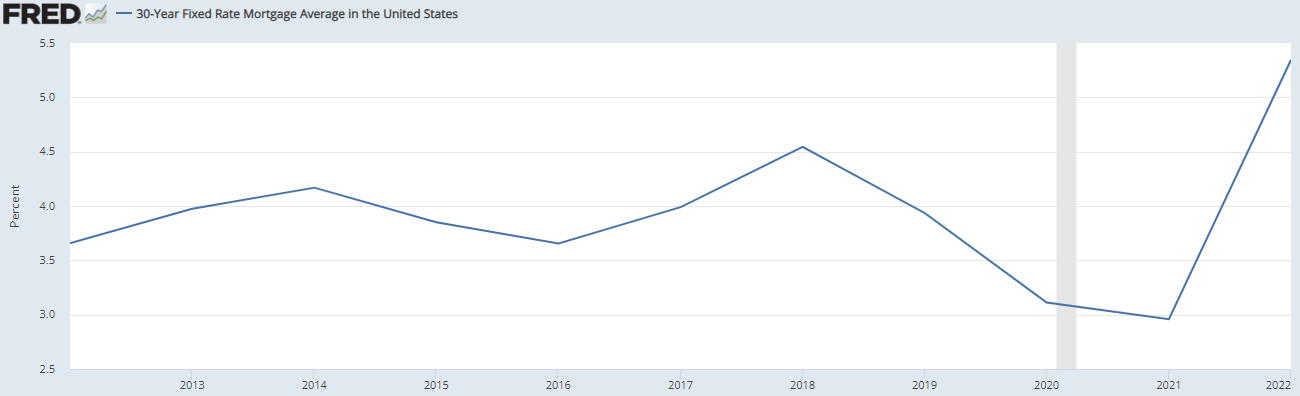
Based on the 30-Year Fixed Rate Mortgage Average in the US by Freddie Mac from FRED , mortgage rates had been fairly stable between 2013 to 2019 but decreased sharply in 2020 and 2021 as the US Fed cut rates. According to Mordor Intelligence, mortgage rates declined to record lows after "the federal funds rate target was lowered to near zero" in 2020. In 2022, mortgage rates had increased to the highest in the past 10 years.
According to DR Horton, the largest homebuilder in the US, the company :
began to see a moderation in housing demand that persisted through the end of our fiscal year as mortgage interest rates increased substantially and inflationary pressures remained elevated.
Furthermore, according to NVR, "the housing industry is cyclical and is affected by consumer confidence levels, prevailing economic conditions and interest rates".
Residential Private Construction Spending
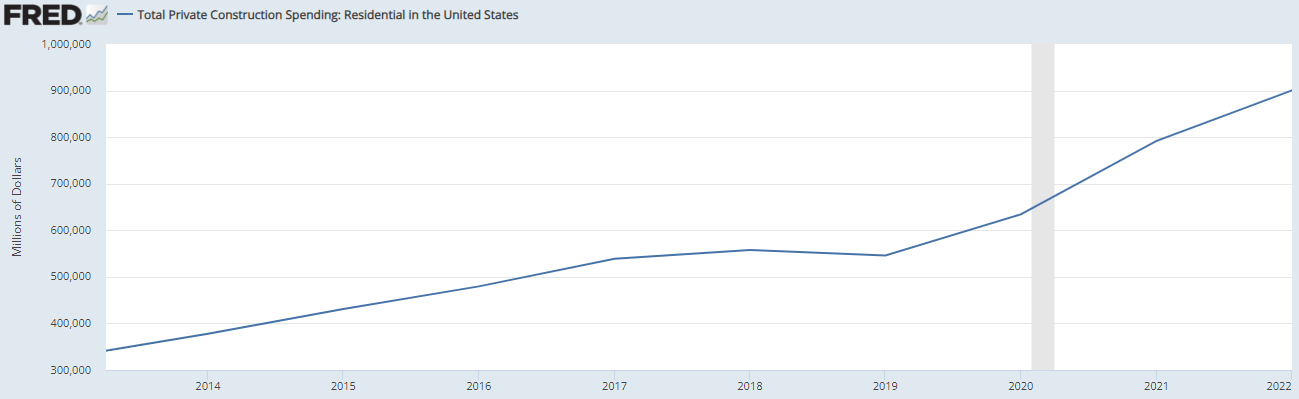
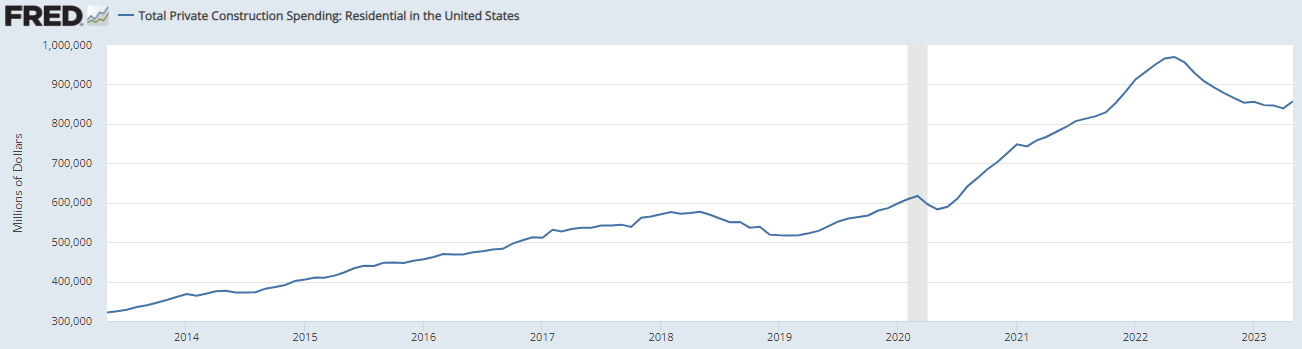
According to Mordor Intelligence , "the residential market rebounded exceptionally rapidly, with the value of residential construction investment surpassing pre-pandemic levels before the end of the year 2020".
Based on the US Census Bureau , US private-sector construction spending has increased over the past 10 years. It only dipped in 2019 but was followed by a surge from 2020 and continued to grow strongly at an average of 12.1% over the period.
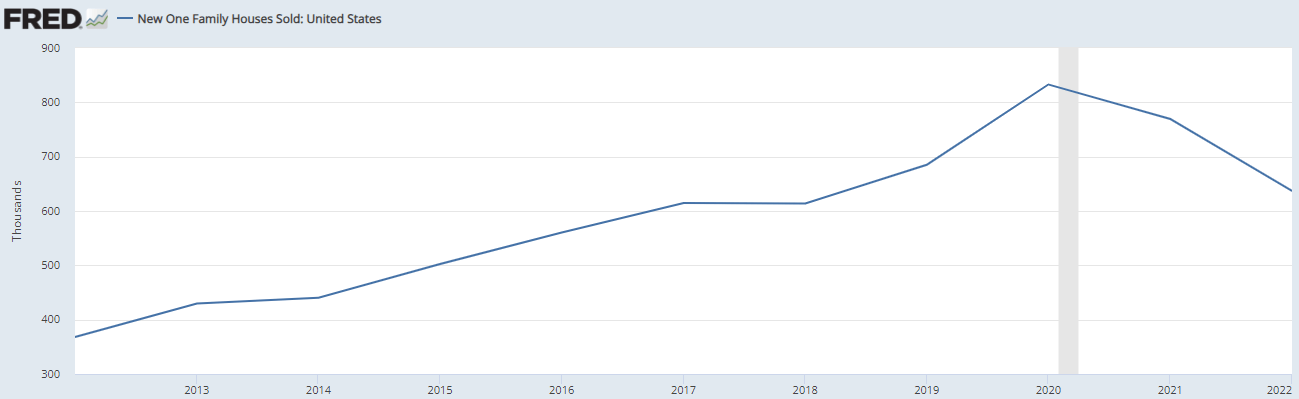
New Home Sales
U.S. Department of Housing and Urban Development, FRED
Based on the chart above, the sale of new homes in the US has increased over the past 10 years but peaked in 2020 and started to decline in 2021 and 2022. According to MarketResearch.com , construction accelerated "in 2020 as the COVID-19 pandemic created demand for housing in areas away from crowded cities and homebound workers decided to invest in home improvement projects". Over the past 10 years, the new unit homes sold grew at an average of 5.1%.
Rising Prices of Homes
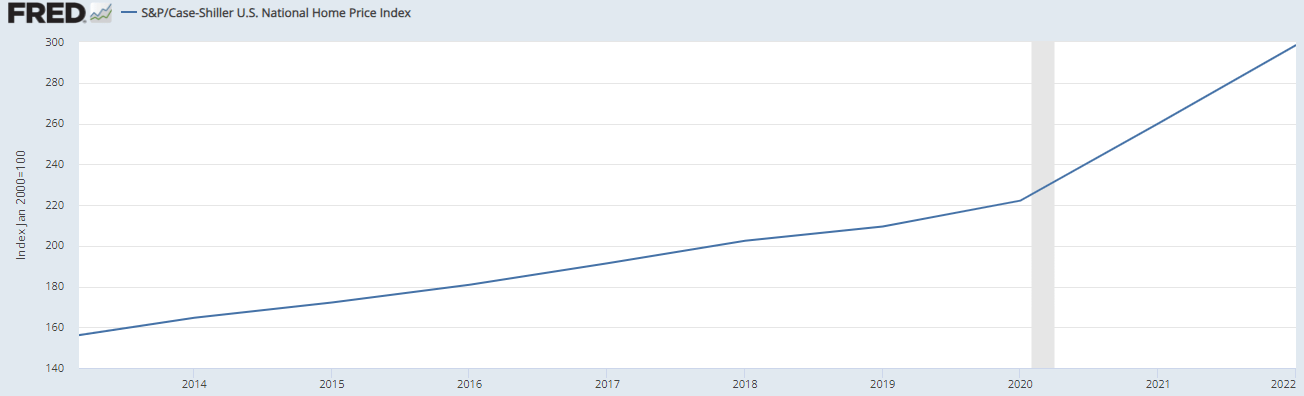
According to DR Horton, the Homebuilding industries "are cyclical and are significantly affected by changes in general and local economic and real estate conditions" which include the prices of new homes. The chart above shows the S&P CoreLogic Case-Shiller U.S. National Home Price NSA Index, which "measures the change in the value of the U.S. residential housing market by tracking the purchase prices of single-family homes". It increased sharply in 2021 and 2022 which indicates home prices rose significantly during the period and has an average growth of 7.7% in the past 10 years.
Employment Levels
U.S. Bureau of Labor Statistics, FRED
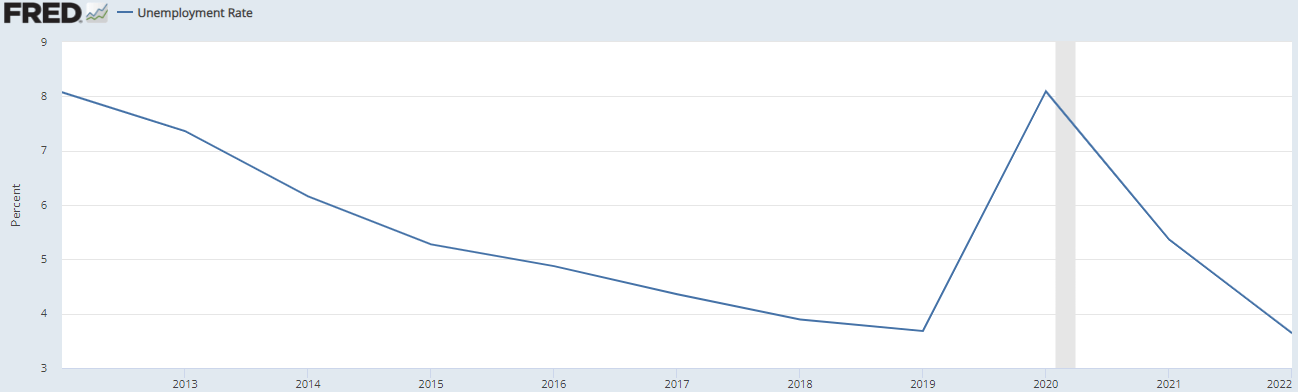
According to NVR, the "demand for new homes is sensitive to economic changes" including employment levels and job growth. In the past 10 years, the US unemployment rate had been on a decreasing trend despite a surge in 2020 during the COVID-19 pandemic. However, the unemployment rate has since fallen since the spike in 2020 to 3% in 2022.
Population Growth
U.S. Bureau of Economic Analysis, FRED
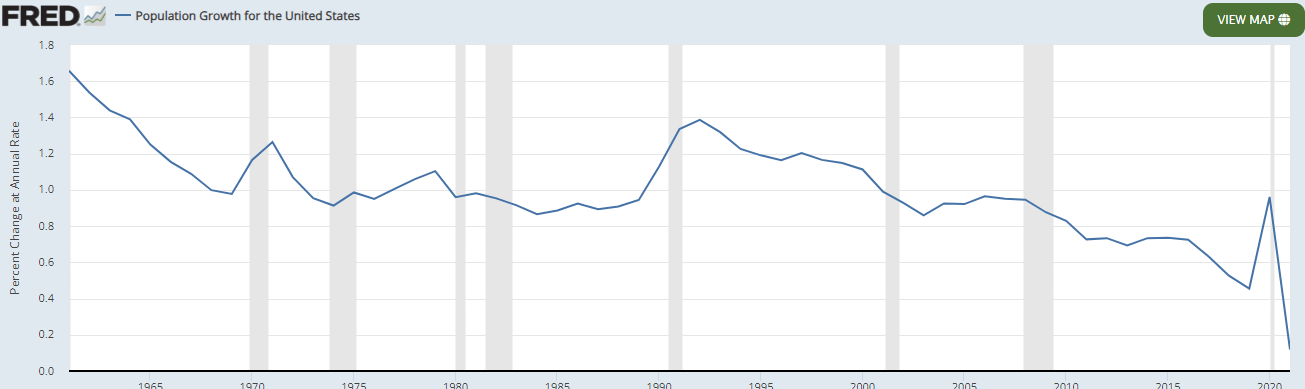
Source: U.S. Bureau of Economic Analysis, FRED
Based on DR Horton's annual report, one of the stated factors that affect the Homebuilding subindustry is demographic trends. According to Raymond Search Group , "the need for housing continues to be strong in the US. It is due to increased population, immigration rates…". In the chart above, we examine the US population growth in the past 10 years by the U.S. Bureau of Economic Analysis which has been flattish at an average growth rate of only 0.63%.
GDP Growth
U.S. Bureau of Economic Analysis, FRED
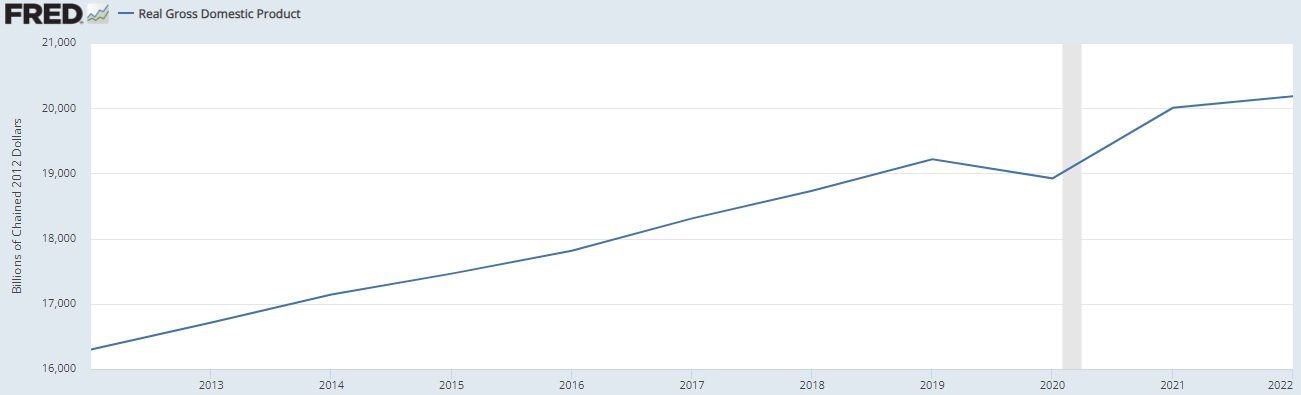
According to Toll Brothers…
Adverse changes in economic conditions in markets where we conduct our operations and where prospective purchasers of our homes live have had and may in the future have a negative impact on our business. - Toll Brothers' Annual Report 2022
Furthermore, based on Mordor Intelligence, US homebuilders benefited from positive economic conditions in the US. Thus, we examine US real GDP growth in the chart above, which grew positively despite the recession in 2020 at an average of 2.1% in the past 10 years.
Real Income Growth
U.S. Bureau of Economic Analysis, FRED
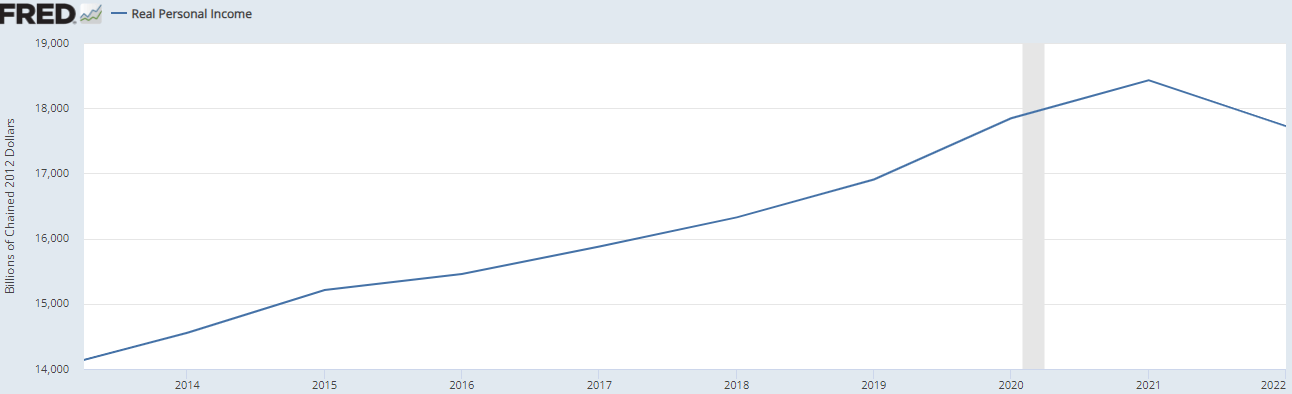
According to DR Horton, the homebuilding industries "are cyclical and are significantly affected by changes in general and local economic and real estate conditions" which include consumer confidence and spending. Thus, we examine real income growth in the US as a possible factor to explain homebuilders' growth. Based on the chart, the US average real income has grown continuously except in 2022 with an average growth rate of 2.3% in the past 10 years.
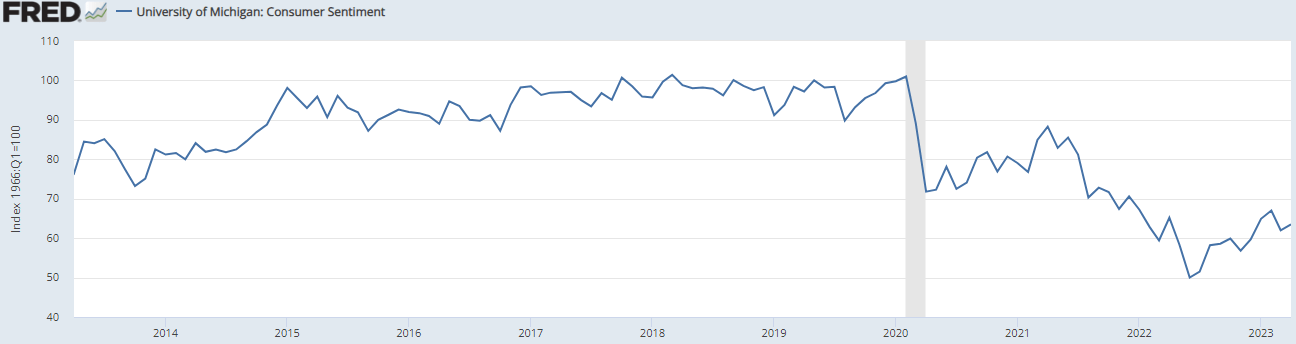
Consumer Confidence
According to NVR's annual report, the "demand for new homes is sensitive to economic changes driven by conditions such as employment levels, job growth, consumer confidence, inflation and interest rates".
Furthermore, according to Toll Brothers' annual report, changes in "consumer confidence, perceptions regarding the strength of the housing market…may reduce demand…". Thus, this highlights that consumer confidence could be a factor in the homebuilders' growth. Based on the chart, consumer confidence based on the University of Michigan has been affected following the recession in 2020 and has not recovered to pre-pandemic levels.
Availability of Credit
Federal Reserve Bank of Philadelphia, FRED
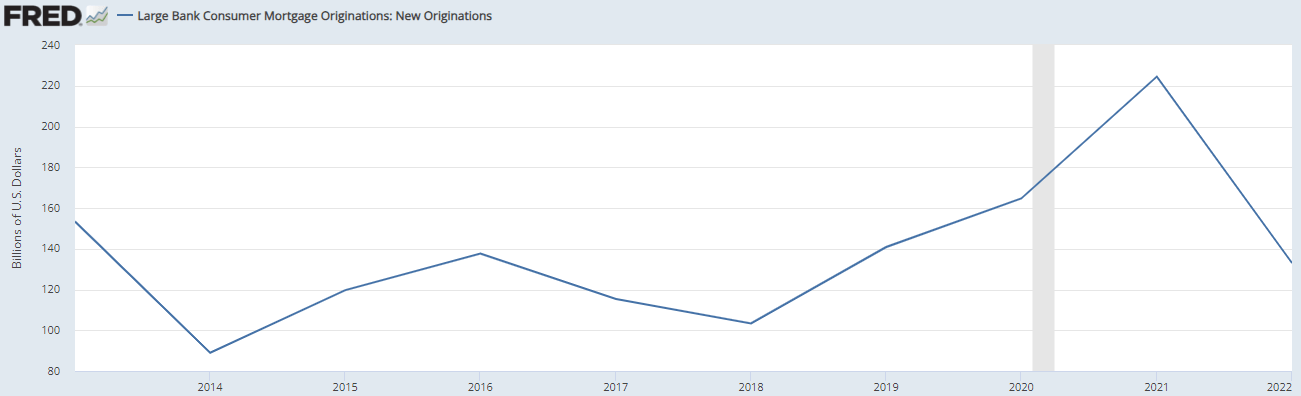
According to DR Horton's annual report, the homebuilding industries "are cyclical and are significantly affected by changes in general and local economic and real estate conditions" which include the availability of credit. Similarly, based on Toll Brothers' annual report, demand for homebuilding is affected by the "availability of financing for homebuyers". The chart above shows the mortgage loan originations in the US by large banks which has increased in 2021 but moderated down in 2022. Over the past 10 years, loan originations have been volatile with an average growth of 3.3%.
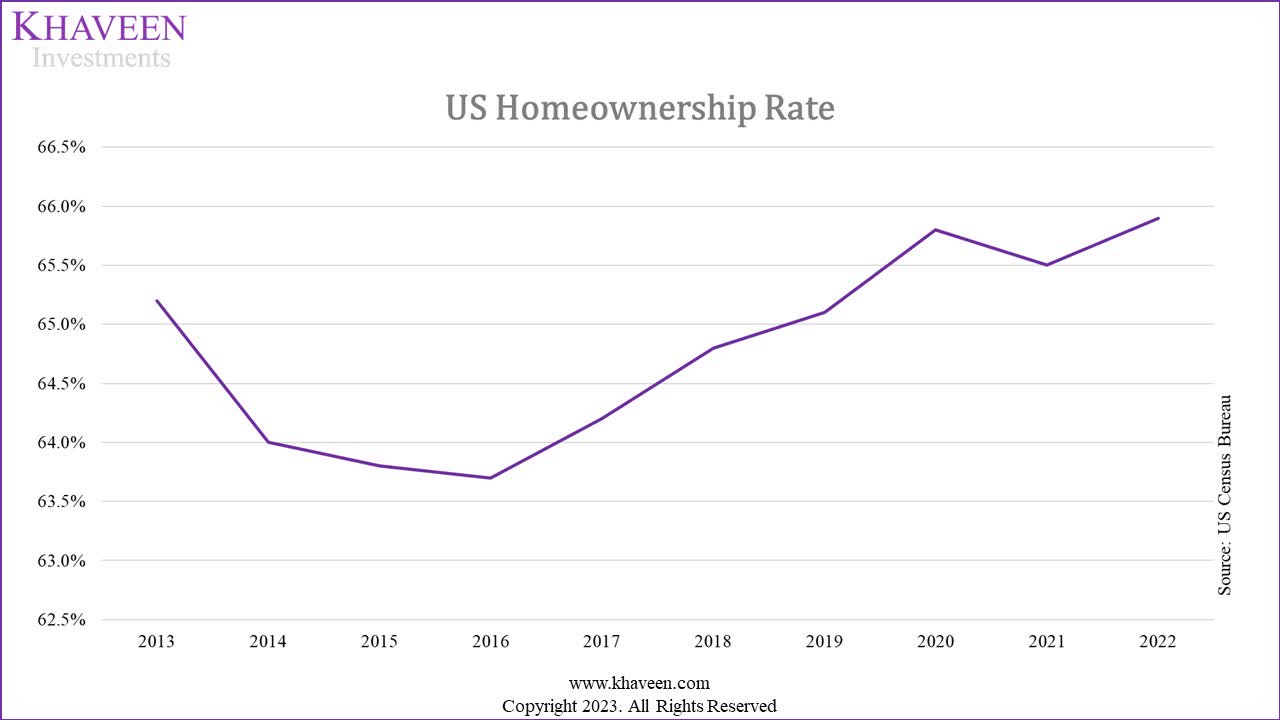
Home Ownership Rate
US Census Bureau, Khaveen Investments
Based on the chart, the US homeownership rate based on the US Census Bureau had been decreasing from 2013 to 2016. However, ownership had bottomed out in 2016 and had been on a strong rising trend to 65.9% in 2022. According to Jefferies , "millennial demand is intensifying the starter-home shortage that existed even before the pandemic".
Overall, we identified the possible factors which we believe could be the drivers of the US Homebuilding subindustry including mortgage rates, private residential construction investments, new home sales, prices of homes, employment, population, GDP, income growth, consumer confidence, availability of credit and homeownership rates. However, to determine whether these are the subindustry drivers, we conducted a regression analysis at the next point.
Determining the Actual Drivers
Total Homebuilders Subindustry Drivers
Furthermore, in this section, we determine the drivers of the top Homebuilding companies based on regression analysis. Firstly, our hypothesis is that there exists a relationship between each of the independent variables including housing starts, house prices, mortgage rates, new units sold, real income growth, real GDP growth, population growth, consumer confidence construction spending (residential private), home ownership, loan originations and unemployment and the dependent variable which is the total Homebuilding subindustry which we based on the residential construction industry by FMI Corporation over a 9-year period. The null hypothesis is that there is no relationship between each of the independent variables and the total Homebuilding subindustry. Our decision rule is based on a 90% confidence interval or a 10% significance level, the null hypothesis is rejected if the p-value is below 0.1. The results obtained are shown in the table below:
| Independent Variable |
| Average |
| Correlation |
| Coefficients |
| P-Value |
| R Square |
| Housing Starts Growth |
| 6.0% |
| 0.5821 |
| 0.85 |
| 0.1001 |
| 0.34 |
| House Prices Growth |
| 7.7% |
| 0.6090 |
| 0.98 |
| 0.0817 |
| 0.37 |
| Mortgage Rates |
| 4.0% |
| -0.4299 |
| -4.63 |
| 0.2481 |
| 0.18 |
| New Units Sold Growth |
| 5.1% |
| -0.1712 |
| -0.11 |
| 0.6596 |
| 0.03 |
| Real Income Growth |
| 2.3% |
| -0.0587 |
| -0.13 |
| 0.8807 |
| 0.00 |
| Real GDP Growth |
| 2.1% |
| 0.1685 |
| 0.69 |
| 0.6647 |
| 0.03 |
| Population Growth |
| 0.6% |
| -0.2595 |
| -9.24 |
| 0.5001 |
| 0.07 |
| Consumer Confidence |
| 86.5 |
| -0.4887 |
| 0.00 |
| 0.1819 |
| 0.24 |
| Construction Spending (Residential Private) Growth |
| 12.1% |
| 0.9898 |
| 0.996 |
| 0.0000003 |
| 0.98 |
| Home Ownership Rate |
| 64.8% |
| 0.0986 |
| 0.88 |
| 0.8007 |
| 0.01 |
| Loan Originations Growth |
| 3.3% |
| 0.0680 |
| 0.02 |
| 0.8619 |
| 0.00 |
| Unemployment |
| 5.1% |
| 0.5407 |
| 2.91 |
| 0.1328 |
| 0.29 |
Source: Khaveen Investments
Based on the table, all of the independent variables tested have a p-value greater than 0.1 except for House Prices Growth and Construction Spending (Residential Private) Growth. Thus, the null hypothesis is not rejected, and we concluded that there is no significant relationship between housing starts, mortgage rates, new units sold, real income growth, real GDP growth, population growth, consumer confidence, home ownership, loan originations and unemployment with the total Homebuilding subindustry.
For Construction Spending (Residential Private), we obtained a p-value of 0.0000003 which is below 0.1, thus the null hypothesis is rejected and we concluded that there is a significant relationship between Construction Spending (Residential Private) and the total Homebuilding companies. The coefficient from the regression results is 0.996 which suggests a positive relationship, this is also seen with its correlation coefficient of 0.9898, highlighting a very strong positive relationship between the variables. In addition, the R square is 0.98 which implies that 98% of the variation is explained by the variable. Overall, we believe Construction Spending (Residential Private) to be one of the Homebuilding subindustry drivers.
Furthermore, for House Prices Growth, we obtained a p-value of 0.0817 which is less than 0.1, thus the null hypothesis is rejected and we concluded that there is a statistically significant relationship between house prices and the Homebuilding subindustry. Though, the R square is only 0.37, implying only 37% of the variation in the Homebuilding subindustry is explained by house prices. From the previous point, house prices increased by an average of 7.7% which is lower than the total Homebuilding subindustry growth of 12.2%, thus it is not the only factor that explains its growth. Thus, besides Construction Spending (Residential Private), we believe House Prices growth to also be one of the drivers of the Homebuilding industry.
In terms of the correlation coefficient for the rest of the variables, housing starts, house prices, real GDP growth, home ownership, loan originations and unemployment have positive values which indicate a positive relationship with the total Homebuilding subindustry. However, we believe these are not the drivers of the subindustry as our regression results indicate no significant relationship with the total Homebuilding subindustry and our only driver identified is Construction Spending (Residential Private).
Top Homebuilders Drivers
We compiled the top 10 Homebuilders in the US in the past 10 years based on revenues which exhibited strong growth in 2022 at 20.7% and an average of 17.1% in the past 10 years compared to the total industry growth at an average of 12.2%.
| Top US Homebuilding Companies |
| 2014 |
| 2015 |
| 2016 |
| 2017 |
| 2018 |
| 2019 |
| 2020 |
| 2021 |
| 2022 |
| DR Horton |
| 7,859 |
| 10,559 |
| 11,862 |
| 13,742 |
| 15,693 |
| 17,151 |
| 19,726 |
| 26,951 |
| 32,685 |
| Lennar |
| 7,325 |
| 8,854 |
| 10,263 |
| 11,754 |
| 19,617 |
| 21,435 |
| 21,599 |
| 26,232 |
| 32,861 |
| NVR ( NVR ) |
| 4,375 |
| 5,065 |
| 5,709 |
| 6,176 |
| 7,004 |
| 7,221 |
| 7,329 |
| 8,702 |
| 10,327 |
| PulteGroup ( PHM ) |
| 5,697 |
| 5,841 |
| 7,495 |
| 8,386 |
| 9,983 |
| 9,979 |
| 10,674 |
| 13,537 |
| 15,917 |
| Toll Brothers ( TOL ) |
| 3,912 |
| 4,171 |
| 5,170 |
| 5,815 |
| 7,143 |
| 7,224 |
| 7,078 |
| 8,790 |
| 10,276 |
| TopBuild Corp ( BLD ) |
| 1,512 |
| 1,617 |
| 1,743 |
| 1,906 |
| 2,384 |
| 2,624 |
| 2,718 |
| 3,486 |
| 5,009 |
| Taylor Morrison ( TMHC ) |
| 2,708 |
| 2,977 |
| 3,550 |
| 3,816 |
| 4,160 |
| 4,669 |
| 5,974 |
| 7,337 |
| 8,089 |
| Meritage Homes Corporation ( MTH ) |
| 2,170 |
| 2,568 |
| 3,029 |
| 3,227 |
| 3,513 |
| 3,651 |
| 4,482 |
| 5,120 |
| 6,269 |
| KB Home ( KBH ) |
| 2,401 |
| 3,032 |
| 3,595 |
| 4,369 |
| 4,547 |
| 4,553 |
| 4,183 |
| 5,725 |
| 6,904 |
| Tri Pointe Homes ( TPH ) |
| 1,694 |
| 2,393 |
| 2,402 |
| 2,807 |
| 3,253 |
| 3,077 |
| 3,249 |
| 3,968 |
| 4,297 |
| Total |
| 39,652 |
| 47,076 |
| 54,817 |
| 61,996 |
| 77,297 |
| 81,582 |
| 87,011 |
| 109,848 |
| 132,633 |
| Growth % |
| 22.2% |
| 18.7% |
| 16.4% |
| 13.1% |
| 24.7% |
| 5.5% |
| 6.7% |
| 26.2% |
| 20.7% |
Source: Company Data, Khaveen Investments
Furthermore, we then look at the top 10 companies in the Homebuilding subindustry based on regression analysis. Our hypothesis is that there exists a relationship between each of the independent variables including housing starts, house prices, mortgage rates, new units sold, real income growth, real GDP growth, population growth, consumer confidence construction spending (residential private), home ownership, loan originations and unemployment and the dependent variable which is the top Homebuilding companies' revenue growth over a 9-year period. We define the null hypothesis that there is no relationship between each of the independent variables and the top Homebuilding companies' revenue growth. The results obtained are shown in the table below:
| Independent Variable |
| Correlation |
| Coefficients |
| P-Value |
| R Square |
| Housing Starts |
| 0.21 |
| 0.29 |
| 0.59 |
| 0.04 |
| House Prices |
| 0.57 |
| 0.88 |
| 0.11 |
| 0.32 |
| Mortgage Rates |
| 0.24 |
| 2.52 |
| 0.53 |
| 0.06 |
| New Units Sold |
| -0.71 |
| -0.44 |
| 0.03 |
| 0.50 |
| Real Income Growth % |
| -0.35 |
| -0.76 |
| 0.35 |
| 0.12 |
| Real GDP |
| 0.55 |
| 2.16 |
| 0.13 |
| 0.30 |
| Population |
| 0.16 |
| 5.44 |
| 0.68 |
| 0.03 |
| Consumer Confidence |
| -0.26 |
| 0.00 |
| 0.50 |
| 0.07 |
| Construction Spending (Residential Private) |
| 0.41 |
| 0.40 |
| 0.27 |
| 0.17 |
| Home Ownership |
| -0.12 |
| -1.01 |
| 0.76 |
| 0.01 |
| Loan Originations |
| -0.26 |
| -0.07 |
| 0.49 |
| 0.07 |
| Unemployment |
| -0.21 |
| -1.10 |
| 0.58 |
| 0.04 |
Source: Khaveen Investments
Based on the table, all of the independent variables tested have a p-value greater than 0.1 except for new units sold. Thus, the null hypothesis is not rejected, and we concluded that there is no significant relationship between housing starts, house prices, mortgage rates, real income growth, real GDP growth, population growth, consumer confidence, construction spending (residential private), home ownership, loan originations and unemployment with the top Homebuilding companies' revenue growth.
For new units sold, we obtained a p-value of 0.03 which is below 0.1, thus the null hypothesis is rejected. As such, we concluded that there is a significant relationship between new units sold and the top Homebuilding companies' revenue growth. However, the coefficient is negative at -0.44, implying an inverse relationship. This is also seen with the correlation coefficient of -0.71. Thus, we believe new units sold are not actually a driver of the top Homebuilding companies. In addition, a limitation with the test shows its R square at only 0.50, which implies that only 50% of the variation in the top Homebuilding companies' revenue growth is explained by the new units sold variable.
In terms of the correlation coefficient for the rest of the variables, housing starts, house prices, mortgage rates, real GDP growth, population growth, and construction spending (residential private) have positive values which indicate a positive relationship with the top Homebuilding companies. However, as our regression results concluded no significant relationship between these variables and the top Homebuilding companies, we believe that overall, the growth of the top Homebuilding companies is not driven by any of these factors and we further examine the growth of the top Homebuilding companies in the next point below.
All in all, based on regression analysis, we believe both Construction Spending (Residential Private) and House Prices growth are drivers of the Homebuilding subindustry. In addition, we looked at the top 10 companies in the Homebuilding subindustry and found that none of the variables are drivers of the top companies growth. Thus, we believe the top companies' solid performance compared to the total subindustry growth could be due to company-specific factors which we then examine below.
Stellar Performances of Top Players
From the previous point, we determined that there are no subindustry-specific drivers based on our regression analysis. Thus, we examine and identify possible reasons for the outperformance of the top Homebuilding companies' growth compared to the total subindustry. First, we compiled and examine the market share of the top Homebuilders.
Market Share
Company Data, FMI, Khaveen Investments
| Top Home Builders Market Share |
| 2013 |
| 2014 |
| 2015 |
| 2016 |
| 2017 |
| 2018 |
| 2019 |
| 2020 |
| 2021 |
| 2022 |
| Top 2 Companies |
| 3.5% |
| 4.1% |
| 4.4% |
| 4.6% |
| 4.7% |
| 6.3% |
| 7.0% |
| 6.4% |
| 6.6% |
| 7.2% |
| Bottom 8 of Top 10 Companies |
| 6.3% |
| 6.5% |
| 6.3% |
| 6.7% |
| 6.7% |
| 7.4% |
| 7.8% |
| 7.1% |
| 7.1% |
| 7.4% |
| Top 10 Companies |
| 9.9% |
| 10.6% |
| 10.7% |
| 11.3% |
| 11.4% |
| 13.7% |
| 14.7% |
| 13.5% |
| 13.7% |
| 14.6% |
| Others |
| 90.1% |
| 89.4% |
| 89.3% |
| 88.7% |
| 88.6% |
| 86.3% |
| 85.3% |
| 86.5% |
| 86.3% |
| 85.4% |
| Total |
| 100% |
| 100% |
| 100% |
| 100% |
| 100% |
| 100% |
| 100% |
| 100% |
| 100% |
| 100% |
Source: Company Data, FMI, Khaveen Investments
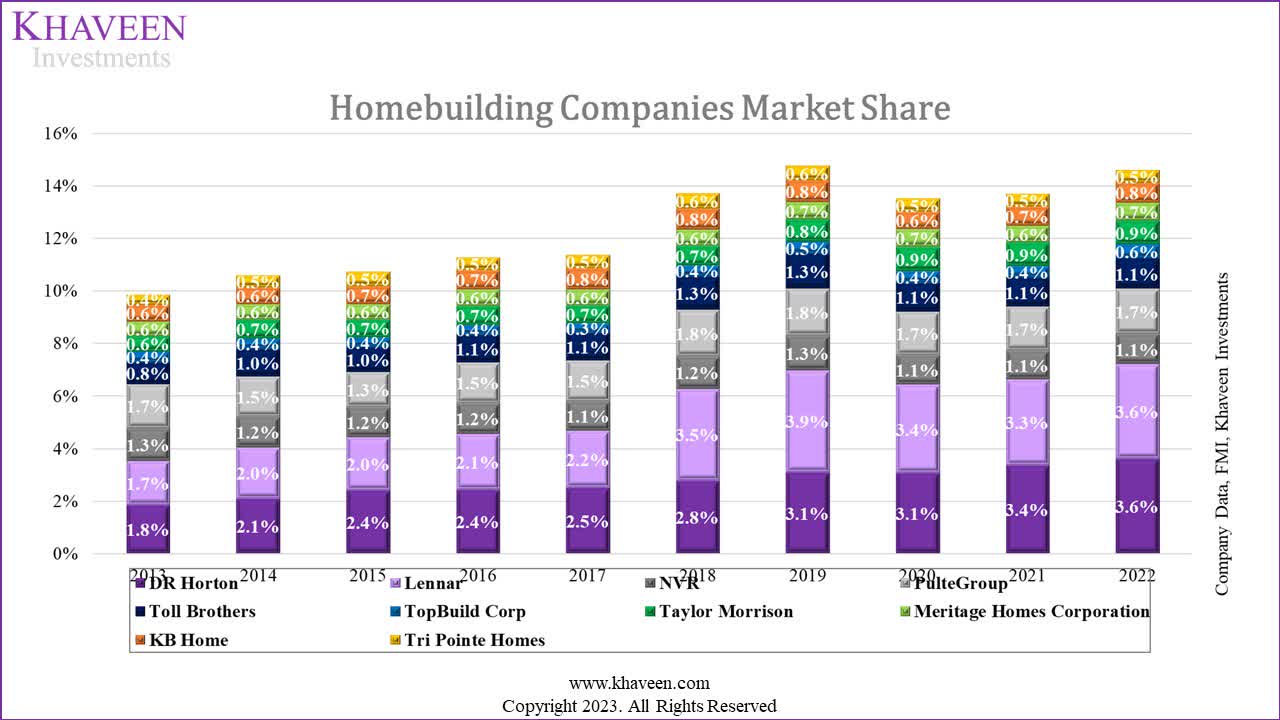
Based on the chart above of the top 10 Homebuilding companies' market share, the total market share of the top 10 companies has increased over the period which is unsurprising as we identified that the top Homebuilding companies' growth has outperformed the total subindustry growth.
The top 10 companies' share increased from 9.9% in 2013 to 14.6% in 2022 combined, a 4.7% increase over the period. However, it's worth highlighting that out of the top 10 Homebuilders, two companies were the leading performers, which are DR Horton and Lennar. Dr Horton's share doubled from 1.8% in 2013 to 3.6% in 2022.
Whereas Lennar's share increased from 1.7% to 3.6% in the period. The rest of the companies in the top 10 also saw their market share increase except for NVR. The bottom 8 of the top 10 companies' combined share increased from 6.3% to 7.4% combined. The companies which had the highest increase were Taylor Morrison and Toll Brothers by 3% over the period.
On the other hand, the combined share of the Others (non-top 10 companies) declined from 90.1% to 85.4% in 2022 but remains high and we believe could provide opportunities for the top 10 companies to capture more market share further.
Acquisitions
To determine whether the top companies' growth has been supported by M&A activities, we examined their past acquisitions.
| Companies |
| Average Revenue Growth (9-yrs) |
| Number of Acquisitions |
| DR Horton |
| 20.9% |
| 5 |
| Lennar |
| 23.1% |
| 2 |
| NVR |
| 10.9% |
| 0 |
| PulteGroup |
| 12.9% |
| 2 |
| Toll Brothers |
| 16.9% |
| 6 |
| TopBuild Corp |
| 15.8% |
| 20 |
| Taylor Morrison |
| 17.8% |
| 2 |
| Meritage Homes Corporation |
| 15.0% |
| 1 |
| KB Home |
| 14.9% |
| 0 |
| Tri Pointe Homes |
| 15.4% |
| 1 |
Source: Company Data, Khaveen Investments
For DR Horton, the company made 5 acquisitions in the past 10 years, it acquired Pacific Ridge Homes in 2015 with an estimated revenue of $5.6 mln, Wilson Parker Homes in 2016 with revenues of $201 mln and Teramo Homes (~$95 mln in revenues ), Classic Builders ($41.9 mln in revenues ), and Westport Homes in 2018 ($88.2 mln in revenues ). Overall, the total revenues contributed from these acquisitions are $230.7 mln which is only 0.7% of the company's total revenues.
However, Lennar only made two acquisitions which were WCI Communities ($563.6 mln in revenues ) in 2017 and CalAtlantic Homes ($6.476 bln in revenues ) in 2018. Its major acquisition is CalAtlantic Homes which represented 41% of its 2018 revenues. As seen in the chart, Lennar's share surged in 2018 following its acquisition of CalAtlantic to 3.5%. Its market share in 2022 remained flat at 3.6%. Therefore, we believe the strong performance of Lennar was due to acquisitions but not DR Horton.
Besides that, Taylor Morrison made 2 acquisitions including William Lyon Homes in 2019 with revenues of $2.1 bln (35% of total revenue in 2020). PulteGroup also made 2 acquisitions including assets from American West ($50 mln in revenue ) and John Wieland Homes and Neighborhoods ($21.6 mln in revenue ). Toll Brothers made 6 acquisitions including Coleman Homes, Sharp Residential, Sabal Homes, Thrive Residential and Keller Homes. Additionally, Meritage Homes acquired Legendary Communities in 2014. Tripoint Homes acquired Weyerhaeuser Real Estate Company (WRECO) in 2014. However, the only two companies that we identified that did not make acquisitions were KB Homes and NVR in the period.
According to IBISWorld, the number of US homebuilding businesses is 378,036 in 2023. The number of businesses has increased from 317,885 in 2013 at a low CAGR of only 1.7% over the period. Additionally, the number of businesses has declined by 8% from 411,053 in 2021 which could indicate that the subindustry is consolidating even further. We believe the large number of businesses remaining in the Homebuilding subindustry could provide opportunities for the top companies to continue fueling their growth.
Strong Profitability
Additionally, we examined the profitability of the top 10 Homebuilding companies below and compared it with the industry average to determine whether they have advantages.
| Companies |
| Revenues (2022) |
| Average Revenue Growth (9-yrs) |
| Net Margins (5-yr Avg) |
| FCF Margins (5-yr Avg) |
| Capex as % of Revenue (5-yr Average) |
| DR Horton |
| 32,685 |
| 20.9% |
| 12.42% |
| -0.05% |
| 1.0% |
| Lennar |
| 32,861 |
| 23.1% |
| 11.27% |
| 2.05% |
| 0.4% |
| NVR |
| 10,327 |
| 10.9% |
| 12.61% |
| 9.04% |
| 0.2% |
| PulteGroup |
| 15,917 |
| 12.9% |
| 11.94% |
| 5.64% |
| 0.6% |
| Toll Brothers |
| 10,276 |
| 16.9% |
| 9.04% |
| 5.28% |
| 0.9% |
| TopBuild Corp |
| 5,009 |
| 15.8% |
| 8.62% |
| 5.59% |
| 1.7% |
| Taylor Morrison |
| 8,089 |
| 17.8% |
| 6.53% |
| -4.24% |
| 0.5% |
| Meritage Homes Corporation |
| 6,269 |
| 15.0% |
| 10.08% |
| 2.84% |
| 0.6% |
| KB Home |
| 6,904 |
| 14.9% |
| 7.60% |
| -0.09% |
| 0.6% |
| Tri Pointe Homes |
| 4,297 |
| 15.4% |
| 9.38% |
| 7.81% |
| 0.9% |
| Average (Top 10 Homebuilding) |
| - |
| 17.1% |
| 9.95% |
| 3.39% |
| 0.7% |
| Industry Average |
| - |
| 12.2% |
| 9.23% |
| 2.28% |
| - |
| Consumer Discretionary Sector Average |
| 13.8% |
| 4.28%* |
| 3.59%* |
| - |
*Current
Source: Company Data, CSI Market , Seeking Alpha, Khaveen Investments
Based on the table above, the average revenue growth of the top Homebuilding companies (17.1%) is higher compared to the total industry average (12.2%) and the Consumer Discretionary sector average of 13.8%. Within the top 10 companies, all companies have superior growth compared to the total Homebuilding industry average except for NVR.
Furthermore, the average top Homebuilders have slightly higher net and FCF margins compared to the overall industry, which highlights their stronger profitability which we believe is supported by their scale advantages as the top 10 companies are larger in terms of revenues. In comparison with the Consumer Discretionary sector, the top Homebuilding companies and total subindustry have higher net margins but lower FCF margins.
For DR Horton, the company's net margins have been strong and were the second highest only behind NVR. Though, its FCF margins are below the average of the top Homebuilders as well as the total subindustry. The company has the second highest average capex as % of revenue at 1%, which is only behind TopBuild at 1.7%. However, TopBuild also manufactures "insulation and other building material products" which accounted for 41% of its sales and could be a reason for its higher capex.
All in all, the top 10 Homebuilding companies' market share had increased over the past 10 years (except NVR), especially DR Horton and Lennar which gained the most share during the period. Additionally, Taylor Morrison also had higher than the average growth among the top 10 companies and its share increased by 50%. We attribute the high growth of top companies such as Lennar and Taylor Morrison to significant acquisitions in the past. Within the top 10, we identified that 8 companies made acquisitions which highlights the M&A strength of the top Homebuilders, and we believe could continue to fuel growth with the large number of Homebuilding businesses in the US providing opportunities for further share gains and signaling industry consolidation.
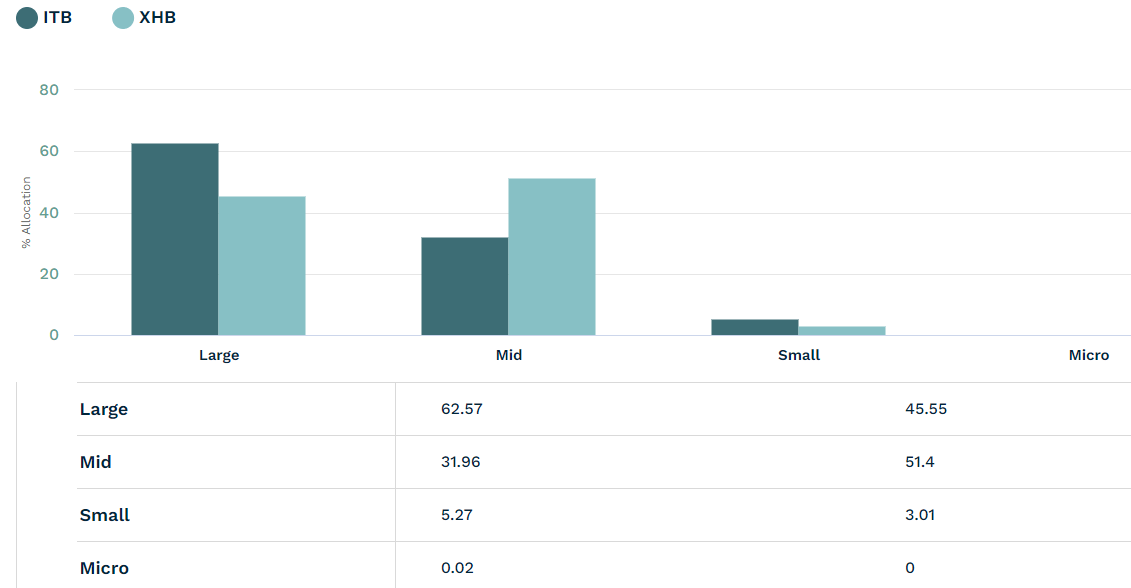
In relation to our comparison between ITB and XHB, the chart above shows the holdings breakdown of ITB for large-cap companies higher than XHB, which targets mid-cap holdings. Thus, we believe ITB provides an advantage over XHB with its higher allocation in the top Homebuilders which could continue to outperform the overall industry.
Risk: Slowing Private Residential Construction Spending in 2023
We believe one of the risks of the Homebuilding subindustry in the near term is the slowdown in US residential construction spending in 2023. In May 2023, the annualized US residential construction spending stood at $857 bln which represented a growth rate of -11.6%, indicating a contraction in US residential construction spending. Thus, we believe this could impact the Homebuilders negatively as we identified construction spending to be one of the drivers of the total Homebuilding subindustry. Additionally, home prices remained steady as the S&P Case-Shiller Home Price Index had been flat at 301.05 in April 2023, which is a growth rate of -0.2% YoY. In comparison, US residential construction spending and the S&P Case-Shiller Home Price Index have a 10-year average growth of 12.1% and 7.7% respectively. Thus, we believe 2023 may pose short-term headwinds for the Homebuilding subindustry.
Verdict
To conclude, our analysis encompassed an array of pivotal factors with the potential to influence the US Homebuilding subindustry. Among these factors, we carefully examined mortgage rates, private residential construction investments, new home sales, home prices, employment, population, GDP, income growth, consumer confidence, credit availability, and homeownership rates. Through rigorous regression analysis, we identified two statistically significant market drivers: private residential construction investments and home price growth.
However, intriguingly, we discovered that these factors do not serve as the primary drivers of growth for the top Homebuilding companies. Instead, it appears that company-specific factors hold greater sway in shaping their success. Over the last decade, we observed a general increase in market share for the top 10 Homebuilding companies, with notable exceptions like NVR, which underperformed the industry average. In contrast, DR Horton and Lennar experienced substantial gains in market share during this period. Taylor Morrison also achieved above-average growth, boasting an impressive 50% increase in market share. We believe the growth of companies like Lennar and Taylor Morrison can be traced back to significant acquisitions. In contrast, other companies pursued smaller deals to contribute to their revenue growth. We believe DR Horton's remarkable expansion can be attributed to its aggressive approach, supported by the second-highest capital expenditure intensity relative to sales. Considering these findings, we expect the top Homebuilders to continue their outperformance, driven by their pursuit of M&A activities, which could signal a potential industry consolidation.
In the introduction, we identified the top two subindustries in the home consumer market: Home Improvement Retail, which achieved the highest Quantitative Score of 5 and demonstrated the highest return, followed by Homebuilding with a score of 3 and the second-highest average historical returns. However, we were unable to find any ETFs primarily focused on the Home Improvement Retail subindustry. Consequently, our attention shifted towards Homebuilding ETFs, namely ITB, XHB, HOMZ, and PKB.
After evaluating these Homebuilding ETFs, we eliminated HOMZ and PKB from consideration due to their AUMs falling below our minimum requirement of $0.5 bln. With ITB and XHB remaining, we calculated a higher risk-adjusted return of 0.5774 for ITB compared to XHB's 0.4332. Furthermore, we believe ITB provides excellent exposure to the top two subindustries we identified, Home Improvement Retail and Homebuilding, with a combined weighting of 76%. Consequently, we rate ITB as a Buy.
For further details see:
ITB: Why We Believe It's The Best Homebuilding ETF