BK - Ithaka Group Q3 2023 U.S. Growth Commentary
2023-10-26 05:23:00 ET
Summary
- The Ithaka Group is an independent investment boutique that specializes in managing high-quality, concentrated growth equity portfolios.
- The market’s retracement coincided with fading expectations for a “Fed pivot,” with Wall Street having to admit we are in a “higher for longer” scenario until proven otherwise.
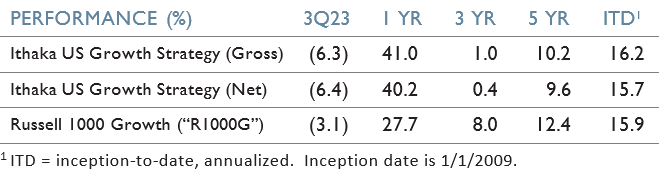
- During the third quarter Ithaka’s portfolio underperformed in a weak market, falling 6.3%.
- For Ithaka’s portfolio, 83% and 90% of its holdings beat top- and bottom-line expectations, respectively, which sent the average stock down ~1%, six stocks up >5%, and eight stocks down >5%.
Market Review
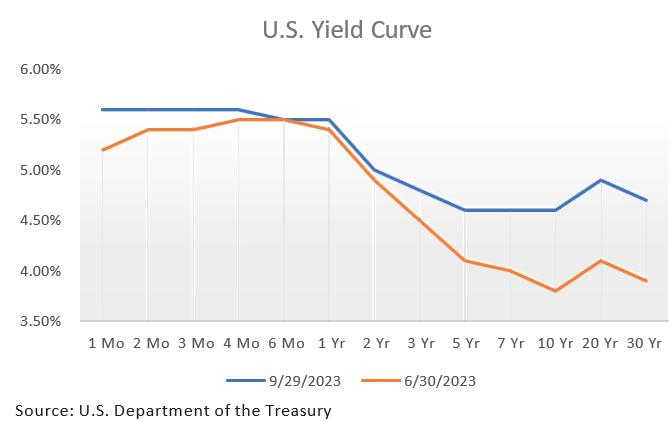
Following two quarters of historically strong equity returns in the growth space, major indices gave back some of their gains in the 3rd quarter. The Nasdaq 100’s year-to-date gain retraced from 39.4% to 34.5% while the S&P 500’s gain retraced from 15.9% to 11.7%. Remarkably, the S&P 500’s top 10 weightings accounted for an unprecedented 96.5% of the year-to-date total return. The market’s retracement coincided with fading expectations for a “Fed pivot,” with Wall Street having to admit we are in a “higher for longer” scenario until proven otherwise. Famed economist Mohamed A. El-Erian pegged this flip-flop in expectations as the sixth time consensus has shifted between a soft and a hard landing in the past 15 months. The most recent shift in expectations kept downward pressure on bond prices, pushing the yields on government securities to their highest level in over 15 years. Without a dramatic shift in policy from the Fed prior to year end, 2023 will mark the third consecutive year of negative bond returns, something that hasn’t happened in the last ~100 years. To make matters worse, these bond losses actually accelerated in the quarter, as a deeply inverted yield curve, measured by the difference between the 10-year and the 2-year, made an aggressive shift towards a more normally shaped one. In fact, the yield curve un-inverted by 62 basis points (“bps”) in the quarter, rising from a -106bp inversion at the end of the 2nd quarter to a -44bp inversion at the end the 3rd (see chart below).
The Fed’s resolve to keep rates elevated to tame inflation depends in large part on the U.S. economy’s continued resilience, which up to this point has been nothing short of remarkable. Despite this aggressive rate hiking cycle, the U.S. unemployment rate has held steady (near record lows) at 3.8% following 39 consecutive months of job gains. And consequently, consumer spending has continued to gain momentum throughout the year thanks in part to strong spending on services, especially travel and entertainment, in the waning wake of the pandemic. Fortunately, notwithstanding the labor market strength, the core rate of inflation has continued its decline (by 50bps q/q and 200bps y/y to 4.35% in August). As has been the case for this entire tumultuous period, the market’s expectation for rate hikes (or cuts) remains fluid. One cannot help but think most asset prices will continue to experience heightened volatility as investors digest, in real time, the future paths of inflation, interest rates, and consumer purchasing power (to name a few), and their combined effect on the prices of assets.
3Q23 Performance
During the third quarter Ithaka’s portfolio underperformed in a weak market, falling 6.3%. For comparison purposes, the Dow fell 2.6%, the S&P 500 fell 3.7%, the NASDAQ fell 4.1%, and our benchmark, the Russell 1000 Growth, fell 3.1%. Ithaka’s 310bps of underperformance was entirely due to stock selection, with a slight benefit from sector allocation. Our portfolio demonstrated modest breadth and depth, with 13 of 30 stocks held for the entire quarter, representing 43% of the names and 51% of the total portfolio weighting, outperforming our benchmark.
At the portfolio sector level Ithaka realized positive relative returns in only one of the four sectors in which we hold active bets: Financial Services. Our overweight to the sector as well as exposure to a company that got added to the S&P 500 accounted for the entirety of the return, which was slightly offset by weak performance from a small weighting in the FinTech space. Within Health Care, Ithaka’s overweight to medical device companies significantly impacted returns. Four of our six Health Care holdings were impacted by the approval and rapid uptake of glucagon-like peptide-1 receptor agonists (GLP-1’s), such as Ozempic and Wegovy, for the treatment of type-2 diabetes and weight loss. Consumers and investors alike are in the throes of trying to assess the impact the expanded indications for these drugs will have on the broader market for health care services and technologies. Our slight underperformance in both Technology and Consumer Discretionary lacked a discernable theme, with individual stock specific news having the largest impact on those holdings.
Contributors and Detractors
Top Contributors
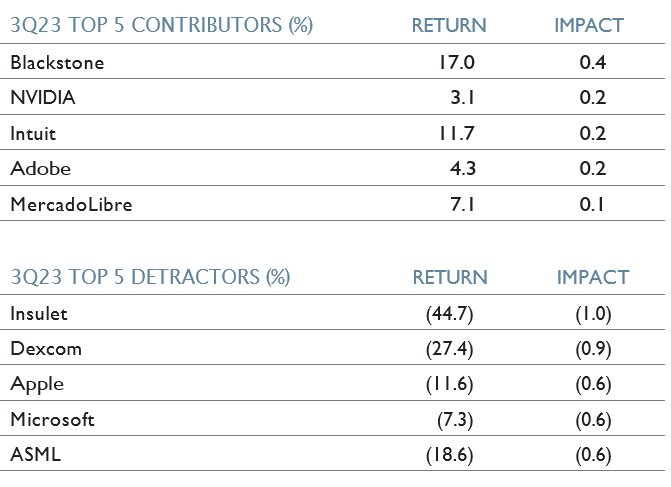
Blackstone Inc. ( BX )
Blackstone is one of the world’s leading alternative asset management firms with total Assets Under Management now in excess of $1 trillion. Over the past few decades Blackstone has evolved into one of the financial service industry’s largest asset gatherers, managing money on behalf of pension funds, insurance companies, and individual investors. The company remains at the forefront of financial innovation, broadening its product offering through time. Today, Blackstone invests clients’ capital across four business segments: ((A)) Real Estate, ((B)) Private Equity, ((C)) Hedge Fund Solutions, and ((D)) Credit & Insurance. The stock’s relative outperformance in the quarter was in part due to the announcement in early September that it would be added to the S&P 500.
Intuit Inc. ( INTU )
With a mission of “powering prosperity around the world,” Intuit serves its consumer and small businesses customers by delivering financial management, compliance, and marketing products/services on one unified global technology platform. Intuit’s platform has expanded over the years and now includes QuickBooks, TurboTax, Credit Karma and Mailchimp, comprising 100M total customers across all four products. Intuit’s outperformance in the quarter followed a strong F4Q earnings announcement that included forward guidance slightly above Street expectations.
NVIDIA Corp. ( NVDA )
NVIDIA is the market leader in visual computing and accelerated computing due to its prowess in the production of high- performance graphics processing units (GPUs). The company targets four large and growing markets: Gaming, Professional Visualization, Data Center, and Automotive. NVIDIA’s products have the potential to lead and disrupt some of the most exciting areas of computing, including data center acceleration, generative artificial intelligence (GenAI), machine learning, and autonomous driving. The reason for the stock’s appreciation in the quarter was twofold: first, the stock benefited from tremendous excitement surrounding the further development of generative AI technologies and the likelihood this would necessitate the purchase of a large number of Nvidia’s products for years to come; second, Nvidia posted a another beat-and- raise quarter, besting Street estimates by 23% on the top-line and 33% on the bottom-line.
Top Detractors
Insulet Corp. ( PODD )
Insulet is a medical device company focused on the design, development, and commercialization of insulin pump systems for people with type-1 diabetes. Diabetes is a chronic, life- threatening disease for which there is no known cure. Insulet’s insulin pump system is superior to traditional practices because it provides its users with a more accurate and pain free way to administer insulin versus injecting it via syringe multiple times per day. Insulet’s stock was under pressure following the FDA’s approval of glucagon-like peptide-1 receptor agonists (GLP-1’s), Wegovy and Saxenda. These injectable drugs were approved for chronic weight management in adults who are obese or overweight with at least one weight-related condition. While the approval of these GLP-1’s is likely to have limited impact on pump system sales in the near-term, investors sold PODD fearing that these new drugs will shrink Insulet’s total addressable market over time.
DexCom, Inc. ( DXCM )
DexCom is a medical device company focused on the design, development, and commercialization of continuous glucose monitoring (CGM) systems, primarily for people with diabetes. Diabetes is a chronic, life-threatening disease for which there is no known cure. DexCom’s CGM system is superior to traditional finger-stick tests because it provides users with continuous data (including glucose trends and time spent in hyper or hypoglycemia) versus a snapshot in time. Much like Insulet, Dexcom’s stock suffered from fears surrounding the long-term impact of GLP-1’s on the company’s addressable market.
Apple Inc. ( AAPL )
Apple is a global consumer electronics and software company that designs and markets mobile communications devices (iPhones), personal computers (Macs), multi-purpose tablets (iPads), and wearables (Apple Watch, AirPods, and Accessories).
The company also sells several high-margin consumer services including Advertising, AppleCare, Cloud Services, Digital Content and Payment Services. AAPL’s underperformance during the quarter was due to fears the upcoming iPhone 15 launch would drive fewer upgrades than expected as consumers around the world continue to scrutinize their discretionary household spending.
Transactions
During the quarter we did not initiate or eliminate any positions. We trimmed our NVIDIA position once during the quarter after it crested our self-imposed cap of 8% in any one holding, and added the proceeds to two other portfolio holdings: Amazon. com and Cadence Design Systems. Our trailing 12-month turnover decreased to 11.4% while our trailing 3-year average annual turnover decreased to 14.7%. 1
Market Outlook
Ithaka claims no expertise in economic or market predictions, and top-down analysis plays a minor role in our approach to investing. We typically take our cues on the markets and the economy from our companies’ management teams as they discuss their business prospects, and industry outlooks, during quarterly calls. As we approach what appears to be the end of the Fed’s rate hiking cycle, investors are expanding their focus from all things macro to individual company performance. For Ithaka’s portfolio, 83% and 90% of our holdings beat top- and bottom-line expectations, respectively, which sent the average stock down ~1%, six stocks up >5%, and eight stocks down >5%. The skew in the quarter was slightly negative. Similar to the prior two quarters, Generative Artificial Intelligence (“GenAI”) once again dominated almost every earnings call we digested.
In our pervious letter we discussed what GenAI is, and outlined the debate surrounding the bull and bear case for this burgeoning technology. While this debate continues, in order to elucidate our thinking we will align with the bulls here and conclude this technology will have legitimate business (and personal) use cases and hence the opportunity to create economic profits. The first stage of such technological revolutions typically benefits the companies supplying the infrastructure, the proverbial “picks and shovels” providers. In the 1990’s internet boom this included companies such as Global Crossing, Cisco, and Lucent (to name just three). In the case of GenAI, the primary beneficiary has been Jensen Huang’s NVIDIA. While there are ongoing debates as to what are the best accelerated computing products to power GenAI clusters (NVIDIA’s GPUs, Alphabet’s TPUs, or Amazon’s Inferentia accelerator chips), for all intents and purposes NVIDIA has won the battle, if not the war. We think over the next 9 to 18 months the markets will start focusing on stage two of this technological revolution, which will entail identifying the companies that will ultimately be able build applications on top of the modern infrastructure to monetize their AI products and services. You have long heard Ithaka discuss our ongoing endeavors to identify and own companies that will most likely “capture the economic rents in their space.” We believe in this instance the economic rents will be captured by companies that can best balance product quality with speed to market. Clearly there will be substantial demand for products that will increase revenue, reduce costs, improve productivity, and contribute to managing risk. And while we anticipate strong, persistent demand over time, we believe initially AI customers will be selective in choosing partners to entrust with their precious digital resources. In this scenario, it is hugely beneficial to be early to market.
First, there will only be so much capital a company is willing to commit to “unproven” technology, which will make the fight to get in the door highly competitive. On top of this, the company that does get in the door first will have a competitive advantage that will likely compound as the nature of the technology allows the model to get better and better based on the more uptime it has, and the more data it has fed into it. As the market works to find the winners, we believe the companies that possess (1) a current captive customer base, (2) a large pile of resources (both developer and financial), (3) large proprietary data pools, and (4) an ability to iterate rapidly, have the highest probability of effectively monetizing these new services. We are fortunate that despite their already large market caps, several of our portfolio companies recognized and embraced this trend early and are already well on their way to marketing viable products at affordable prices. Only time will tell if these companies can turn their speed and quality advantages into meaningful, incrementally profitable products and services. From what we have observed thus far, we like their odds.
Our market outlook section wouldn’t be complete without our obligatory musings on the Fed’s future policy decisions. As it stands today, the Fed has hiked rates 525bps over the past 19 months with one more 25bp hike anticipated before year end, resulting in a policy range of 5.50% to 5.75%. This continues to be a fluid situation as the market is constantly receiving mixed signals from economic data releases and Fed governor commentary. We do believe, like the market, that the Fed is near the end of its rate hiking cycle and the main outstanding question is: how long will rates stay elevated? If history is any guide, inflationary environments tend to be sticky in nature, which necessitates keeping rates higher for longer. Absent any major movement in consumption or unemployment, it seems likely the Fed’s target of 5.25% by the end of 2024 is still firmly on the table.
As always, we end this letter acknowledging that one’s ability to digest, forecast, and accurately discount the above macro factors is pretty much an exercise in futility, and we therefore choose to stay fully invested and focused on our mission of creating wealth for our clients by owning, in size, the great growth stories of our day.
1 Turnover Rate indicates the frequency of changes to the portfolio, and is calculated as the greater of the buys or the sells during the period as a percentage of the assets under management at the time of each transaction. The calculation eliminates the effect of client-directed cash flows. Average Annual Turnover is calculated based on a trailing three year period.
Risk Disclosure
Past performance is not indicative of future results. The performance shown is for the Ithaka US Growth Strategy Composite. All fully discretionary taxable and non-taxable accounts are added to the composite following the first quarter in which their ending market values equal or exceed $0.5 million. Results of individual accounts may vary from the composite depending on account size, timing of transactions and market conditions prevailing at the time of the transaction. The gross-of-fee performance does not reflect the payment of management fees and other expenses that are incurred in the management of an account. The net-of-fee performance includes the payment of such fees and expenses. Gross-of-fee performance and net-of-fee performance both include the reinvestment of all distributions, dividends and other income.
The performance shown is compared to the Russell 1000 Growth Index and the S&P 500 TR Index. The Russell 1000 Growth Index measures the performance of the broad growth segment of the U.S. equity universe. It includes those companies from the Russell 1000 Index with high price-to-book ratios and high forecasted growth as compared to other companies listed in the Russell 1000 Index. The S&P 500 TR Index is a market-capitalization- weighted index that measures the performance of 500 leading publicly traded companies in the U.S. The index tracks both the capital gains as well as any cash distributions, such as dividends or interest, attributed to the components of the index. These broad-based securities indexes are unmanaged and are not subject to fees and expenses typically associated with managed accounts. Individuals cannot invest directly in an index.
The information provided in this report should not be considered a recommendation to purchase or sell any particular security. There is no assurance that any securities discussed herein will remain in an account’s portfolio at the time you receive this report or that securities sold have not been repurchased. The securities discussed do not represent an account’s entire portfolio and in the aggregate may represent only a small percentage of an account’s portfolio holdings. It should not be assumed that any of the securities transactions or holdings discussed were or will prove to be profitable, or that the investment recommendations or decisions Ithaka makes in the future will be profitable or will equal the investment performance of the securities discussed herein. Investing in securities entails risk and may result in loss of principal.
The Ithaka Group, LLC (Ithaka) has entered into a written agreement with Cedar Partners, ltd. (Cedar), which requires Cedar to provide client relationship and marketing services to Ithaka, including the introduction of prospective advisory clients to Ithaka. Cedar is not affiliated with and has no relationship with Ithaka other than a contractual relationship governed by the agreement between Cedar and Ithaka. Ithaka compensates Cedar by the payment of an Annual Retainer plus an Account Fee equal to 20% of the investment management fees paid to Ithaka by clients introduced by Cedar. The retainer is paid during the term of the Agreement between Cedar and Ithaka. The Account Fee is paid for as long as the client’s account is managed by Ithaka. Ithaka has a standard fee schedule and does not charge any additional amounts to clients who were marketed by Cedar to cover the amounts Ithaka pays to Cedar.
Editor's Note: The summary bullets for this article were chosen by Seeking Alpha editors.
For further details see:
Ithaka Group Q3 2023 U.S. Growth Commentary