PRF - IUS: PRF's Higher Quality Brother
2023-10-20 10:08:31 ET
Summary
- Invesco RAFI Strategic US ETF (IUS) has outperformed PRF and iShares Russell 1000 ETF (IWB) since its inception in 2018.
- IUS has a quality tilt and is more tilted towards large caps and growth compared to PRF.
- IUS is expected to continue outperforming PRF and IWB based on its portfolio composition and long-term trends in equity factors and sectors.
In a previous article we discussed the Invesco FTSE RAFI US 1000 ETF ( PRF ). PRF is outperforming value ETFs, but it has itself a value-tilt that acts as a drag on its performance.
Today, we discuss another non-market cap weighted Invesco ETF: the Invesco RAFI Strategic US ETF ( IUS ). Compared to PRF IUS has a quality-tilt. IUS is also tilted more to large caps and growth in comparison to PRF.
Since its inception in 2018 IUS is outperforming both PRF and iShares Russell 1000 ETF ( IWB ) and at the same time it’s less risky. Given its portfolio composition we expect IUS to continue to outperform both PRF and IWB.
Non-market-cap-weighted ETFs
Invesco has a tradition in non-market cap weighted ETFs. In 2006 Invesco acquired PowerShares who was among the first ETF providers to offer non-market cap weighted ETFs. Another pioneer was Rydex who itself got acquired by Guggenheim. The latter was later on acquired by …Invesco.
Rydex launched what is now the Invesco S&P 500 Equal Weight ETF ( RSP ). RSP was in 2003 the first non-market-cap-weighted ETF. The Invesco FTSE RAFI US 1000 ETF itself was launched in December 2005.
In September 2018, Invesco launched a suite of five "Strategic" exchange-traded funds. One of them is the Invesco RAFI Strategic US ETF ( IUS ). IUS is benchmarked to the Invesco Strategic US Index . This index measures the performance of US companies that tend to have larger, higher quality businesses.
Very much like PRF, IUS weights stocks according to the size of their businesses. Each stock is assigned a business-size score. This score is the equally weighted average of four measures of company size:
- sales,
- operating cash flow,
- total return of capital (dividends and share repurchases), and
- book value.
IUS looks at both dividends and share repurchases, while PRF takes only dividends into account.
Unlike PRF, IUS also assigns a quality score. The quality score is the average of two factors:
- efficiency and
- growth.
Efficiency measures the ability of a company to generate size off of its asset base and is calculated as the ratio of sales-to-assets in the prior year.
Growth measures the increase in the size of a company’s business and is calculated as the percentage change in the ratio of sales-to-assets over the prior five years.
For inclusion in the index, stocks are ranked in descending order on business-size score. Those securities within the top 90% in cumulative business size are eligible for inclusion in the Index. Of these eligible securities, the 20% of stocks with the lowest quality score are excluded. Each security is then weighted proportionally to its float-adjusted business-size score. The ETF and the index are reconstituted annually.
Excluding the 20% of stocks with the lowest quality score gives IUS a quality-tilt compared to PRF. We like this, as quality is our favourite equity factor .
IUS’ higher return on equity reflects this higher quality tilt.
Regarding the valuation, both ETFs are more or less on the same level and both have a 2% dividend yield.
IUS has a lower expense ratio (0.19% vs 0.39%).
Figure 1: ETF Information (Invesco)
The biggest sectors are Technology, Healthcare and Energy.
Figure 2: Sector allocation IUS (Invesco)
The top 10 holdings of the fund can be found in the below table. Each security is weighted proportionally to its business-size score.
Figure 3: Top 10 holdings IUS (Invesco)
Performance
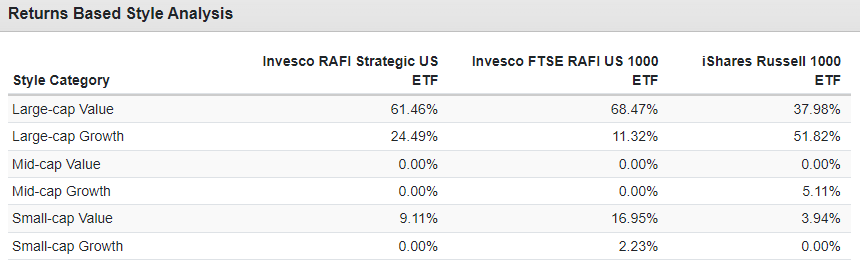
Returns based style analysis by Portfolio Visualizer shows that IUS has a stronger large cap and growth tilt than PRF. The growth tilt is however lower than the one of the iShares Russell 1000 ETF.
Figure 4: Returns based style analysis (Portfolio visualizer)
Returns based style analysis aims to explain the portfolio returns based on asset class exposures, it does not identify the actual portfolio holdings.
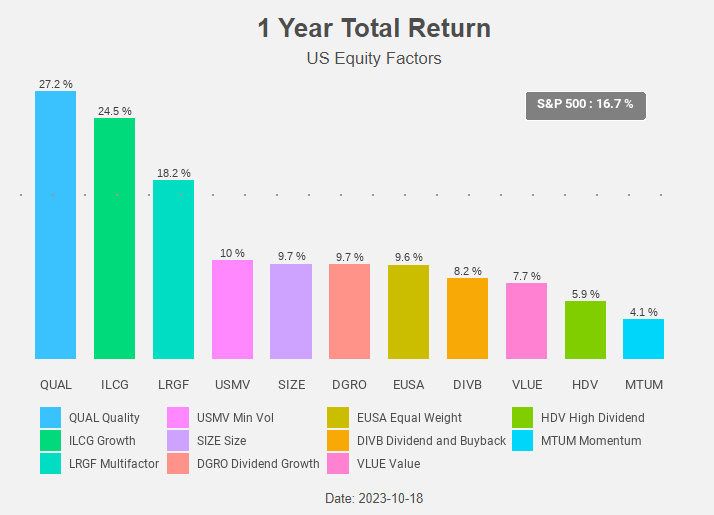
Given the performance of the equity factors we can expect IUS to outperform PRF. Quality and Growth are outperforming, while value and small caps are lagging.
Figure 5: Total return chart (Radar Insights)
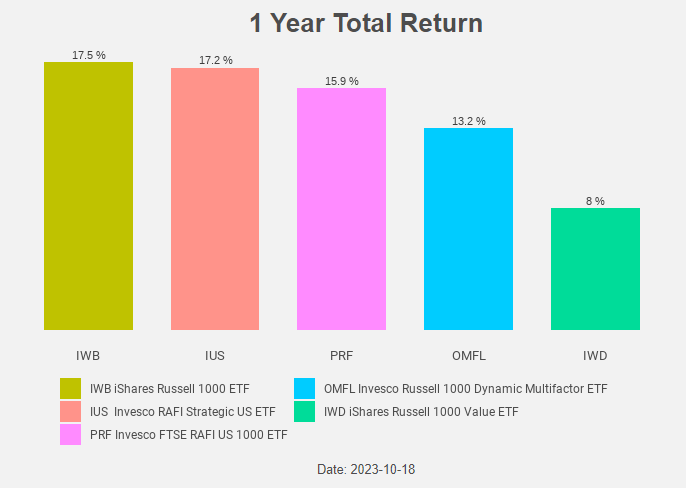
This is indeed the case.
Figure 6: Total return chart (Radar Insights)
The past 12 months IUS outperformed PRF, but also slightly underperformed IWB.
Compared to PRF, IUS is overweight Energy, Technology and Communication Services and underweight Financials.
Figure 7: Sector drift (ETF Research Centre)
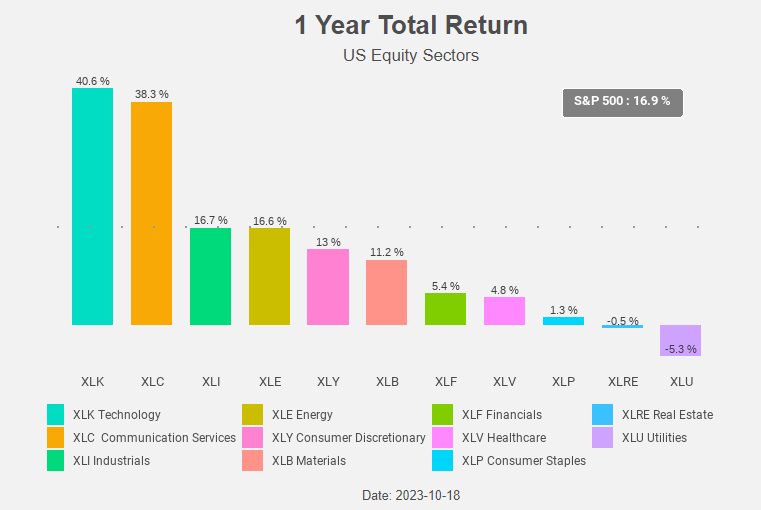
Given the performance of the equity sectors it’s no surprise IUS is outperforming PRF. Technology and Communication Services are outperforming, while Financials are lagging.
Figure 8: Total return chart (Radar Insights)
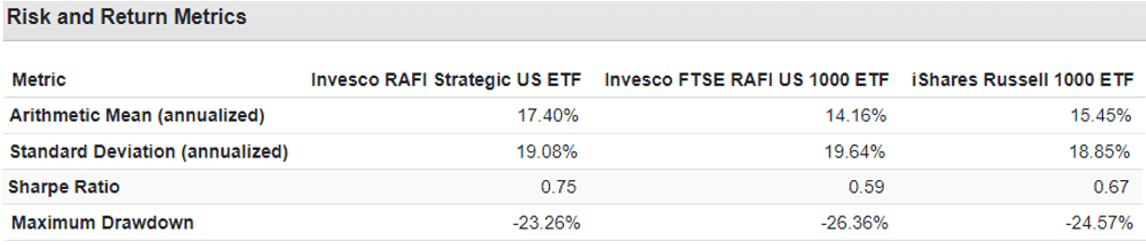
Longer term, since its inception in 2018, IUS outperforms both PRF and IWB and it did so with lower volatility and lower drawdowns.
Figure 9: Risk and return (Portfolio Visualizer)
Outlook
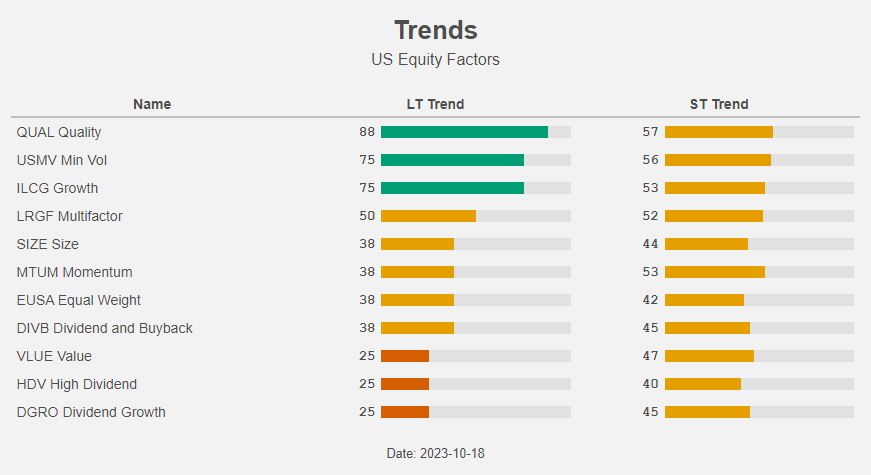
Based on the trends for equity factors and sectors we expect IUS to continue to outperform PRF.
Growth and Quality are in a long term uptrend, while Value is in a long term downtrend.
Figure 10: Trends (Radar Insights)
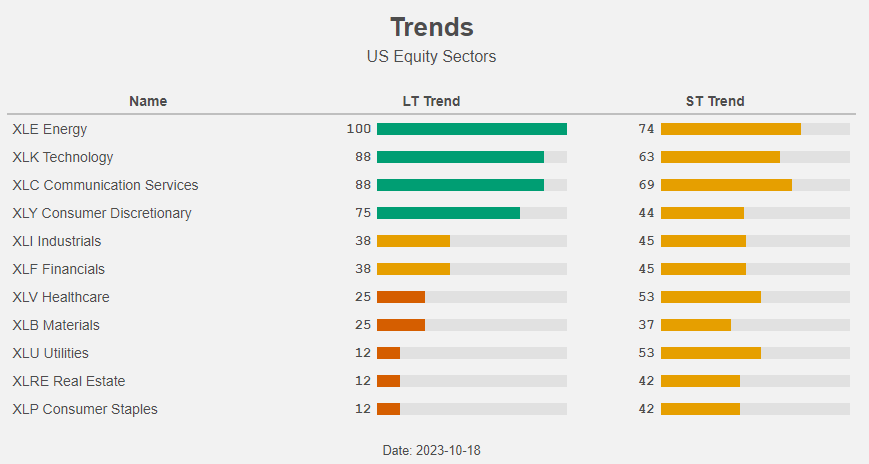
IUS is overweight the sectors that are in a long term uptrend: Energy, Technology and Communication Services.
Figure 11: Trends (Radar Insights)
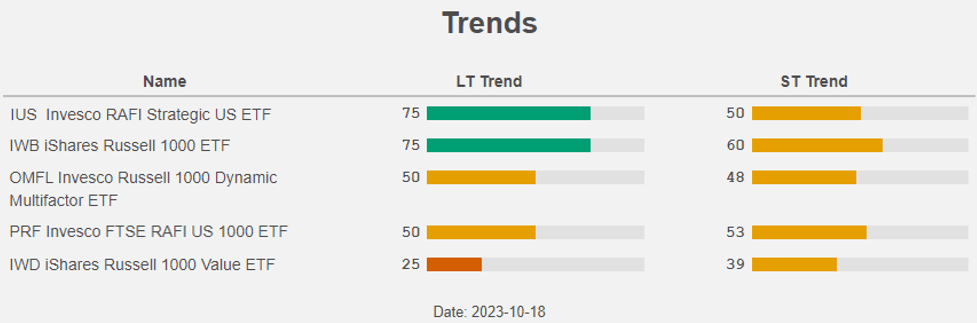
It comes as no surprise that IUS is in a long term uptrend, which is not the case for PRF. We expect IUS to continue to outperform PRF.
Figure 12: Trends (Radar Insights)
Conclusion
IUS has, compared to PRF, a better long-term performance, lower risk (both volatility and drawdowns) and has a higher exposure to equity factors (Quality and Growth) and sectors (Technology, Energy and Communication Services) that are in a long term uptrend.
The latter is also the case for IUS itself (and not for PRF).
While we doubt PRF is able to outperform “traditional” equity indices like IWB, we are more confident that IUS will be able to do so.
For further details see:
IUS: PRF's Higher Quality Brother