SWAV - IWM: A Move Higher Is Coming Soon
Summary
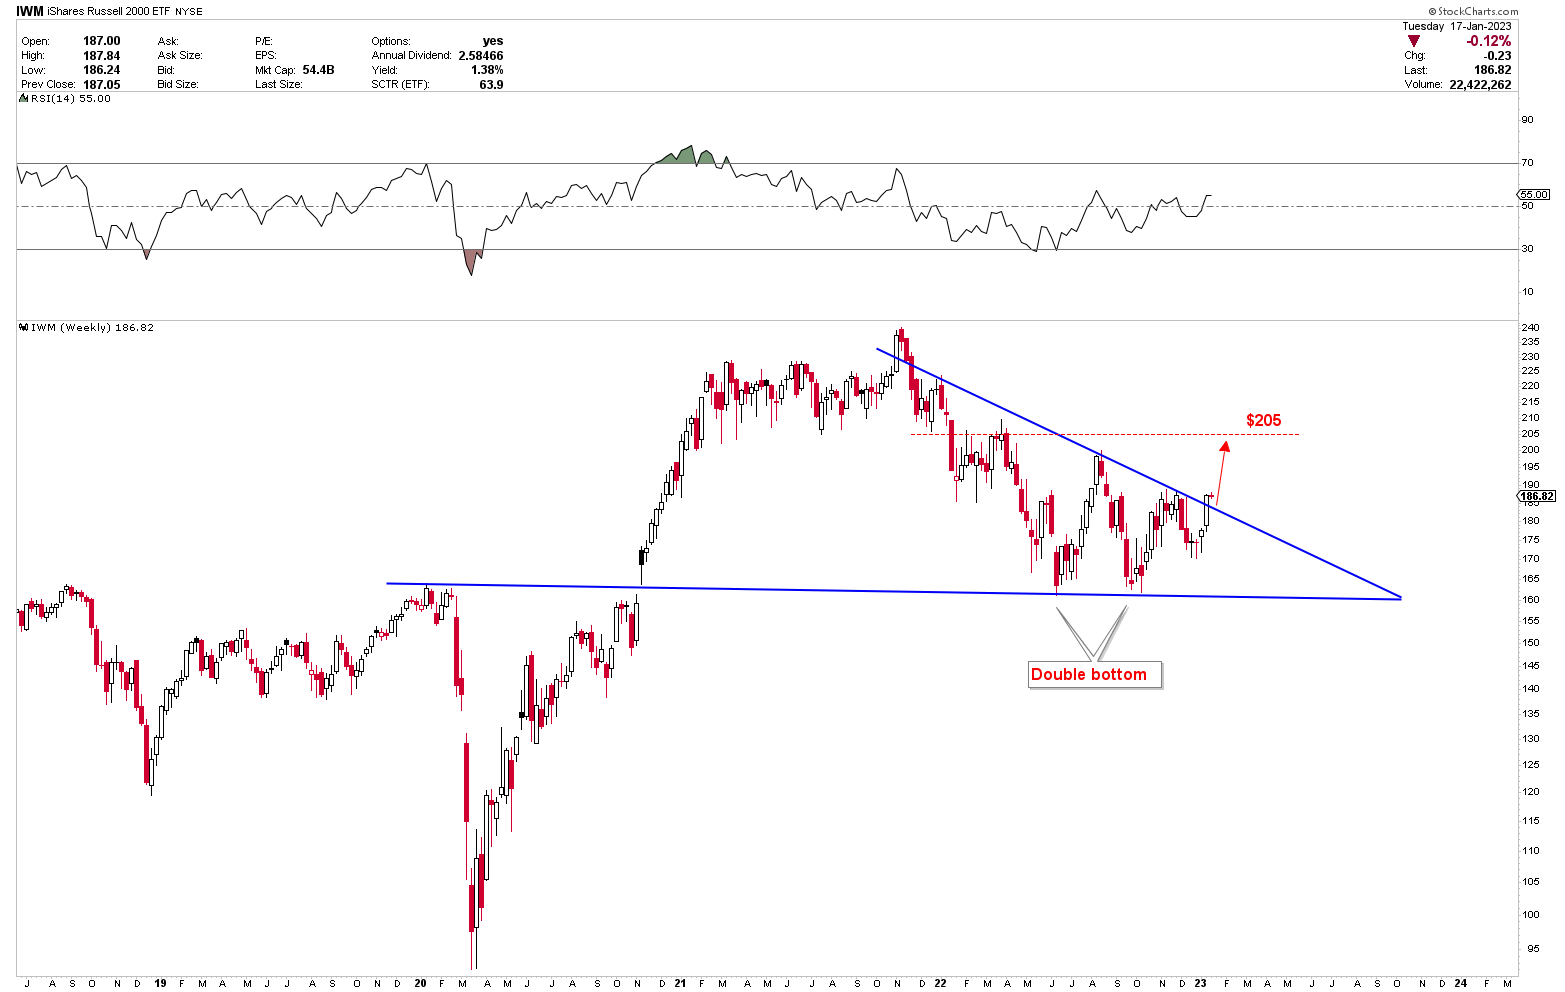
- IWM has broken through the trendline, and a move to the upside toward $205 is likely.
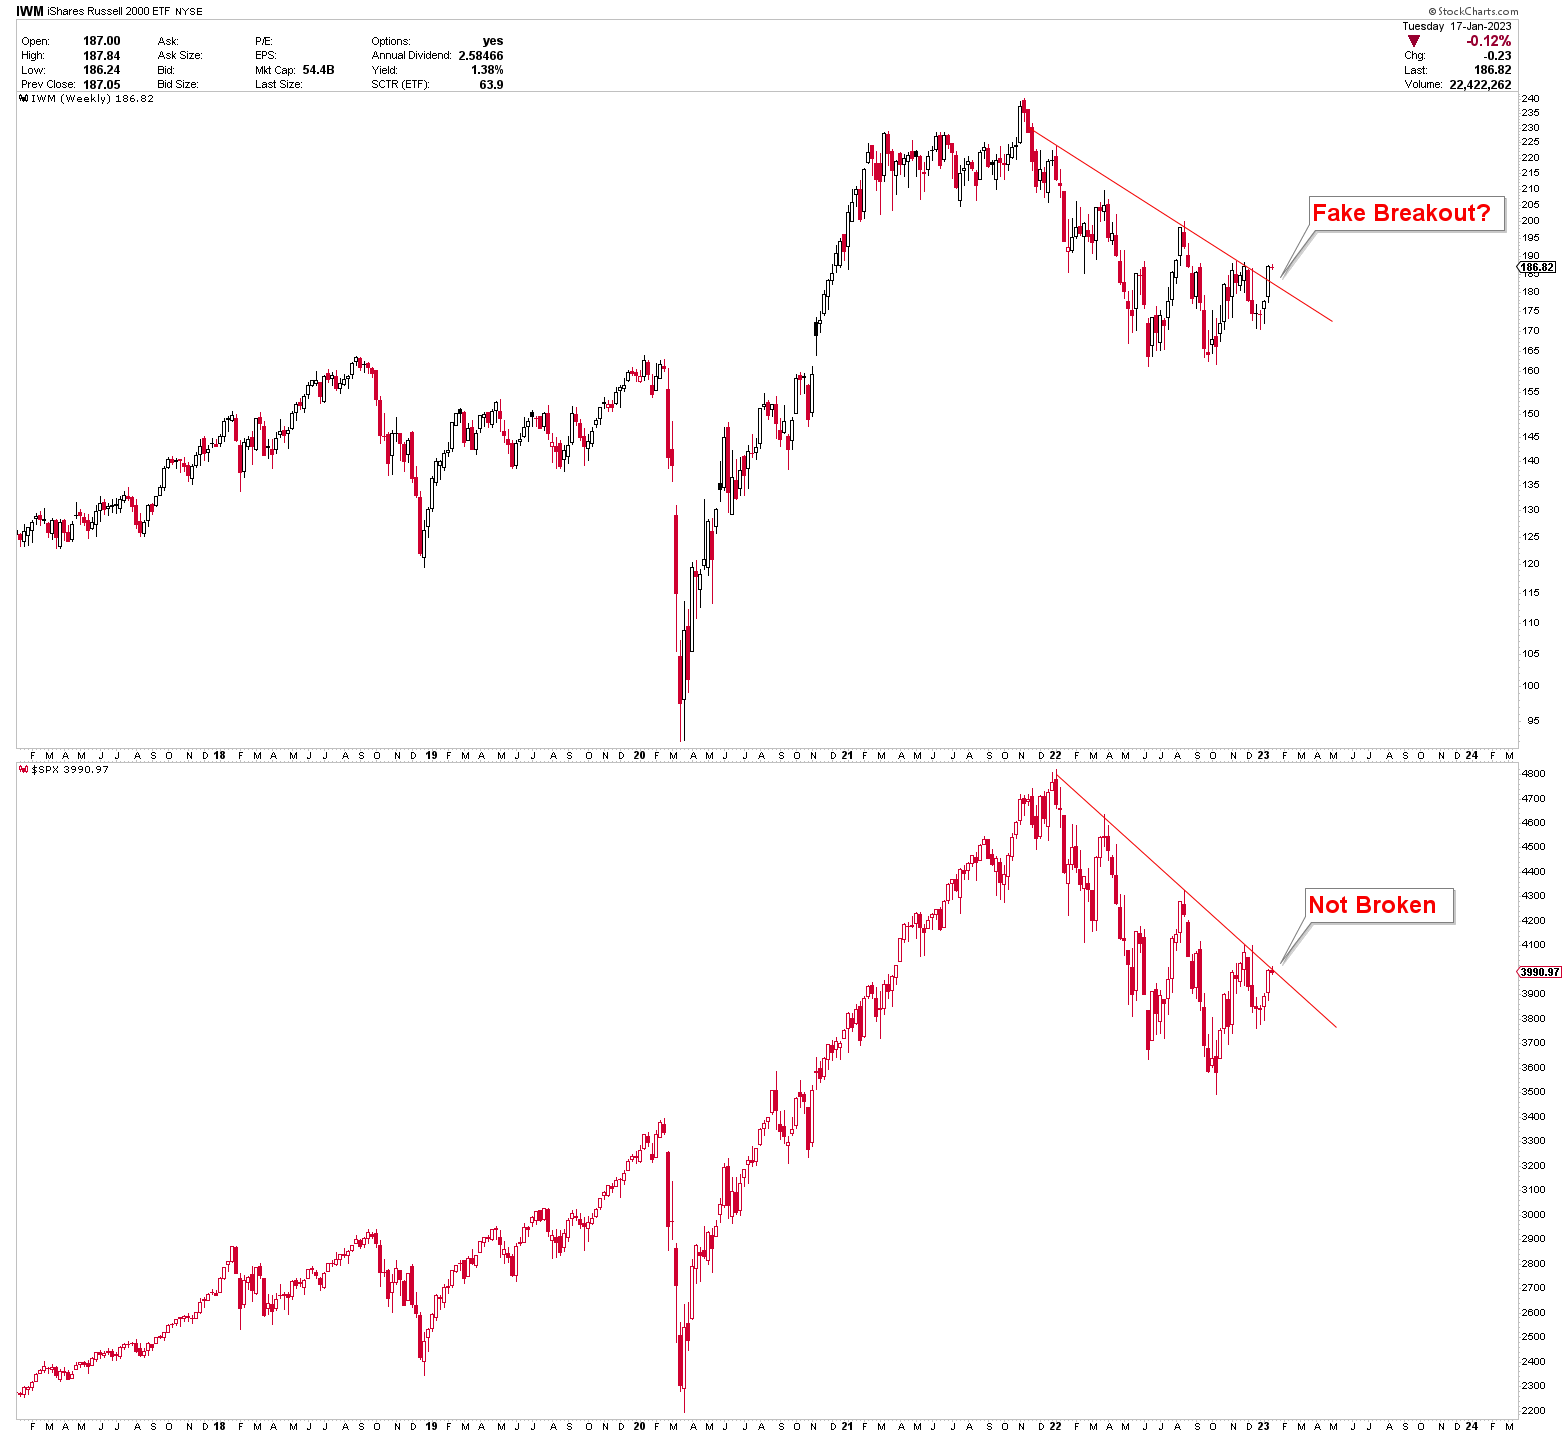
- While IWM has broken, S&P 500 is currently testing resistance but is likely to break higher in the near future.
- A move above $205 in IWM will confirm a bottom and initiate a new uptrend.
The iShares Russell 2000 ETF ( IWM ) tracks the performance of the Russell 2000 Index on the New York Stock Exchange and the NASDAQ. The ETF provides exposure to 1,956 domestic small-cap U.S. stocks via a single fund. Investing in small-cap stocks like the Russell 2000 Index is a good way to diversify a portfolio and potentially achieve higher returns. Additionally, small-cap stocks are less correlated with the performance of more established companies, which reduces overall portfolio risk. IWM is forming a strong bullish pattern on the chart, implying further price gains. On the other hand, the price structure over the long term remains bearish. A break above $205 is likely and is a bullish indicator for the ETF.
Why Should Investors Hold IWM ETF?
IWM includes stocks from a wide range of industries and sectors, which help to spread risk across a portfolio. In addition, IWM allows investors to buy a basket of stocks at once, which is beneficial for investors seeking an easy way to gain exposure to the small-cap market segment. IWM holds a total of 1,956 small-cap stocks from the United States, with the top 10 holdings accounting for 2.86% of the fund's total assets. Total assets amount to $54.61 billion. The ETF has a dividend yield of 1.4% and an expense ratio of 0.19%.
Price Congestion is a Bullish Factor
The weekly chart below depicts the IWM's recent price structure. Within the blue lines, the price is compressing in a narrow range and forming a congestion zone. The price is congested within the blue triangle, and IWM closed above $185 last week, indicating a strong breakout from price congestion. This strong breakout has the potential to take the price towards the red dotted line at $205. Similarly, the RSI, which has closed above 50 and is rising, indicates higher prices in IWM.
IWM has dropped by 30.56% from November 2021 highs to June 2022 lows. The decline in IWM has created a fantastic buying opportunity for investors in 2022. The fact that short-term price structure indicates a bullish scenario, but the long-term remains unclear. The decline in the ETF by 30.56% was caused by recent economic uncertainty, which has been fueled by a number of factors, such as high inflation and interest rates.
Market Risk
The IWM has short-term upside potential, but the long-term price structure remains uncertain. Earnings in the small-cap sector are extremely volatile, and IWM has a high PE ratio. If the earnings exclude interest, tax, and depreciation, the ETF is not cheap. The monthly chart for ETF also reveals the bearish formation. The gap seen in the below chart is typically filled prior to the subsequent rally. However, the weekly chart has produced the best possible scenario for the near-term rally, but the risk remains elevated until the price clearly breaks above $205. The chart also shows the level of support from which the IWM is rising. Currently, the risk will become minimal if ETF clearly breaches $205.
The monthly chart for the S&P 500 index ( SP500 ) is shown below which presents the relationship between IWM and SP500. Both instruments track different segments of the stock market. The SP500 and IWM do not typically exhibit a perfect correlation. IWM represents small-cap stocks, whereas the SP500 represents large-cap stocks. Small-cap stocks are more volatile than large-cap stocks and do not move in the same direction. However, the correlation coefficient between the two indices is 0.79, which is considered moderately positive but not perfect. The moderately positive correlation is observed in the chart below. On a short-term basis, the SP500 has not broken the trendline like IWM. This suggests that there is still a chance that the SP500 may correct lower. If SP500 correction happens, IWM is likely to follow due to the moderately positive correlation. Therefore, the risk in IWM is still high.
Final Words
On the basis of the preceding discussion, it is concluded that the IWM has formed bullish patterns and has broken to the upside with a target of at least $205. However, the SP500 remains close to breaking higher, which increases the risk in IWM. SP500's price pattern is also bullish in the short term and a breakout is likely. On the other hand, the IWM's long-term trend is still bearish, but any break above $205 will confirm the long-term bullish trend. Investors should hold positions until IWM breaks $205. The investors, who want to enter new positions in IWM with the least amount of risk, should enter the market slightly above $205. Due to economic uncertainty and rising interest rates, the US dollar breaks down. Therefore, US dollar pressure is increasing the demand for precious metals, which is also a positive sign for stocks and ETFs.
For further details see:
IWM: A Move Higher Is Coming Soon