VB - IWM: A Valuation Reset Amid A Technical Breakout Reiterate Buy
2023-12-29 11:41:07 ET
Summary
- Small caps have seen a resurgence in popularity and bullish sentiment after being left for dead in October.
- The Russell 2000 ETF is printing fresh highs since early 2022 and has the potential for a technical breakout and a retest of its all-time high above $240.
- The valuation of small caps has increased, but they are still not considered expensive, and there is potential for further upside.
- I highlight key price levels to watch on the now-popular small cap ETF.
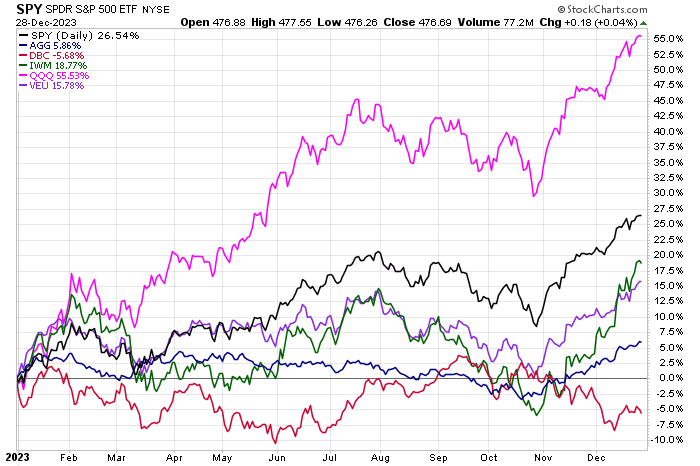
Small caps have become the talk of the street. It seems financial television is frequented by strategists who are suddenly bullish on the space that was left for dead back in October. It was early in Q4 when both the S&P 500 SmallCap 600 and Russell 2000 Index were trading with forward earnings multiples in the low teens. Jump ahead to the end of the year, and the value case is not quite as compelling. Over the last six months, in fact, small caps have matched the return on the Nasdaq 100 ETF ( QQQ ).
I reiterate my buy rating on the Russell 2000 ETF ( IWM ), though acknowledge that there has been a valuation reset and sentiment that is perhaps stretched to the optimistic side following the potentially third-biggest two-month rally in its long history.
The result is that IWM is now printing fresh highs dating back to early 2022, though the fund remains well below its November 2021 all-time high, leaving many investors wondering how much further IWM can rally in 2024. Later in the article, however, I will make the case that a technical breakout is in the works as we wrap up 2023.
YTD Total Returns: Small Caps, Once Negative in October, Now Sport a 19% Gain
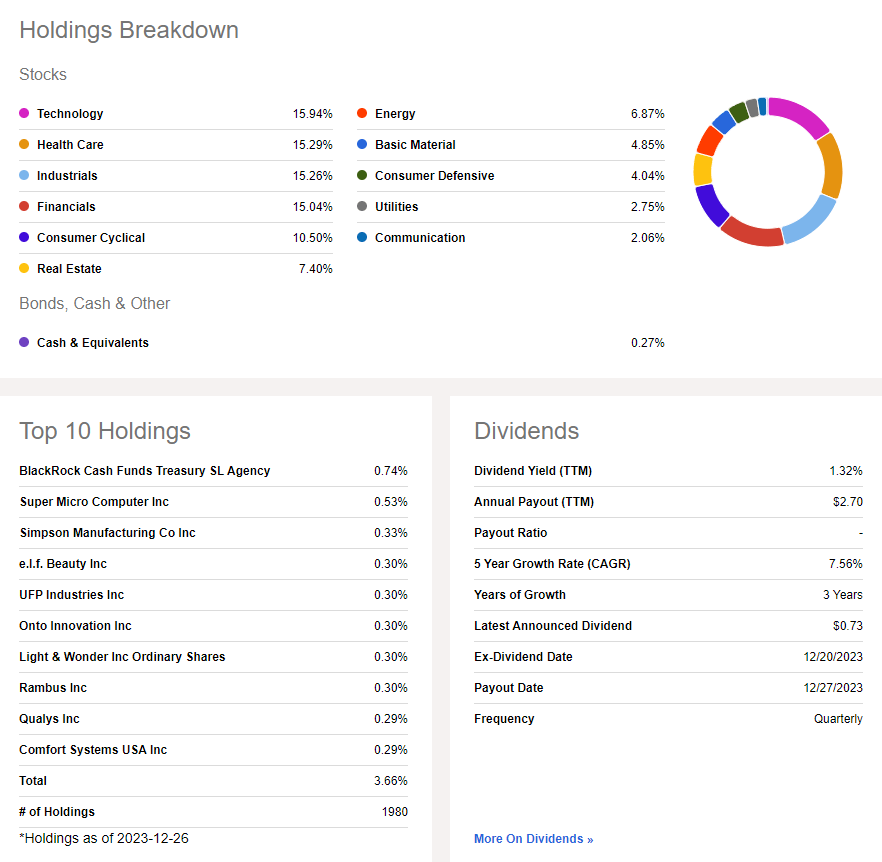
According to the issuer , IWM offers investors exposure to small public US companies and access to 2,000 small-cap domestic stocks in a single fund. The ETF can be used to diversify an asset allocation while seeking long-term growth.
IWM is a large fund with more than $68 billion in assets under management as of December 28, 2023. It pays a small 1.3% trailing 12-month dividend yield and features very strong share-price momentum as we head into 2024. The ETF’s annual expense ratio is modest at 0.19%, though other small-cap index funds feature cheaper fees. Risk is rated poorly by Seeking Alpha ETF Grades, due to a high standard deviation compared to the S&P 500 and elevated short interest. Liquidity is healthy, however, with 90-day average trading volume near 41 million shares and a median 30-day bid/ask spread of just a single basis point.
Digging into the portfolio, IWM has a much different sector composition compared to the SPX, leading to a valuation spread. Though the Information Technology sector is the ETF’s biggest weight, it is about half the position size versus the S&P 500’s 30% allocation to tech. What’s more, there is more exposure to the Real Estate and Energy sectors. There’s also much less single-stock concentration risk with IWM compared to cap-weighted large-cap indexes.
Overall, the two-star, bronze-rated ETF by Morningstar is about evenly split among value, blend, and growth styles and generally has low-quality companies compared to, say, the S&P SmallCap 600 which has certain profitability screens. Forty percent of IWM’s holdings have negative EPS over the last 12 months.
IWM: Holdings & Dividend Information
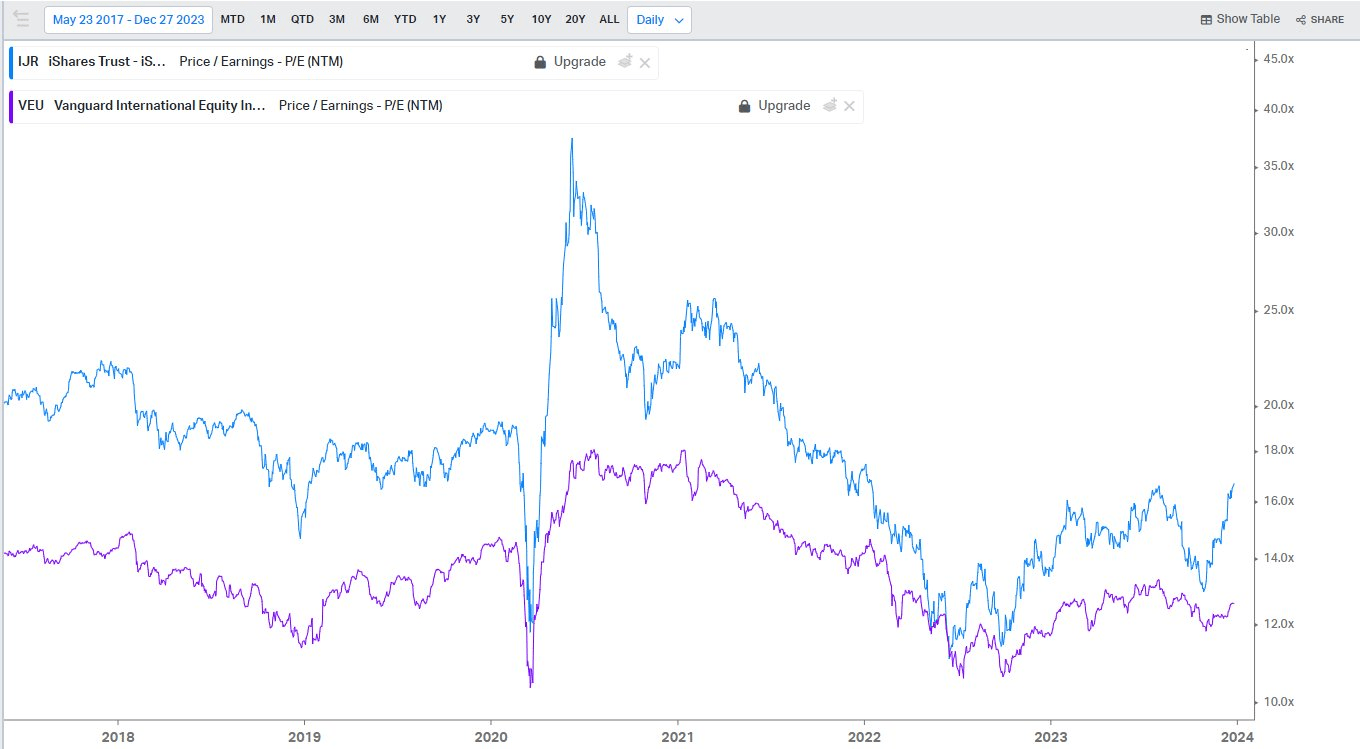
The stark rally in IWM in the last two months has meant a valuation reset. Notice in the price-to-earnings graph below that IWM traded down to about 13 times forward EPS estimates at the low on October 27. I contrasted that to the valuation on the Vanguard FTSE All-World ex-US ETF ( VEU ). IWM now has a P/E reportedly near 17 (though how expected earnings are figured is often different across ETF providers). The point here is that domestic small caps have taken at least three turns higher in their forward P/E whereas non-US stocks remain cheap.
Forward P/E: Small Caps vs Foreign Stocks
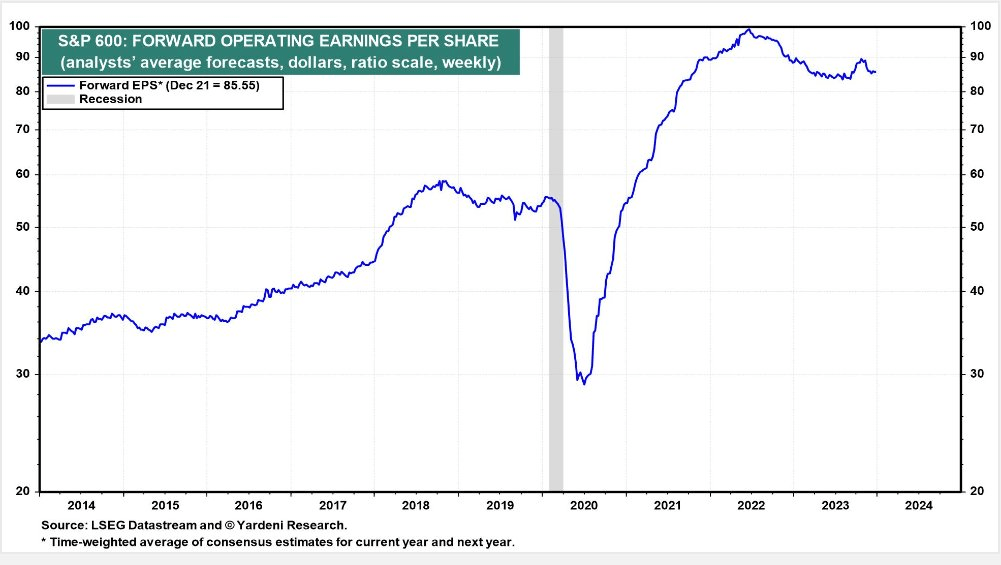
For another look at small cap valuations, I ventured to Ed Yardeni’s site. The chart below illustrates the S&P SmallCap 600’s forward operating earnings outlook. EPS on the S&P 500 is seen hitting a new record next year, above $240 per share, but the SmallCap 600 remains about 15% below its peak-profitability outlook that was notched in mid-2022. In my view, this is constructive as a favorable macro turn over the coming quarters amid a larger nominal economy could lead to a significant profitability rise, not unlike what we saw from mid-2020 through 2021.
Small Cap Earnings Expectations: Flat Over the Last Two Years
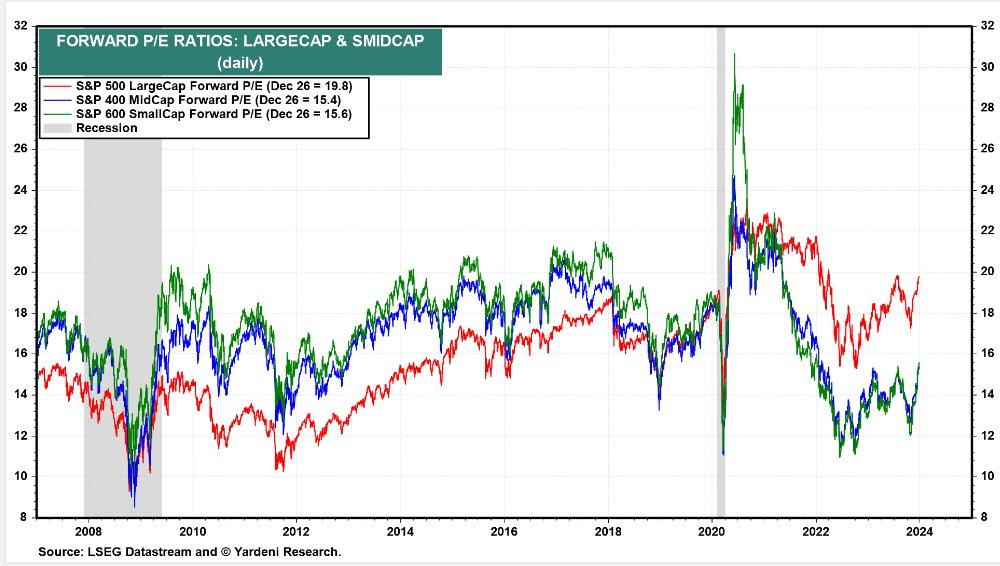
Also found on Yardeni’s graph repository is the valuation comparison among large caps, mid-caps, and small caps. The SmallCap 600 now trades closer to 16x expected earnings estimates, up from a trough of 12. So, I assert that small caps are no longer a screaming buy on valuation. Of course, the SmallCap 600 is a bit different than the Russell 2000, but the valuation trends are often quite similar. Moreover, both indexes are up 26% from the October 27 low.
S&P Index Valuations: Small Caps Turn Less Cheap in Q4
The Technical Take
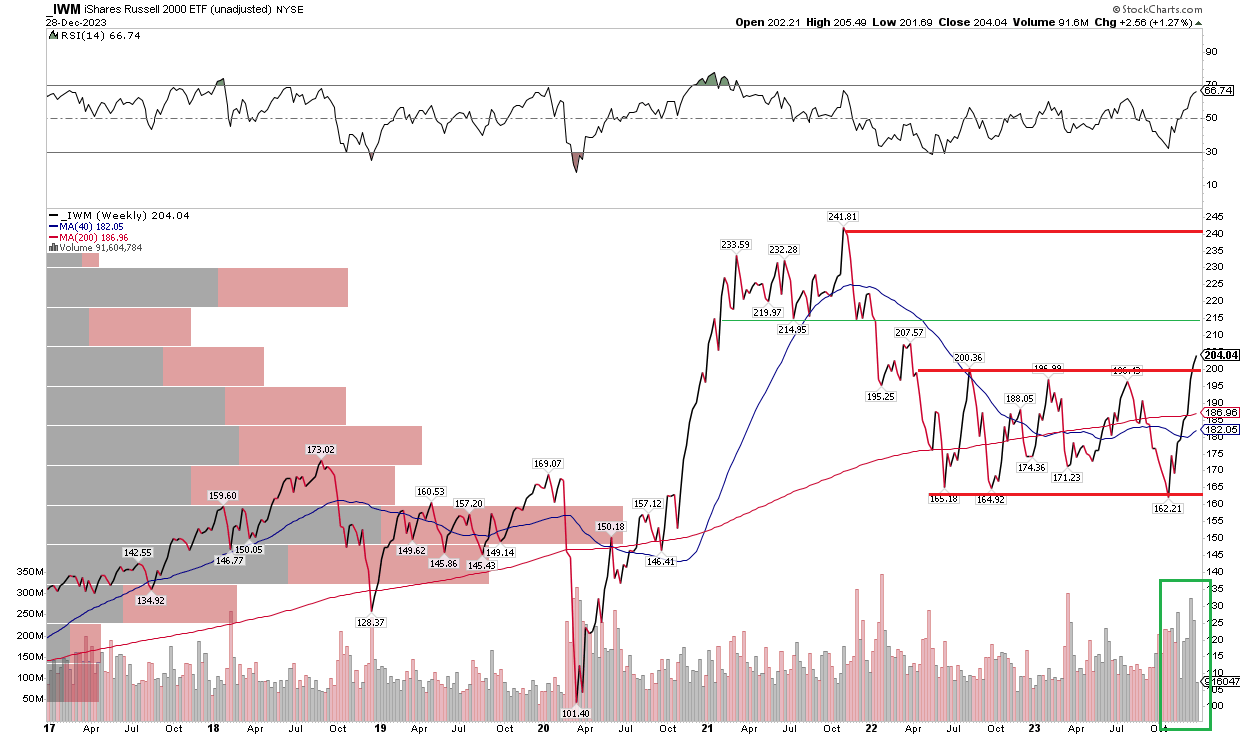
I highlighted that $200 was a key upside target for IWM in my previous analysis. The fund skyrocketed to that level and then some over the last nine weeks. The ETF now aims for a seventh consecutive weekly advance. A close above $200.36 would be a fresh weekly high close dating back to March of 2022, and a technical breakout following three separate rejections at rising above the $200 mark from the middle of last year through Q3 of 2023.
Given that IWM has frustrated the bulls and the bears with a $40 trading range in the last year and a half, if we add that range’s height on top of the breakout point, then a measured-move target to near $240 would be in play. That is also near the November 2021 all-time weekly high close of $242. There could be shorter-term resistance starting at $211 – that's the base of off which IWM ranged throughout much of 2021.
Overall, the technical situation is encouraging given the breakout that is set to take place on a daily, weekly, and monthly closing basis on the date of this writing. A key risk is that the January through March stretch has historically featured volatility, so an early-year cool off in the rally could take place for very short-term traders of the ETF.
IWM: Bullish Breakout From A Wide Range, $240 Upside Target
The Bottom Line
I reiterate my buy rating on IWM. The monster rally in the last two months and more bullish sentiment toward small-cap stocks is somewhat concerning, but the ETF’s valuation is by no means expensive, and a technical breakout appears underway.
For further details see:
IWM: A Valuation Reset Amid A Technical Breakout, Reiterate Buy