CHRD - IWN: Lagging Other Small-Cap Value ETFs For 10 Years
2023-10-25 05:52:34 ET
Summary
- iShares Russell 2000 Value ETF combines two factors of the Fama-French model: size and value.
- IWN may be useful not only in a buy-and-hold approach, but also in tactical allocation strategies.
- IWN has underperformed its parent index and peers in the past 10 years and has some weaknesses in its methodology.
This article series aims at evaluating ETFs (exchange-traded funds) regarding the relative past performance of their strategies and metrics of their current portfolios. Reviews with updated data are posted when necessary.
IWN strategy and portfolio
iShares Russell 2000 Value ETF ( IWN ) started investing operations on 7/24/2000 and tracks the Russell 2000 Value Index. IWN has 1448 holding, a 12-month distribution yield of 2.37% and a total expense ratio of 0.24%.
As described in the prospectus by iShares , the underlying index measures the performance of a small cap segment of the US stock market. It includes companies with " lower price-to-book ratios, lower sales-per-share historical growth and lower forecasted growth " in the parent index Russell 2000. It represents about 48% of the Russell 2000 market value. The portfolio turnover rate in the last fiscal year was 32%.
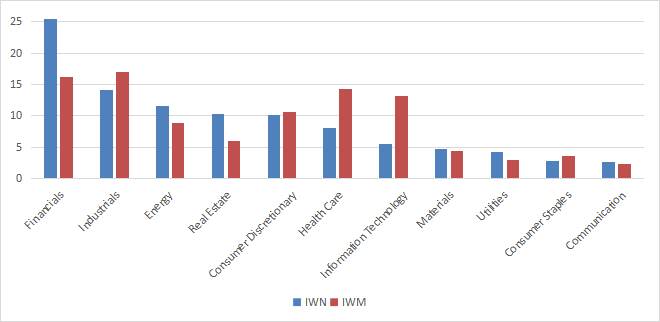
IWN invests almost exclusively in U.S. companies (about 98% of asset value). The top sector is financials, by far (25.5%). Then, come industrials (14.1%), energy (11.5%), real estate (11.3%) and healthcare (10.2%). Other sectors weigh no more than 8% individually and 28% in aggregate. Compared to its parent index Russell 2000 ( IWM ), the fund overweights financials, real estate, and to a lesser extent energy and utilities. It underweights mostly information technology and healthcare. The banking industry comes first at the level 2 GICS breakdown, with a weight about 15%.
IWN is significantly cheaper than its parent index regarding the usual valuation ratios, as expected from a value ETF.
| IWN |
| IWM |
| Price / Earnings TTM |
| 9.33 |
| 12.37 |
| Price / Book |
| 1.23 |
| 1.83 |
| Price / Sales |
| 0.85 |
| 1.12 |
| Price / Cash Flow |
| 5.98 |
| 8.39 |
The top 10 holdings, listed in the next table with valuation ratios, represent only 5.1% of asset value, and the heaviest position weighs less than 0.7%. Therefore, the portfolio is well-diversified and risks related to individual companies are very low. However, keep in mind that the fund is heavy in regional banks, which are correlated.
| Ticker |
| Name |
| Weight (%) |
| P/E TTM |
| P/E fwd |
| P/Sales TTM |
| P/Book |
| P/Net Free Cash Flow |
| Yield% |
| Chord Energy Corp. |
| 0.66 |
| 4.12 |
| 8.53 |
| 1.83 |
| 1.52 |
| 15.88 |
| 7.72 |
| Murphy Oil Corp. |
| 0.64 |
| 7.13 |
| 9.15 |
| 1.91 |
| 1.39 |
| 12.44 |
| 2.39 |
| Matador Resources Co. |
| 0.55 |
| 8.32 |
| 9.37 |
| 2.76 |
| 2.25 |
| 11.56 |
| 1.25 |
| Civitas Resources, Inc. |
| 0.50 |
| 6.39 |
| 7.55 |
| 2.02 |
| 1.25 |
| 21.89 |
| 10.21 |
| PBF Energy, Inc. |
| 0.50 |
| 1.98 |
| 4.04 |
| 0.15 |
| 1.03 |
| 2.94 |
| 1.68 |
| SM Energy Co. |
| 0.47 |
| 4.73 |
| 7.10 |
| 1.91 |
| 1.52 |
| 16.26 |
| 1.43 |
| Essent Group Ltd. |
| 0.46 |
| 7.53 |
| 7.41 |
| 5.08 |
| 1.06 |
| 8.47 |
| 2.13 |
| SouthState Corp. |
| 0.46 |
| 9.18 |
| 9.59 |
| 2.45 |
| 0.94 |
| 3.70 |
| 3.20 |
| UFP Industries, Inc. |
| 0.45 |
| 10.60 |
| 11.68 |
| 0.72 |
| 2.08 |
| 7.16 |
| 1.25 |
| Commercial Metals Co. |
| 0.44 |
| 5.52 |
| 7.44 |
| 0.54 |
| 1.15 |
| 7.17 |
| 1.60 |
Since 8/1/2000, IWN has outperformed its parent index by 1.1% in annualized return, and it shows similar risk metrics (maximum drawdown and historical volatility).
| Total Return |
| Annual Return |
| Drawdown |
| Sharpe ratio |
| Volatility |
| IWN |
| 470.03% |
| 7.78% |
| -61.55% |
| 0.41 |
| 19.78% |
| IWM |
| 347.71% |
| 6.67% |
| -59.05% |
| 0.35 |
| 20.05% |
Data calculated with Portfolio123
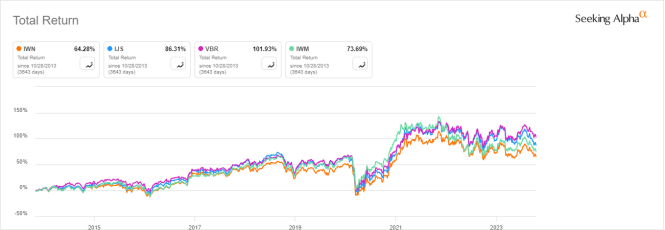
The next chart compares 10-year total returns of IWN, IWM and two small-cap value ETFs:
- iShares S&P Small-Cap 600 Value ETF ( IJS ), reviewed here ,
- Vanguard Small Cap Value Index Fund ( VBR ).
Two other ETFs tracking the same index as IJS are not represented on the chart: Vanguard S&P SmallCap 600 Value ETF ( VIOV ) and SPDR S&P 600 SmallCap Value ETF ( SLYV ).
IWN is the worst performer, even lagging its parent index.
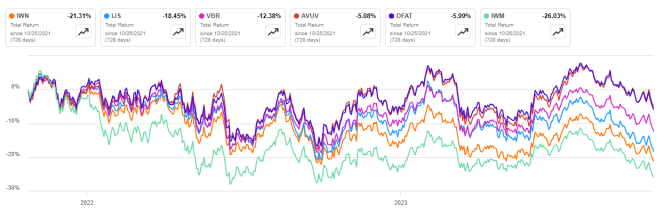
The next chart zooms on the last 2 years and adds two newer small cap value ETFs, which are actively managed:
- Avantis U.S. Small Cap Value ETF ( AVUV ),
- Dimensional U.S. Targeted Value ETF ( DFAT ), reviewed here .
On this shorter time interval, IWN beats its parent index, but it still lags behind competitors. The actively managed ETFs are leading.
Comparing IWN with my value benchmark
The Dashboard List is a list of 80 stocks in the S&P 1500 index, updated every month based on a simple quantitative methodology. All stocks in the Dashboard List are cheaper than their respective industry median in Price/Earnings, Price/Sales and Price/Free Cash Flow. After this filter, the 10 companies with the highest Return on Equity in every sector are kept in the list. Some sectors are grouped together: energy with materials, communication with technology. Real estate is excluded because these valuation metrics don't work well in this sector. I have been updating the Dashboard List every month on Seeking Alpha since December 2015, first in free-access articles, then in Quantitative Risk & Value.
The next table compares IWN performance since 8/1/2000 with the Dashboard List model, with a tweak: the list is reconstituted once a year to make it comparable with a passive index.
| Total Return |
| Annual Return |
| Drawdown |
| Sharpe ratio |
| Volatility |
| IWN |
| 470.03% |
| 7.78% |
| -61.55% |
| 0.41 |
| 19.78% |
| Dashboard List (annual) |
| 1113.27% |
| 11.34% |
| -58.12% |
| 0.62 |
| 17.32% |
Past performance is not a guarantee of future returns.
The Dashboard List outperforms IWN by 3.6% in annualized return. However, ETF performance is real, while the model is simulated and hypothetical.
Price to Book: A risky concept of value
I like the idea of mixing various ratios to rank value stocks. However, I think most value indexes doing so have two weaknesses, and IWS is no exception. The first one is to classify all stocks on the same criteria. It means the valuation ratios are considered comparable across sectors and industries. Obviously, they are not: my monthly dashboard here shows how valuation and quality metrics may vary across sectors. A few ETFs have a more sophisticated approach, like Fidelity Value Factor ETF (FVAL), reviewed here , and actively managed value funds by Avantis and Dimensional.
The second weakness comes from the price/book ratio (P/B), which adds some risk in the strategy. Historical data show that a large group of companies with low P/B has a higher volatility and deeper drawdowns than a same-size group with low price/earnings, price/sales or price/free cash flow. The next table shows the return and risk metrics of the cheapest quarter of the S&P 500 (i.e. 125 stocks) measured in price/book, price/earnings, price/sales and price/free cash flow. The sets are reconstituted annually between 1/1/2000 and 1/1/2023 with elements in equal weight.
| Annual Return |
| Drawdown |
| Sharpe ratio |
| Volatility |
| Cheapest quarter in P/B |
| 8.54% |
| -81.55% |
| 0.35 |
| 37.06% |
| Cheapest quarter in P/E |
| 10.71% |
| -73.62% |
| 0.48 |
| 25.01% |
| Cheapest quarter in P/S |
| 12.82% |
| -76.16% |
| 0.47 |
| 34.83% |
| Cheapest quarter in P/FCF |
| 15.32% |
| -74.77% |
| 0.61 |
| 27.03% |
Data calculated with Portfolio123
This explains why I use P/FCF and not P/B in the Dashboard List model.
Takeaway
iShares Russell 2000 Value ETF combines two factors of the Fama-French model , size and value: it is focused on small caps with value characteristics. IWN may be useful not only in a buy-and-hold approach, but also in tactical allocation strategies. For example, active investors may want to switch between value and growth investing styles, or between small and large cap segments. IWN has beaten its parent index since inception, but it has been lagging in the last 10 years. The portfolio is well-diversified across holdings, but it is overweight in financials, which may be a factor of risk. Moreover, the underlying index has two fundamental weaknesses: ranking stocks regardless of their industries, and relying too much on the price/book ratio.
For further details see:
IWN: Lagging Other Small-Cap Value ETFs For 10 Years