PSX - IWS: A Well-Diversified Mid-Cap ETF
2023-09-20 17:32:24 ET
Summary
- iShares Russell Mid-Cap Value ETF classifies mid-cap stocks in value and growth subsets, and invests in the value part.
- The IWS ETF is diversified across sectors and holdings.
- It is on par with its parent index and its main competitor regarding historical performance and risk metrics.
- Most value indexes have two shortcomings.
This article series aims at evaluating ETFs (exchange-traded funds) regarding past performance and portfolio metrics. Reviews with updated data are posted when necessary.
IWS strategy and portfolio
iShares Russell Mid-Cap Value ETF ( IWS ) started investing operations on 7/17/2001 and tracks the Russell Midcap Value Index. It has 701 holdings, a distribution yield of 1.8%, and an expense ratio of 0.23%.
As described in the prospectus by iShares :
" The Underlying Index measures the performance of equity securities of Russell Midcap Index issuers with relatively lower price-to book ratios, lower sales-per-share historical growth and lower forecasted growth. "
It represents about 63% of the total market value of the Russell Midcap Index. The turnover was 19% of the average value of its portfolio in the last fiscal year.
IWS invests almost exclusively in U.S. based companies (98.6% of asset value). Hereafter, I will use as a benchmark the parent index represented by the iShares Russell Mid-Cap ETF ( IWR ). I will also compare it with one of its main competitor, iShares S&P Mid-Cap 400 Value ETF ( IJJ ), which has been tracking the S&P Mid-Cap 400 Value Index since July 2000 and was reviewed here . Two other ETFs are based on the same index: SPDR S&P 400 Mid-Cap Value ETF ( MDYV ) and Vanguard S&P Mid-Cap 400 Value ETF ( IVOV ).
As expected, IWS is cheaper than IWR regarding valuation ratios, reported in the next table. However, IJJ does better in this matter.
| IWS |
| IWR |
| IJJ |
| Price/Earnings TTM |
| 15.65 |
| 17.62 |
| 13.39 |
| Price/Book |
| 2.12 |
| 2.67 |
| 1.72 |
| Price/Sales |
| 1.41 |
| 1.6 |
| 0.93 |
| Price/Cash Flow |
| 10.98 |
| 12.52 |
| 9.76 |
The top 2 sectors are industrials and financials for the 3 funds, which are also well diversified: all sector weights are below 20%. Compared to the mid-cap benchmark IWR, IWS significantly underweights technology and healthcare. Compared to its competitor IJJ, it overweights mostly utilities, energy, communication, and massively underweights consumer discretionary.
IWS sector breakdown in % (Chart: author; data: iShares)
The top 10 holdings of IWS, listed in the next table with valuation ratios, represent 6.6% of asset value. All constituents are under 1%, so the portfolio is widely diversified, and risks related to individual companies are very low.
| Ticker |
| Name |
| Weight |
| P/E TTM |
| P/E fwd |
| P/Sales TTM |
| P/Book |
| P/Net Free Cash Flow |
| Yield % |
| Phillips 66 |
| 0.79 |
| 5.22 |
| 7.42 |
| 0.36 |
| 1.83 |
| 9.47 |
| 3.49 |
| Parker-Hannifin Corporation |
| 0.72 |
| 24.47 |
| 17.38 |
| 2.68 |
| 4.94 |
| 26.92 |
| 1.51 |
| Arthur J. Gallagher & Co. |
| 0.68 |
| 45.96 |
| 26.92 |
| 5.63 |
| 4.97 |
| 44.28 |
| 0.93 |
| Aflac Incorporated |
| 0.67 |
| 10.36 |
| 12.86 |
| 2.48 |
| 2.28 |
| 20.98 |
| 2.17 |
| Marvell Technology, Inc. |
| 0.66 |
| N/A |
| 35.28 |
| 8.29 |
| 3.03 |
| 83.09 |
| 0.44 |
| Carrier Global Corporation |
| 0.64 |
| 21.37 |
| 20.68 |
| 2.10 |
| 5.75 |
| 30.94 |
| 1.37 |
| PACCAR, Inc. |
| 0.63 |
| 12.25 |
| 9.99 |
| 1.37 |
| 2.96 |
| 50.10 |
| 3.46 |
| Welltower, Inc. |
| 0.6 |
| 342.92 |
| 130.09 |
| 6.77 |
| 1.98 |
| N/A |
| 2.91 |
| The Williams Companies, Inc. |
| 0.6 |
| 15.81 |
| 17.90 |
| 3.88 |
| 3.59 |
| 66.29 |
| 5.22 |
| ON Semiconductor Corporation |
| 0.58 |
| 21.61 |
| 18.04 |
| 5.06 |
| 6.05 |
| 35.59 |
| 0 |
Performance
Since 8/1/2001, IWS, IWR and IJJ have almost identical performance and risk metrics, as reported in the next table. The difference of 24 bps in annualized return is insignificant.
| Total Return |
| Annual Return |
| Drawdown |
| Sharpe Ratio |
| Volatility |
| IWS |
| 539.95% |
| 8.75% |
| -62.49% |
| 0.5 |
| 17.56% |
| IWR |
| 571.47% |
| 8.98% |
| -58.78% |
| 0.53 |
| 17.37% |
| IJJ |
| 569.25% |
| 8.97% |
| -58.00% |
| 0.5 |
| 18.74% |
Data calculated with Portfolio123.
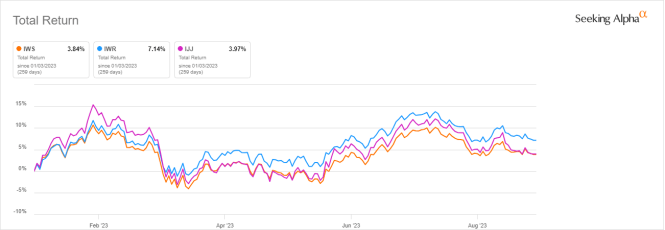
In 2023 to date, the two value funds are tied and slightly behind the mid-cap benchmark:
IWS, IWR, IJJ, year-to-date (Seeking Alpha)
Comparing IWS with my Dashboard List model
The Dashboard List is a list of 60 to 80 stocks in the S&P 1500 index, updated every month based on a simple quantitative methodology. All stocks in the Dashboard List are cheaper than their respective industry median in Price/Earnings, Price/Sales and Price/Free Cash Flow. An exception in Utilities: the Price/Free Cash Flow is not taken into account to avoid some inconsistencies. Then, the 10 eligible companies with the highest Return on Equity in every sector are kept in the list. Some sectors are grouped together: energy with materials, communication with technology. Real Estate is excluded because these valuation metrics don't work well in this sector. I have been updating the Dashboard List every month on Seeking Alpha since December 2015, first in free-access articles, then in Quantitative Risk & Value.
The next table compares IWS with the Dashboard List model since 8/1/2001, with a tweak: here, the list is reconstituted once a year to make it comparable with a passive index.
| Total Return |
| Annual.Return |
| Drawdown |
| Sharpe ratio |
| Volatility |
| IWS |
| 539.95% |
| 8.75% |
| -62.49% |
| 0.5 |
| 17.56% |
| Dashboard List (annual) |
| 878.05% |
| 10.85% |
| -58.12% |
| 0.61 |
| 17.51% |
Past performance is not a guarantee of future returns. Data Source: Portfolio123.
The Dashboard List outperforms IWS by 2.1 percentage points in annualized return. A note of caution: ETF performance is real, whereas the model is simulated.
IWS fundamental shortcomings
I like the idea of mixing various ratios to rank value stocks. However, I think most value indexes doing so have two weaknesses, and IWS is no exception. The first one is to classify all stocks on the same criteria. It means the valuation ratios are considered comparable across sectors and industries. Obviously, they are not: my monthly dashboard here shows how valuation and quality metrics may vary across sectors. A few ETFs have a more sophisticated approach, like Fidelity Value Factor ETF ( FVAL ), reviewed here , and some actively managed value funds, in particular by Avantis and Dimensional (an example here ).
The second weakness comes from the price/book ratio (P/B), which adds some risk in the strategy. Historical data show that a large group of companies with low P/B has a higher volatility and deeper drawdowns than a same-size group with low price/earnings, price/sales or price/free cash flow. The next table shows the return and risk metrics of the cheapest quarter of the S&P 500 (i.e., 125 stocks) measured in price/book, price/earnings, price/sales and price/free cash flow. The sets are reconstituted annually between 1/1/2000 and 1/1/2023 with elements in equal weight.
| Annual.Return |
| Drawdown |
| Sharpe ratio |
| Volatility |
| Cheapest quarter in P/B |
| 8.54% |
| -81.55% |
| 0.35 |
| 37.06% |
| Cheapest quarter in P/E |
| 10.71% |
| -73.62% |
| 0.48 |
| 25.01% |
| Cheapest quarter in P/S |
| 12.82% |
| -76.16% |
| 0.47 |
| 34.83% |
| Cheapest quarter in P/FCF |
| 15.32% |
| -74.77% |
| 0.61 |
| 27.03% |
Data calculated with Portfolio123.
This explains why I use P/FCF and not P/B in the Dashboard List model.
Takeaway
iShares Russell Mid-Cap Value ETF classifies mid-cap stocks in value and growth subsets based on fundamental ratios, and invests in the value subset. The portfolio is well-diversified across sectors and holdings.
iShares Russell Mid-Cap Value ETF may be used in a tactical allocation strategy switching between value and growth, or between large and mid-caps, depending on relative strength indicators. However, as a buy-and-hold investment, it has failed to bring excess return over its parent index since 2001. Competitors tracking the S&P Mid-Cap 400 Value Index have not done better (IJJ, MDYV, IVOV). Most value indexes have two weaknesses in my opinion: they rank stocks regardless of their industries, and they rely too much on the price/book ratio.
For further details see:
IWS: A Well-Diversified Mid-Cap ETF