HIPS - IYLD: Diversification Doesn't Help This High-Yield ETF
2023-05-05 17:44:14 ET
Summary
- iShares Morningstar Multi-Asset Income ETF is a fund of funds with a 5%+ yield.
- The IYLD ETF implements a multi-asset strategy targeting 60% in bonds, 20% in equities, and 20% in alternative securities.
- IYLD has lagged three other multi-asset income funds since 2018.
- It has lost 24% in share price and 34% in annualized distributions since inception.
- Bonus: how to avoid capital decay in high-yield funds.
This article series aims at evaluating ETFs (exchange-traded funds) regarding the relative past performance of their strategies and metrics of their current portfolios. Reviews with updated data are posted when necessary.
Strategy and portfolio
iShares Morningstar Multi-Asset Income ETF ( IYLD ) is a high-yield fund with a 12-month trailing yield of 5.57% and 9 holdings, which are also iShares ETFs. The total expense ratio is 0.58%, including management fees of 0.25% and acquired fund expenses of 0.33%. It pays monthly distributions. It was launched on 4/3/2012 and tracks a "fund of funds" model: the Morningstar Multi-Asset High Income Index.
As described in the prospectus by iShares , the underlying index selects a set of funds to target an allocation of 20% in equities, 60% in fixed income, and 20% in alternative income sources. The current holdings are listed in the next table. During the most recent fiscal year, the portfolio turnover was 73% of its average value.
| Ticker |
| Name |
| Type |
| Asset Class |
| Weight % |
| iShares iBoxx $ High Yield Corporate Bond |
| ETF |
| Junk Bonds |
| 20.65 |
| iShares 1-5 Year Investment Grade Corporate Bond |
| ETF |
| Corporate Bonds |
| 15.48 |
| iShares Floating Rate Bond |
| ETF |
| Corporate/Supranational Bonds |
| 15.18 |
| iShares Emerging Markets Dividend |
| ETF |
| Emerging Mkts Stocks |
| 10 |
| iShares International Select Dividend |
| ETF |
| Ex-US Developed Mkts Stocks |
| 9.9 |
| iShares Preferred and Income Securities |
| ETF |
| US Preferred Stocks |
| 9.5 |
| iShares Mortgage Real Estate Capped |
| ETF |
| Mortgage REITs |
| 8.74 |
| iShares J.P. Morgan EM Local Currency Bond |
| ETF |
| Emerging Mkts Bonds |
| 5.49 |
| iShares 1-3 Year Treasury Bond |
| ETF |
| Short-term US T-bonds |
| 4.96 |
It appears in the list that "alternative income sources" are preferred stocks, PFF, and mortgage REITs, REM. In fact, when digging in sub-holdings, the three heaviest ones are mortgage REITs: AGNC Investment Corp. ( AGNC ) with 1.6% of assets, Annaly Capital Management, Inc. ( NLY ) with 0.97%, and Starwood Property Trust, Inc. ( STWD ) with 0.89%.
About 58% of assets is invested in U.S. securities. No other country weighs more than 5%. Direct exposure to geopolitical and regulatory risks related to China is low: 4.73% (this is the sum of China and Taiwan securities weights).
Performance
The next table compares IYLD since inception in April 2012 with a portfolio composed of 60% bonds and 40% equities, which is a relevant benchmark regarding the underlying index definition.
| Total Return |
| Annual.Return |
| Drawdown |
| Sharpe Ratio |
| Volatility |
| IYLD |
| 30.43% |
| 2.43% |
| -30.23% |
| 0.2 |
| 10.08% |
| 40% SPY + 60% BND |
| 92.40% |
| 6.09% |
| -18.90% |
| 0.75 |
| 7.03% |
IYLD lags by 3.6% in annualized return and shows a much higher risk measured in drawdown and standard deviation of monthly returns (volatility).
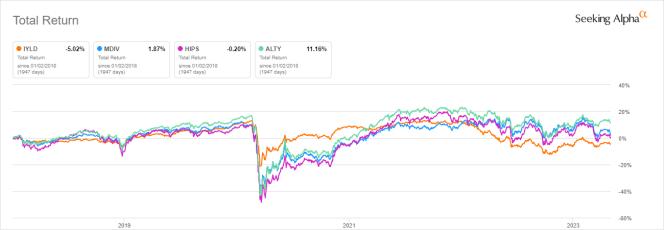
The next chart compares total returns since 1/1/2018 of IYLD and 3 other multi-asset high-yield ETFs: The First Trust Multi-Asset Diversified Income Index Fund ( MDIV ), reviewed here , the GraniteShares HIPS US High Income ETF ( HIPS ), reviewed here , and the Global X Alternative Income ETF ( ALTY ), reviewed here . These funds are competitors, but they are structured in different ways across asset classes: follow the review links above for more information.
IYLD vs. Competitors since 1/1/2018 (Seeking Alpha)
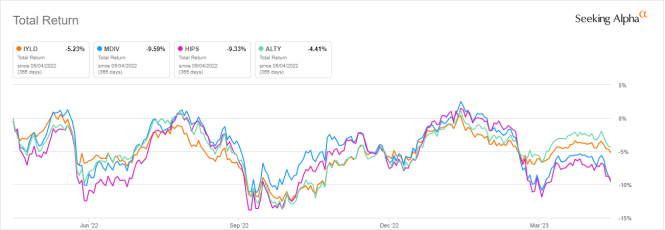
IYLD is the worst performer. However, it has outperformed MDIV and HIPS in the last 12 months:
IYLD vs. Competitors, 12-month total return (Seeking Alpha)
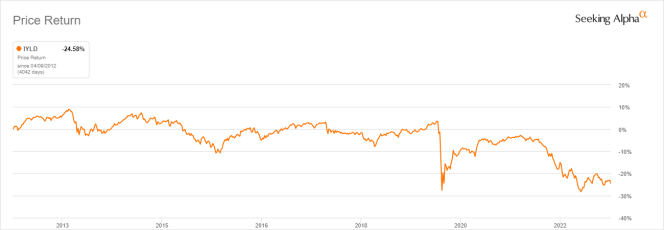
The annualized return including distributions is below the distribution rate: this is a clue of capital decay. The share price history confirms it: it has lost over 24% since inception.
IYLD share price history (Seeking Alpha)
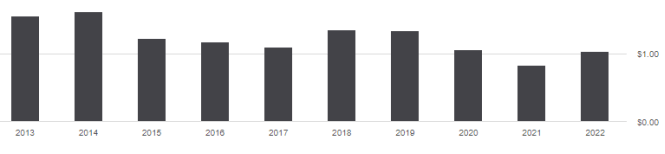
The annual sum of distributions went down from $1.56 per share in 2013 to $1.03 in 2022. For shareholders, it means an income loss of 34% in 9 years, whereas the cumulative inflation has been about 27% in the same time (based on CPI).
IYLD distribution history (Seeking Alpha)
This decay in capital and income is not specific to IYLD: most funds with high yields have suffered from capital decay since inception. IYLD may be useful for swing trading, tactical allocation or capturing some market anomalies. However, historical data show it is a risky long-term investment.
Bonus: How to avoid capital decay in high-yield funds
Capital and income decay is an issue in many closed-end funds, like in high-yield ETFs. However, it may be avoided or mitigated by rotational strategies. I designed a 5-factor ranking system in 2016 and monitored its performance for several years. I started publishing the eight best-ranked CEFs in Quantitative Risk & Value ((QRV)) after the March 2020 meltdown. The list is updated every week. It isn't a model portfolio: trading the list every week is too costly in spreads and slippage. Its purpose is helping investors find funds with a good entry point. In the table below, I give the hypothetical example of starting a portfolio on 3/25/2020 with my initial "Best 8 Ranked CEFs" list and updating it every 3 months, ignoring intermediate updates. Return is calculated with holdings in equal weight and reinvesting dividends at the beginning of every 3-month period.
| Since 3/25/2020 |
| Total Return |
| Annual.Return |
| Drawdown |
| Sharpe Ratio |
| Volatility |
| Best 8 CEFs quarterly |
| 124.06% |
| 29.73% |
| -20.60% |
| 1.27 |
| 20.14% |
| YYY |
| 12.86% |
| 3.98% |
| -22.87% |
| 0.24 |
| 11.91% |
| SPY |
| 76.43% |
| 20.11% |
| -24.50% |
| 0.93 |
| 18.95% |
This simulation is not a real portfolio and not a guarantee of future return.
Of course, past performance (real or simulated) is not representative of future return. However, I think a time-tested rotational strategy in CEFs has a much better chance to protect both capital and income streams against erosion and inflation than a high-yield ETF.
For further details see:
IYLD: Diversification Doesn't Help This High-Yield ETF