HIPS - IYLD: Shrinking Capital And Income
Summary
- iShares Morningstar Multi-Asset Income ETF is a multi-asset income exchange-traded fund.
- IYLD is a fund of funds, with about 60% in bond ETFs and 40% in equity ETFs.
- It has lagged 3 other multi-asset income ETFs since 2015.
- Since inception, IYLD share price is down by 23%, and annualized distributions are down by 30%.
Strategy and portfolio
The iShares Morningstar Multi-Asset Income ETF ( IYLD ) is a high-yield fund with a 12-month trailing yield of 4.91%, and 9 exchange-traded fund ("ETF") holdings. The net expense ratio of 0.58% includes management fees (0.25%) and acquired funds expenses (0.33%). It pays monthly distributions. It was launched on 4/3/2012 and tracks the Morningstar Multi-Asset High Income Index, which is a “fund of funds” strategy.
As described in the prospectus by iShares , the underlying index aims at an allocation of 20% equities, 60% fixed income and 20% “alternative income sources” through underlying funds. The current holdings are listed in the next table. During the most recent fiscal year, the portfolio turnover was 73% of its average value.
| Ticker |
| Name |
| Type |
| Sub-Holdings |
| Weight % |
| ISHARES IBOXX $ HIGH YIELD CORP BD |
| ETF |
| Junk Bonds |
| 19.87 |
| ISHARES JPMORGAN USD EMERGING MKT |
| ETF |
| Emerging Mkts Bonds |
| 15.20 |
| ISHARES 1-5 YR INV GRD CORP BD ETF |
| ETF |
| Corporate Bonds |
| 15.01 |
| ISHARES INTERNATIONAL SELECT DIVID |
| ETF |
| Ex-US Developed Mkts Stocks |
| 10.41 |
| ISHARES EMERGING MARKETS DIVIDEND |
| ETF |
| Emerging Mkts Stocks |
| 10.06 |
| ISHARES PREFERRED AND INCOME SECUR |
| ETF |
| US Preferred Stocks |
| 9.84 |
| ISHARES MORTGAGE REAL ESTATE ETF |
| ETF |
| Mortgage REITs |
| 9.43 |
| ISHARES JP MORGAN EM LOCAL CURR |
| ETF |
| Emerging Mkts Bonds |
| 5.09 |
| ISHARES FLOATING RATE BOND ETF |
| ETF |
| Corporate/Supranational Bonds |
| 4.98 |
It appears in the list that the 20% of alternative investments is in preferred stocks ( PFF ) and mortgage REITs ( REM ), almost in equal weight.
The U.S. come first in the geographical exposure with about 48%. No other country weigh more than 4%. Direct exposure to geopolitical and regulatory risks related to China is low: 3.18%.
Performance
The next table compares IYLD since inception in 2012 with a benchmark composed of 60% bonds and 40% equities, which appears as quite relevant regarding the underlying index definition. Distributions are reinvested.
| Total Return |
| Annual.Return |
| Drawdown |
| Sharpe ratio |
| Volatility |
| IYLD |
| 30.12% |
| 2.48% |
| -30.34% |
| 0.15 |
| 9.87% |
| 60% BND + 40% SPY |
| 84.49% |
| 5.87% |
| -18.90% |
| 0.73 |
| 6.92% |
IYLD lags by 2.4 percentage points annualized, and shows a much higher risk measured in drawdown and standard deviation of monthly returns (volatility).
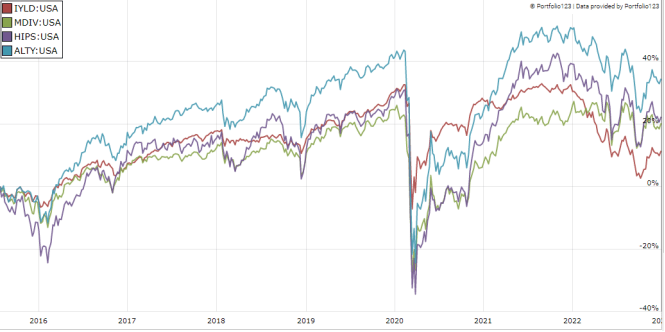
The next chart compares total returns of IYLD with 3 other multi-asset high yield ETFs: the Multi-Asset Diversified Income Index Fund ( MDIV ), reviewed here , the GraniteShares HIPS US High Income ETF ( HIPS ), reviewed here , and the Global X Alternative Income ETF ( ALTY ), reviewed here . These products are competitors, but they are structured in different ways across asset classes: follow the review links above for more information. The chart starts on 8/1/2015 to match inception dates.
IYLD vs. Competitors since August 2015 (Portfolio123)
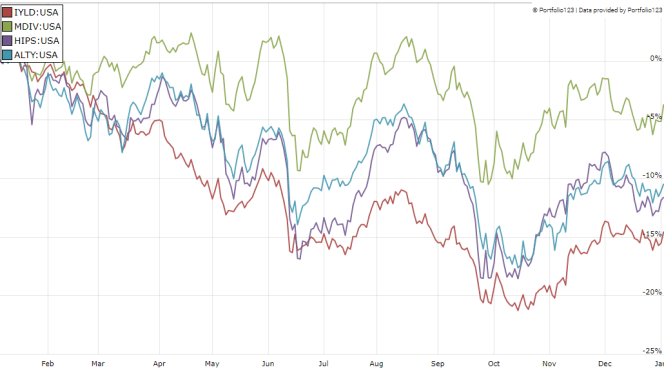
IYLD is the worst performer. It has also lagged in the last 12 months:
IYLD vs. Competitors, last 12 months (Portfolio123)
The annualized return since inception, reinvesting distributions, is below the distribution rate. This is a red flag pointing to capital decay. It is confirmed by IYLD share price history: it has lost over 23% since inception as of writing.
IYLD share price, without dividends (TradingView on SeekingAlpha)
Moreover, the annual sum of distributions per share went down from $1.49 in 2013 to $1.03 in 2022, based on payable dates ( source ). For shareholders, it means an income loss of over 30% in 9 years.
This decay in capital and income is not a management issue: it's difficult to make a good recipe with bad ingredients. High-yield securities often suffer from capital decay (there are rare exceptions). IYLD can be useful for swing trading or tactical allocation, but history shows it may be harmful as a long-term investment. This is true for most high-yield funds, not only this one. This kind of funds exist because some investors are willing to buy them.
How to manage capital decay in high yield securities
Capital and income decay is an issue in many closed-end funds, like in high yield ETFs. However, it can be avoided or mitigated by rotational strategies, instead of using funds as buy-and-hold instruments. I designed a 5-factor ranking system in 2016, and monitored its performance during several years. I started publishing the eight best ranked closed-end funds ("CEFs") in Quantitative Risk & Value (QRV) after the March 2020 meltdown. The list is updated every week. Its average dividend yield varies around 7%. It's not a model portfolio: trading the list every week is too costly in spreads and slippage. Its purpose is helping investors find funds with a good entry point. In the table and chart below, I give the hypothetical example of starting a portfolio on 3/25/2020 with my initial “Best 8 Ranked CEFs” list and updating it every 3 months since then, ignoring intermediate updates. Return is calculated using closing prices, with holdings in equal weights and reinvesting dividends at the beginning of every 3-month period.
| since 3/25/2020 |
| Total Return |
| Annual.Return |
| Drawdown |
| Sharpe ratio |
| Volatility |
| Best 8 CEFs quarterly |
| 122.14% |
| 33.23% |
| -20.60% |
| 1.43 |
| 20.43% |
| IYLD |
| 11.05% |
| 3.84% |
| -22.87% |
| 0.21 |
| 11.93% |
| SPY |
| 62.17% |
| 18.98% |
| -24.50% |
| 0.87 |
| 19.69% |
This simulation is not a real portfolio and not a guarantee of future return (Chart: author; data: Portfolio123)
The “Best 8” model shows a positive total return in 2022, about 8%. Of course, past performance (real or simulated) is not representative of future return. It is unlikely to perform as well in the near future as since March 2020. The 2020 meltdown and 2022 volatility resulted in price dislocations and exceptional opportunities in the CEF universe. However, I think a time-tested rotational strategy in CEFs has a much better chance to protect both capital and income stream against erosion and inflation than a high-yield passive investment.
For further details see:
IYLD: Shrinking Capital And Income