XLK - IYW: How This Fund Will Maintain First Place Among Big Tech ETFs
2023-11-11 02:39:25 ET
Summary
- iShares U.S. Technology ETF is expected to outperform its competitor big tech ETFs due to its heavier holding of Alphabet Inc. (GOOG/GOOGL) and exclusion of ACN and TSLA.
- IYW has historically shown superior performance compared to other big tech ETFs, with its greatest lead in 2021 and over the past year.
- While IYW has a higher expense ratio and lower dividend yield compared to its peers, it has historically provided greater returns to investors.
Investment Thesis
iShares U.S. Technology ETF ( IYW ) warrants a buy rating due to its capacity to outperform its competitor big tech ETFs in the coming years. This is predominantly due to its heavier holding of Alphabet Inc., ( GOOG )/( GOOGL ), driven by strong potential earnings for Google's Gemini, YouTube ads, and the Search Generative Experience. Furthermore, IYW lacks holdings of Accenture ( ACN ) and ( TSLA ), both of which saw negative net income growth and EPS growth in Q3 '23. These differences in holdings will set IYW apart from other leading tech ETFs over at least the next year, continuing its superior performance in the big tech ETF category.
Fund Overview
IYW is an ETF that, according to iShares, seeks to track the investment results of an index composed of U.S. equities in the technology sector. The benchmark index that IYW most closely tracks is the Russell 1000 Technology RIC 22.5/45 Capped Index. Key peer competitor ETFs that most closely match IYW's objectives are the Vanguard Information Technology ETF ( VGT ), Invesco QQQ ETF ( QQQ ), and Technology Select Sector SPDR ETF ( XLK ). While VGT and XLK exclusively contain information technology sector holdings, IYW and QQQ are not constrained by this sector and include communication sector holdings.
Performance, Expense Ratio, and Dividend Yield
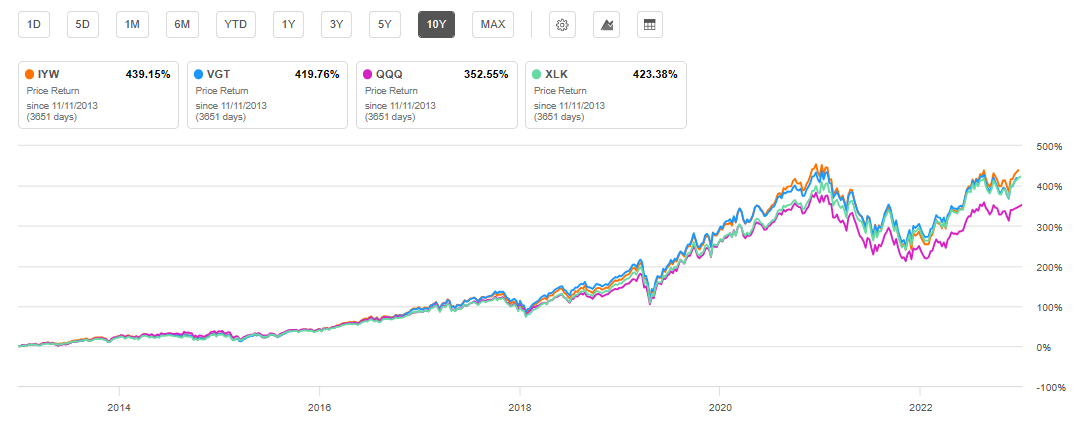
IYW has enjoyed superior performance compared to VGT, QQQ, and XLK in both 1YR and 10YR time frames. Notably, IYW's greatest lead among competitors was in 2021 and over the past year. These leads can be predominantly credited to both the holdings that IYW contains, and holdings that it excludes, in comparison to peer ETFs. For example, in 2021 while VGT, QQQ, and XLK all had at least 2% weights on PayPal ( PYPL ), IYW excluded the holding. I will cover more on this later.
IYW Performance Compared to Peer Competitor ETFs (Seeking Alpha)
While IYW has led big tech ETFs over most time periods in performance, the fund has two primary downsides. The first is its expense ratio. With a 0.40% expense ratio, IYW is the most expensive of compared big tech ETFs. Not surprisingly, Vanguard's fund ties for the lowest expense ratio at 0.10%. However, IYW has outperformed other lead tech ETFs even when factoring in the higher expense ratio.
The other downside for IYW is its low dividend yield at 0.40%, compared to other peer ETFs that have a dividend yield between 0.50% to 0.90%. IYW also has the lowest 5-year dividend growth. When factoring in higher expense ratio and lower dividend yield, IYW has still historically provided greater returns to investors.
Expense Ratio, AUM, and Dividend Yield Comparison
| IYW |
| VGT |
| QQQ |
| XLK |
| Expense Ratio |
| 0.40% |
| 0.10% |
| 0.20% |
| 0.10% |
| AUM |
| 12.30B |
| 57.10B |
| 205.53B |
| 50.83B |
| Dividend Yield |
| 0.37% |
| 0.74% |
| 0.59% |
| 0.80% |
| Dividend Growth 5 YR ((CAGR)) |
| 2.43% |
| 13.21% |
| 10.52% |
| 7.75% |
Source: Seeking Alpha, 10 Nov 23
IYW's Holdings and Its Competitive Advantage
The top holdings for all "big tech" ETFs are, not surprisingly, Microsoft ( MSFT ) and Apple ( AAPL ). However, differences become evident below these top two holdings. Compared to VGT and XLK, IYW also includes comm sector holdings, leaving VGT and XLK without GOOG/GOOGL. QQQ is similar to IYW in that it includes information technology and communication sector holdings. However, this ETF has considerably lower weight on GOOG/GOOGL and includes Amazon ( AMZN ) and TSLA which are excluded from IYW.
Top Holdings for IYW and Competitor ETFs (Key Differences Bolded)
| MSFT (17.9%) |
| AAPL (21.3%) |
| AAPL (10.9%) |
| MSFT (24.3%) |
| AAPL (17.9%) |
| MSFT (17.1%) |
| MSFT (10.3%) |
| AAPL (23.3%) |
| GOOGL (5.4%) |
| NVDA (6.2%) |
| AMZN (5.6%) |
| NVDA (4.4%) |
| GOOG (4.7%) |
| AVGO (3.2%) |
| NVDA (4.4%) |
| AVGO (4.4%) |
| NVDA (4.4%) |
| ADBE (2.2%) |
| META (3.9%) |
| ADBE (3.1%) |
| META (3.8%) |
| CSCO (2.0%) |
| AVGO (3.1%) |
| CSCO (2.6%) |
| AVGO (3.0%) |
| CRM (1.9%) |
| GOOGL (3.0%) |
| CRM (2.5%) |
| ADBE (2.2%) |
| ACN (1.8%) |
| GOOG (3.0%) |
| ACN (2.5%) |
| CRM (2.2%) |
| ORCL (1.6%) |
| TSLA (2.8%) |
| AMD (2.1%) |
| AMD (2.1%) |
| AMD (1.5%) |
| ADBE (2.2%) |
| ORCL (2.0%) |
Source: Multiple, compiled by author on 10 Nov 23
Beyond what holdings IYW does have, it is notable what the ETF does not hold. In contrast to VGT, QQQ, and XLK, IYW does not have any weight on ACN, TSLA, or AMZN. While other funds' weights on these holdings are roughly 5% or less, history has shown that even these smaller holdings can make a large difference over time.
For example, in 2021, each of IYW's competitor ETFs had holdings in PYPL. VGT held 2%, QQQ held 4%, and XLK held about 3%. Even before PYPL started falling 35%, IYW excluded it as a holding. This was one of the primary contributing factors to IYW outperforming its competitor ETFs in the past few years.
All investors know that historical performance does not always guarantee future performance. Whether IYW will outperform is dependent on the future performance of its holdings. Historically, IYW has held first place among big tech ETFs. I argue that IYW has the right holdings to continue this trend of outperformance. To support this claim, we must look at the expected growth of IYW's distinct holdings.
Heaviest Weight on Google
IYW has the heaviest holdings of GOOG and GOOGL compared to other big tech ETFs. This is IYW's first distinct competitive advantage. Google had strong Q3 '23 earnings with 11% revenue growth YoY, 41.5% net income growth, and 25.6% operating margin. Furthermore, Google has three revenue streams primed for strong growth over coming years.
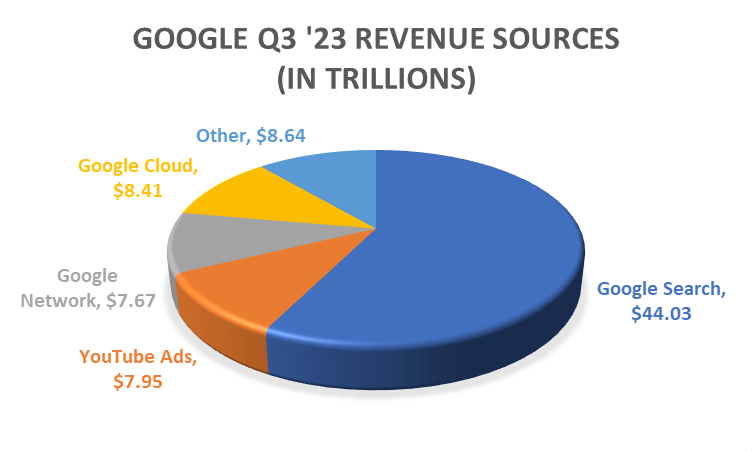
The first driver of strong future revenue for Google is its AI-powered Search Generative Experience ((SGE)), Alphabet's equivalent of ChatGPT. This is also Google's response to Microsoft's Bing platform and chatbot. SGE will further propel Google's largest revenue source, search revenue, totaling over $44T. Furthermore, Google is bringing its SGE to 120 new countries soon, bolstering its strongest revenue source.
Google Revenue Source Break-Down (Generated by author from SEC filings data)
The second source of expected revenue growth for Google is Gemini, a conversational artificial intelligence software. Designed to compete with OpenAI's Chat GPT-4, Gemini is expected to be "the most powerful AI model ever to exist". Although GPT-4 can chat with images and voice, Gemini will have much greater power. Boasting 30-65 trillion parameters, or the variables to convert data into output, this far exceeds ChatGPT 4.0's 1.75 trillion parameters. Gemini, therefore, represents a powerful factor in increasing upcoming revenue.
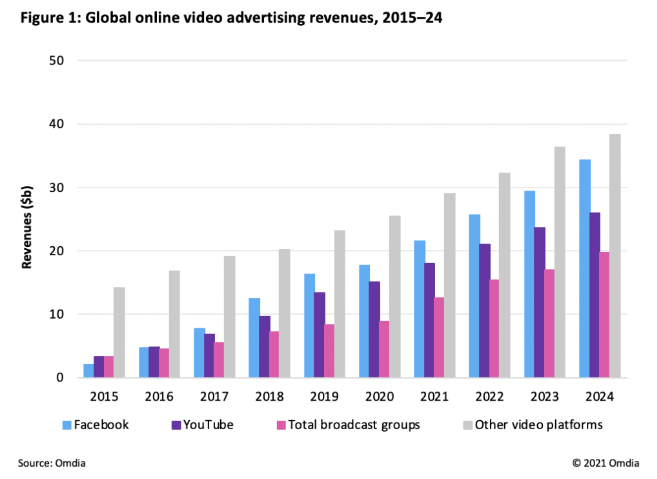
The third source is YouTube's ad revenue. Google's YouTube is a leading streaming platform, generating about 10% of the company's revenue. The video streaming market is expected to grow to $1.69T in 2029 , up from $473B in 2022 or a 19.9% CAGR. Global video streaming is expected to see strong growth with YouTube maintaining a dominant presence in the market.
For Q3 '23, Google saw cloud revenue of $8.41B which represents a 22.4% YoY growth for Q3 and approximately 11% of total revenue. While demonstrating solid growth, a higher Google cloud revenue of $8.64B was expected. To add to the injury, Microsoft's Azure cloud platform did better than expected. Following lower than expected cloud earnings, Google's share price dropped 13% in the trading days after Q3 earnings were announced. However, this drop is short-sighted given three major sources of increasing revenue for Google moving forward. Already, we have seen an 8.5% increase in share price from its late October bottom.
IYW's Exclusion of ACN and TSLA
Just as significant for what IYW has as holdings, is what the fund does not hold. In comparison to other top big tech ETFs, IYW does not hold Accenture ((ACN)) or Tesla ((TSLA)). This is IYW's second distinct competitive advantage.
ACN saw unimpressive Q3 results with -20% YoY net income growth as well as negative EPS growth. Both VGT and SLK hold ACN as a holding. While only about 2% weight for each ETF, small margins can make a large difference when comparing ETFs that evenly matched. This was seen with PYPL in 2021 and can certainly be seen again with other holdings. ACN also only saw 4% YoY revenue growth in Q3 '23, lower than Google, Microsoft, and Amazon.
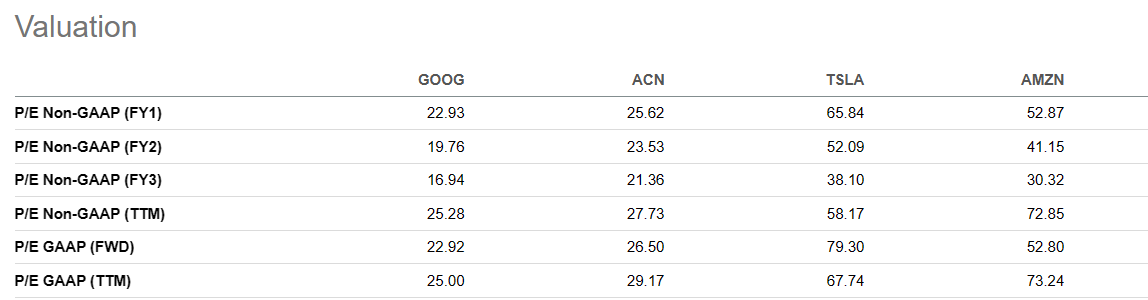
In addition to not having ACN as a holding, IYW also does not hold TSLA. This is a key difference from QQQ. Tesla saw -3.9% net income growth in Q3 as well as -4.5% EPS growth. While the United Auto Workers union currently not unionized Tesla workers, UAW's recent successes have certainly added pressure. Tesla also has a PE GAAP ((FWD)) 469% higher than its sector average.
Valuation
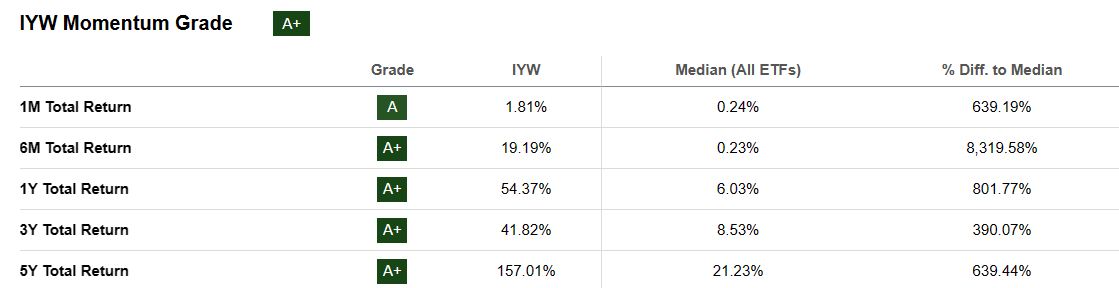
Similar to IYW's break-away lead in 2021 by not holding PYPL, IYW is gearing up for another lead. Google's potential revenue growth from Gemini, SGE, and YouTube is substantial. While IYW holds a P/E ratio of 34.3, slightly higher than that of its peer ETFs, IYW is below its all-time high of $114.17. IYW has strong momentum with the greatest return YTD than its competitor ETFs.
Compared to other big tech ETFs, IYW has the heaviest holding of GOOG/GOOGL. Google's P/E GAAP ((TTM)) is currently 10.5% below its 5YR average. With Google's strong revenue potential, IYW will likely be able to maintain its momentum and achieve results consistent with its historical performance. This would result in another 30% return over the next year and a price of $147. The difference in performance compared to VGT, QQQ, and XLK depends on how well GOOG/GOOGL, ACN, and TSLA perform over the next year. However, given the strong expected growth for Google, and arguably overvaluation of ACN and TSLA, I argue that IYW will maintain its lead among big tech ETFs.
Risks to Investors
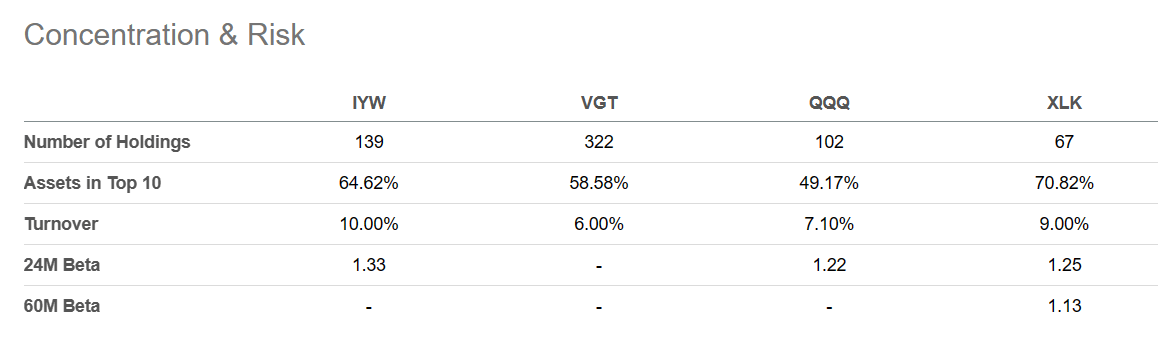
Investment in IYW is not without risks. The first is the volatility seen in comparison with other top big tech ETFs. Looking at the beta for IYW, it holds the highest value of 1.33 in the last 24 months. While not surprising that a big tech ETF is more volatile than the market as a whole, IYW has seen greater volatility than its peer technology ETFs.
A key risk to Alphabet, Inc. is the ongoing antitrust trial for Google which claims that "Google abused its power as a monopoly to dominate the search engine business." There are concerns that the case will be similar to the one against Microsoft in the late 1990s in which the Justice Department won. While the trial is still ongoing, it is widely expected to last 10 weeks and therefore may conclude before the end of this calendar year. The results of this case are not yet known and therefore represent a potential risk for Google, and therefore IYW.
Concluding Summary
Investors looking to take advantage of the continued gains of mega-cap IT and communication stocks, will likely do well with any of the big tech ETFs covered in this article. However, IYW stands out in this category and warrants a buy rating predominantly due to its unique mix of holdings, priming it for superior performance. IYW has the greatest weight on Google, which is expected to have strong revenue streams from multiple sources. Additionally, IYW does not hold ACN and TSLA which risk being overvalued, given recent underperformance. While IYW has the greatest expense ratio and lowest dividend yield of major competitors, its performance will outshine these deficiencies.
For further details see:
IYW: How This Fund Will Maintain First Place Among Big Tech ETFs