SJM - J. M. Smucker: Still Mildly Overvalued
2023-05-23 14:29:47 ET
Summary
- The J.M. Smucker Company is less overvalued than many others in the consumer staples sector.
- I believe the stock has to retreat some more before it is safe for long-term investors to buy.
- Investors seeking safety in this volatile market have taken refuge in the consumer staples sector.
In my December 2022 analysis, I put a hold r ating on the J.M. Smucker Company ( SJM ) and suggested selling covered calls to generate extra income. The stock has performed as expected since that call, down 2.4% on a total return basis compared to an 8.8% return for the S&P 500 Index ( SP500 ). The company's margins are improving, its inventory costs are under control, and its CapEx should be lower next year, leading to improved cash flows. Compared to other consumer staples stocks, many of which are trading at a stratospheric valuation, the stock is only a tad overvalued but trades in line with its peers, such as Campbell Soup ( CPB ). Long-term investors may consider buying the stock close to a 10x EV to EBITDA multiple, at or below $135.
Against all odds, double-digit price increases continue driving sales growth
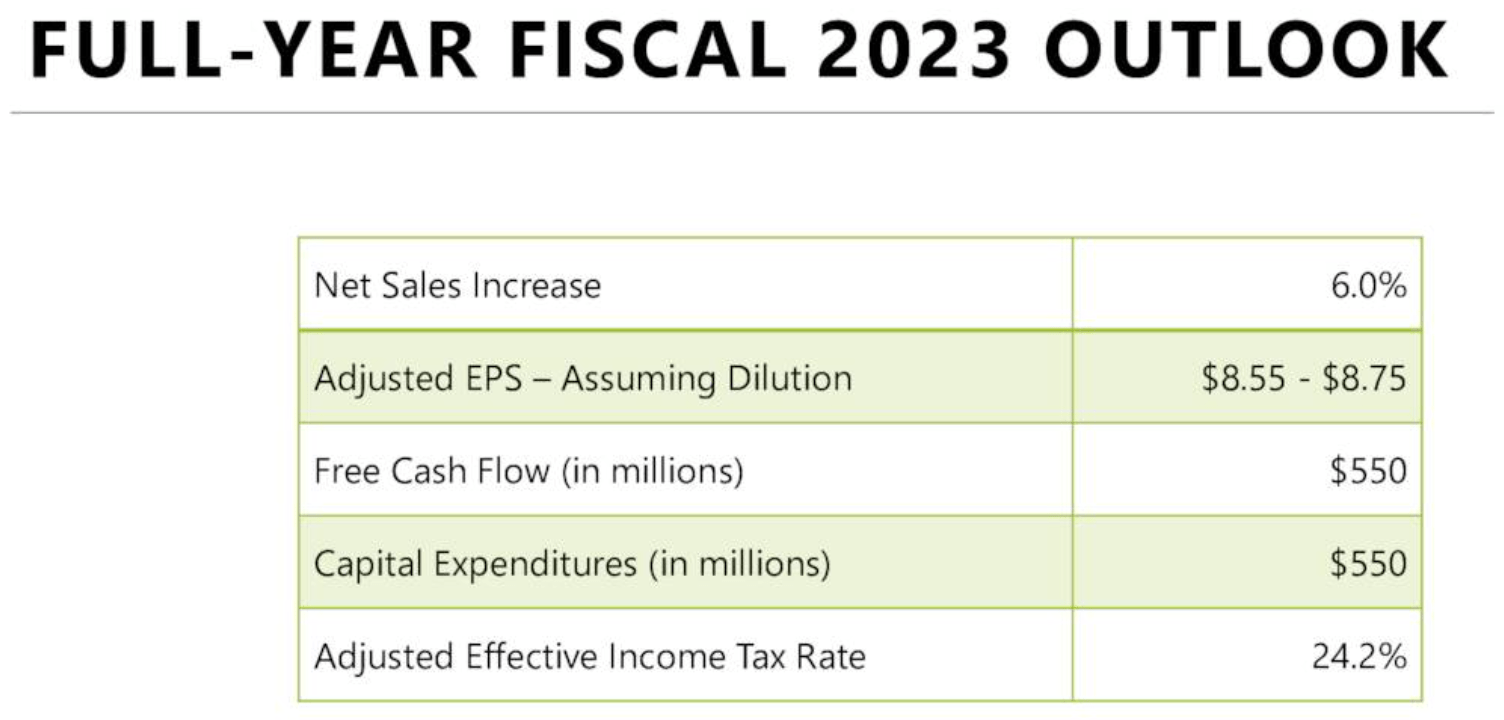
I am surprised by the consumer's resilience in the face of inflation. Many companies in the Consumer Staples sector have seen lower price elasticities, with double-digit price increases resulting in a decline in single-digit volume, and the third quarter showcased another example of lower elasticities. The company increased prices by 15% while volumes declined by 4%. In the second quarter , the company raised prices by 17% while the volume declined by 6%. The company saw a similar story in the first quarter, with a 14% price increase matched by a 9% volume decline. The company expects a 6% growth in sales in fiscal year 2023 (Exhibit 1) . Management has substantially increased its CapEx in 2023 and would spend its highest amount ever with an investment of $550 million . This CapEx will support the manufacturing expansion of its Uncrustables brand in Alabama. This substantial increase in CapEx has drastically cut its operating cash flow in 2023.
Exhibit 1:
The J.M. Smucker Company Fiscal 2023 Outlook (The J.M. Smucker Company Investor Presentation)
Consumers have continued spending with limited hits to sales volumes. Most companies in the Consumer Staples sector have seen their gross margins improve as inflation fades while price increases remain sticky. Flowers Foods (FLO), Procter & Gamble (PG), Kimberly-Clark (KMB), Mondelez International (MDLZ), Kraft Heinz (KHC), and J.M. Smucker have improved their margins q/q (Exhibit 2) .
Exhibit 2:
Quarterly Gross Margins for Consumer Staples Companies (Seeking Alpha, Author Compilation)
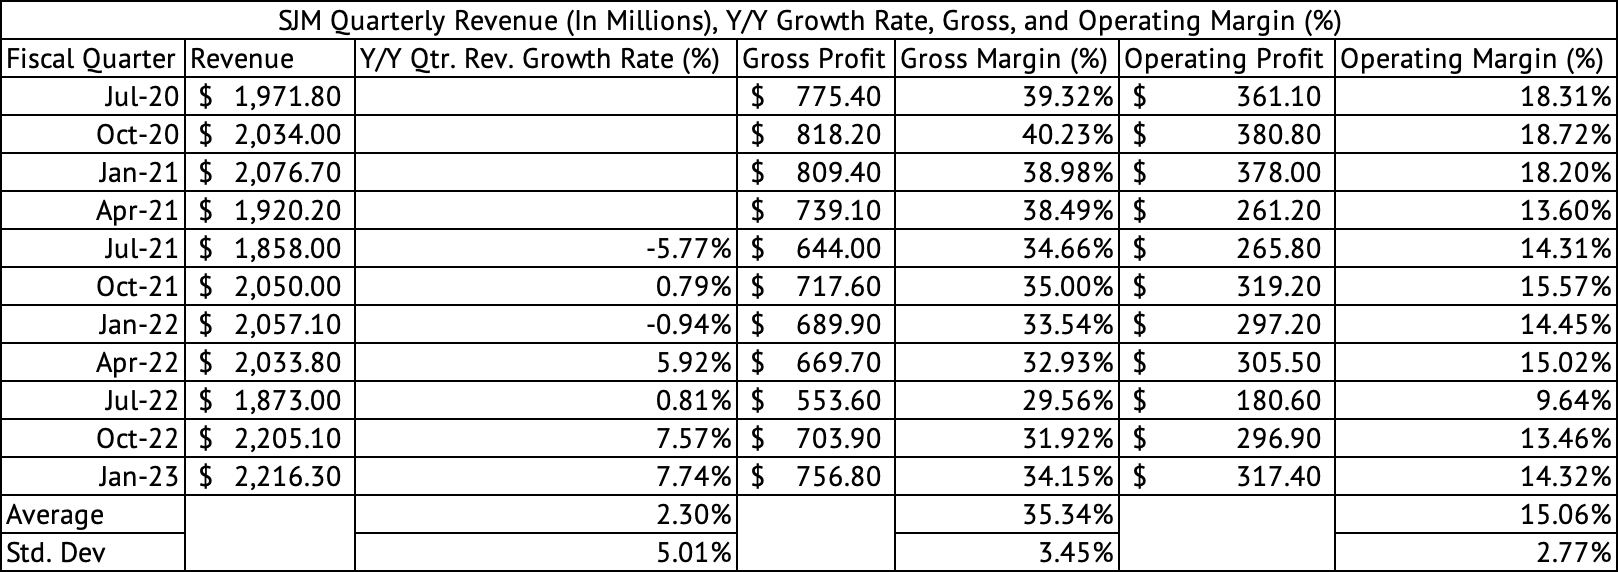
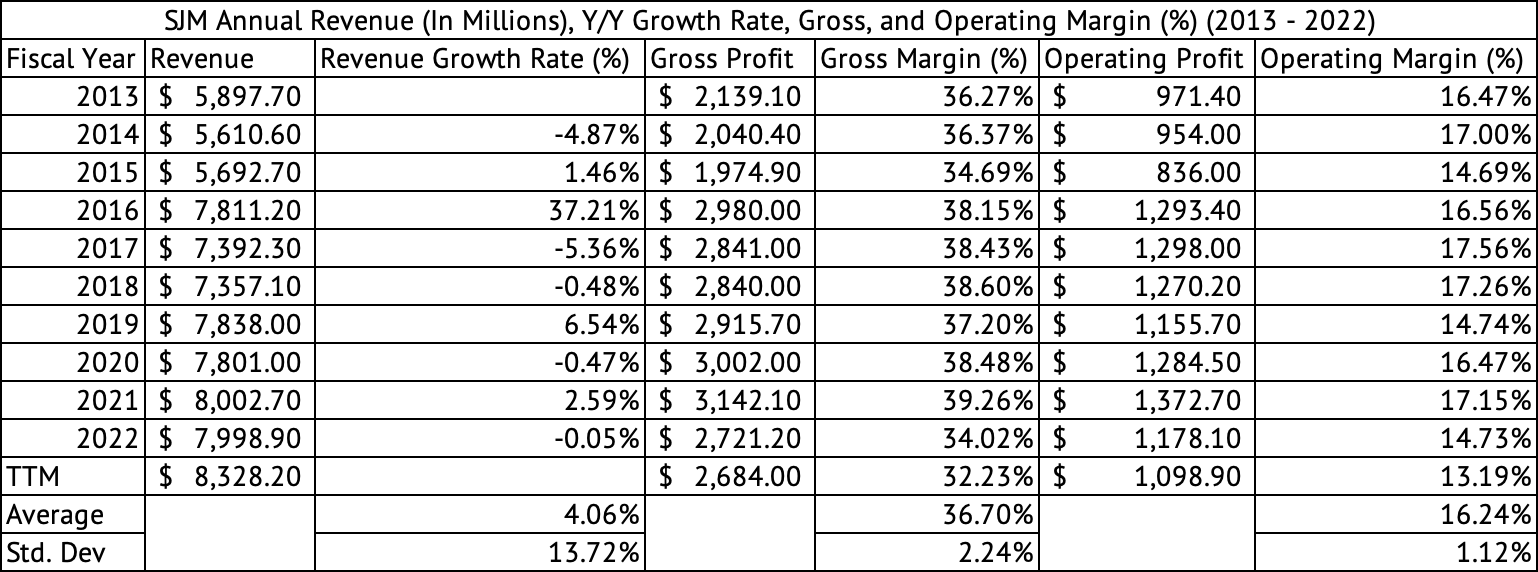
The J.M. Smucker Company has averaged a quarterly gross margin of 35.3% since July 2020 and an average annual gross margin of 36.7% (Exhibits 3 & 4) . The company has some ways to go to achieve its average gross margins. But, with supply chains returning to normal, input cost inflation is fading slowly; if the demand doesn't deteriorate further, the company should return to its average gross margins in the coming quarters.
Exhibit 3:
The J.M. Smucker Company Quarterly Revenue, Gross, Operating Profit, and Margins (%) (Seeking Alpha, Author Compilation)
Exhibit 4:
The J.M. Smucker Company Annual Revenue, Gross, Operating Profit, and Margins (%) (Seeking Alpha, Author Compilation)
Inventories are under control
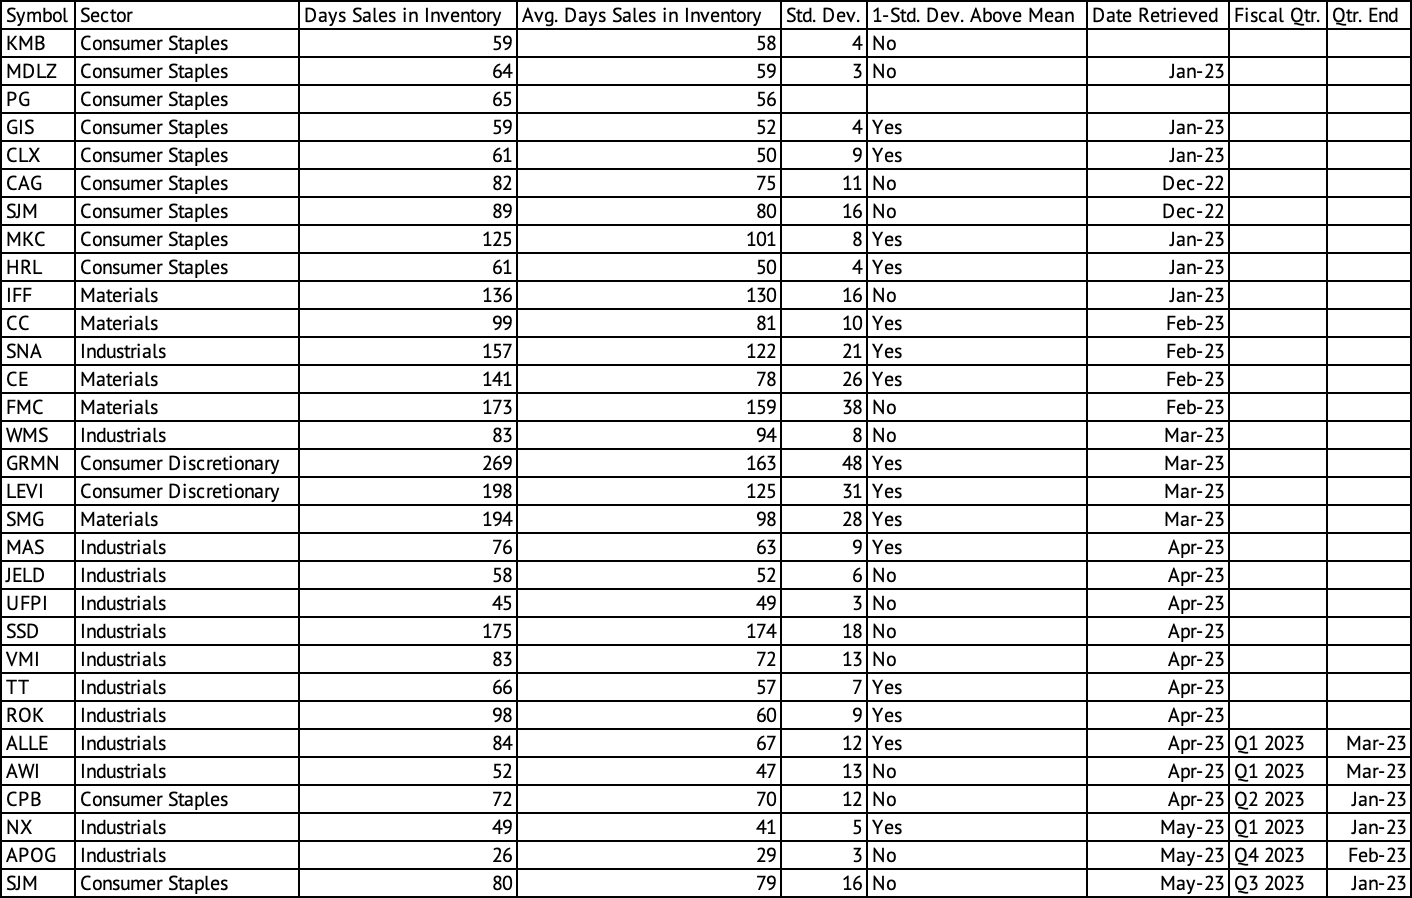
High inventory costs increase working capital requirements while reducing operating cash flows. Many companies have found it challenging to manage their inventory costs in the face of inflation and return to normalcy in demand as the economy opened up after the pandemic-induced closure (Exhibit 5) . But, J. M. Smucker Company has managed its inventory costs superbly compared to the others in the industry. General Mills (GIS), Clorox ( CLX ), McCormick ( MKC ), and Hormel ( HRL ) carried one standard deviation above the mean inventory last year.
Exhibit 5:
Day's Sales in Inventory for Companies in the Consumer Staples and Industrials Sector (Seeking Alpha, Author Compilation)
The J. M. Smucker Company carried 80 days of sales in inventory compared to its average over the past decade of 79, with a standard deviation of 16 (Exhibit 6) . The fiscal year 2015 was an outlier in inventory; if that year is removed, the company averaged 75 days, and the standard deviation would be much lower at 10. At the end of the company's October 2022 quarter (Q2 2023 fiscal quarter), it carried $1,358.4 million in inventory, which may be its peak. At that time, this inventory amounted to 89 days of sales.
At the end of the January 2023 quarter (Q3 2023 fiscal quarter), the company's inventory was reduced to $1,241.5 million. Based on the company's quarterly inventory data, it typically carries close to $1 billion (Exhibit 7) ; the company may reduce its inventory carrying costs by another $150 million to $200 million. This inventory reduction could lead to another boost to operating cash flow. The inventory reduction and lower CapEx in the next fiscal year could boost cash flows.
Exhibit 6:
The J.M. Smucker Company Day's Sales in Inventory (Seeking Alpha, Author Calculations)
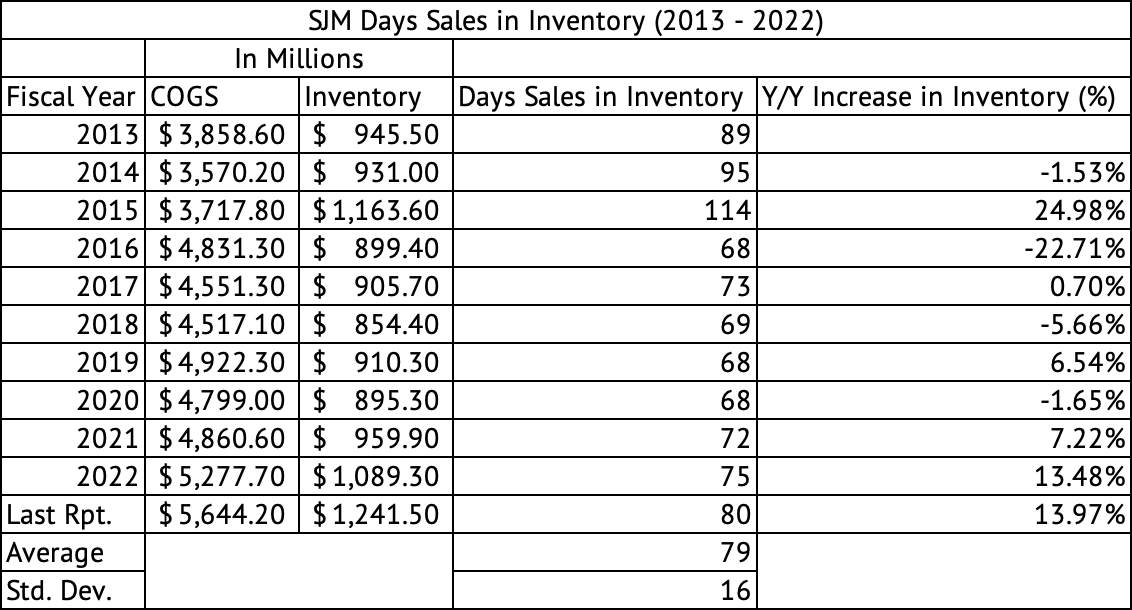
Exhibit 7:
The J.M. Smucker Company Quarterly Inventory (Seeking Alpha, Author Compilation)
Mildly overvalued
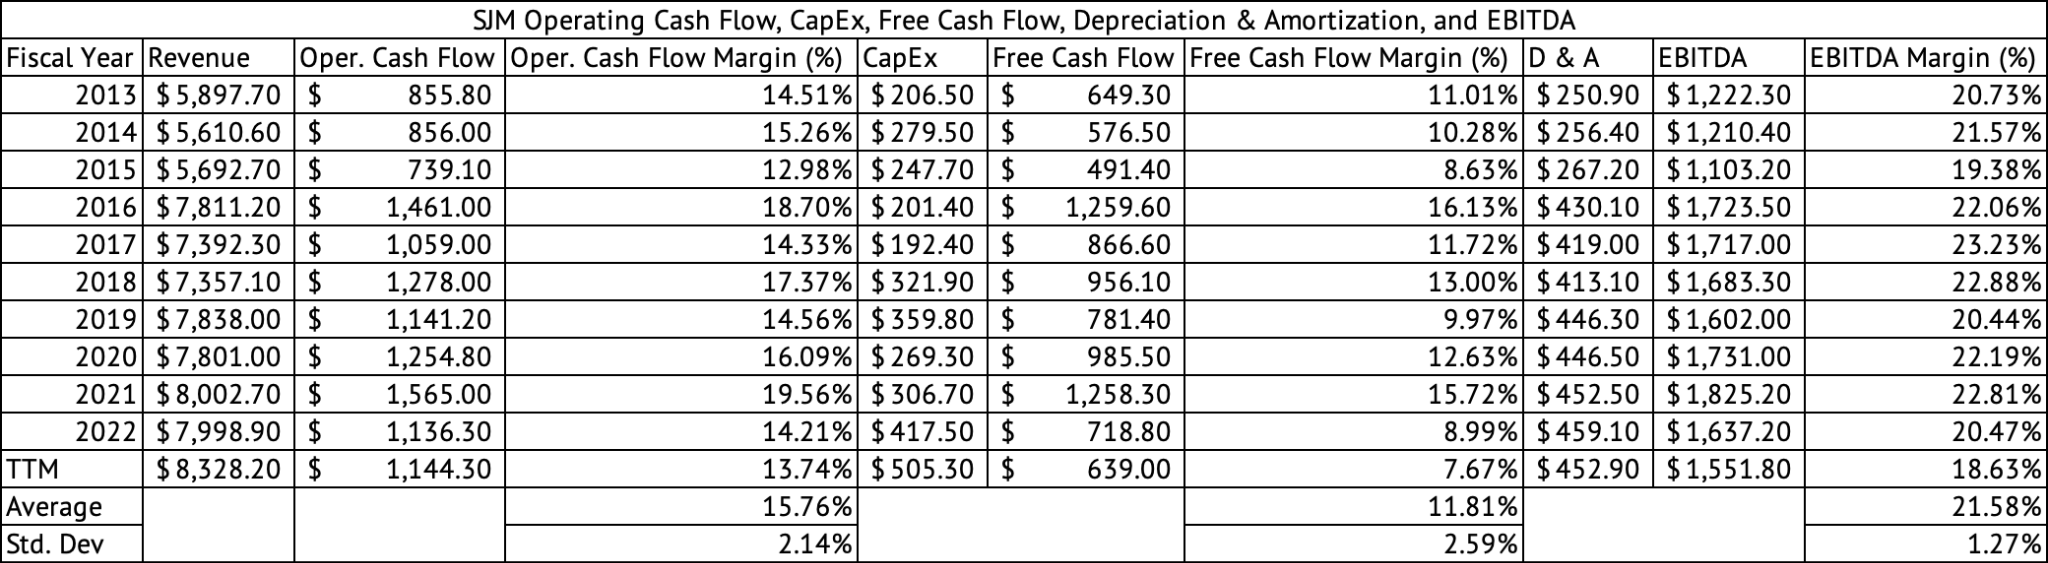
In 2019, the pre-pandemic year, the company achieved a 20% EBITDA margin (Exhibit 8) . If it reached a similar margin in fiscal 2024, the company would generate over $1.6 billion in EBITDA. Based on that EBITDA, the company would be valued at 12.8x EV to EBITDA multiple. The stock traded at a 5-year average EV to EBITDA multiple of 11.2x.
Exhibit 8:
The J.M. Smucker Company Operating Cash Flow (Seeking Alpha, Author Calculations.)
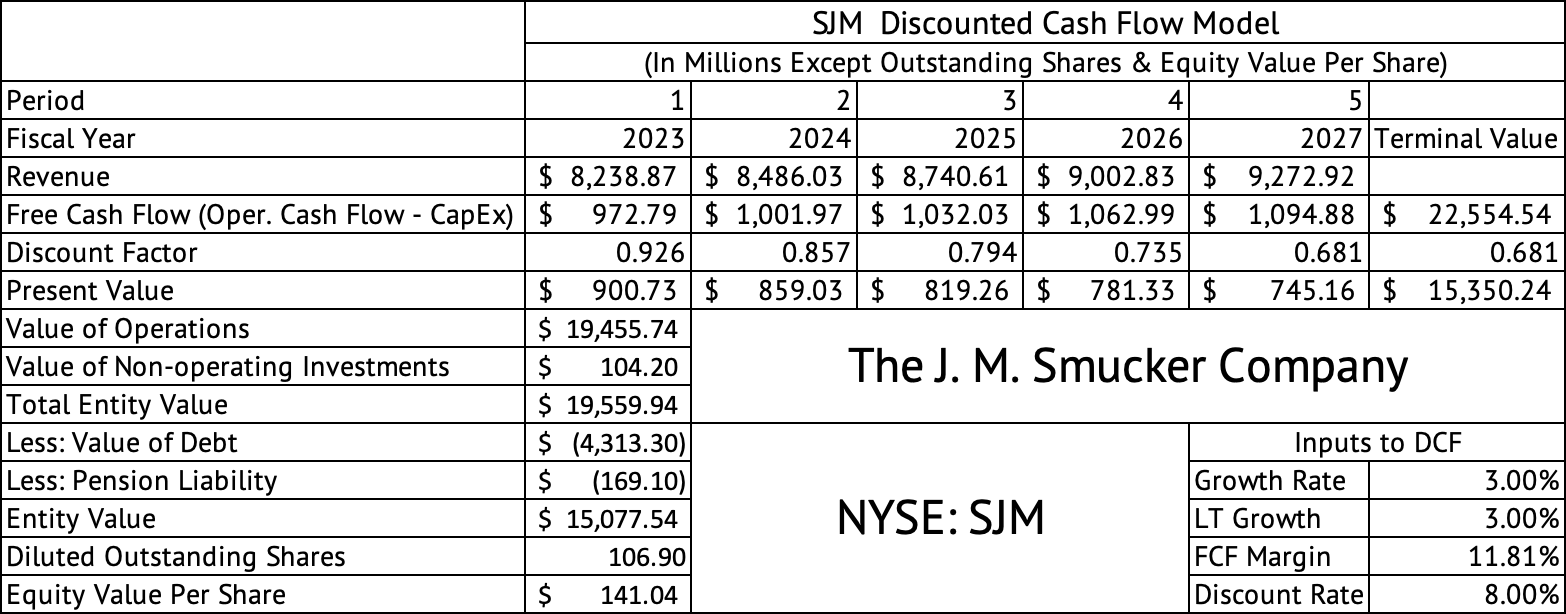
The company is only mildly overvalued compared to its historical average. A discounted cash flow model estimates a per-share equity value of the stock at $141 (Exhibit 9) . This model assumes a revenue growth rate of 3%, a free cash flow margin of 11.8%, and a discount rate of 8%. The price estimated by this model is close to the fair value estimate of $135. The 8% discount rate may be too liberal. A more appropriate rate is maybe 9%, closer to its cost of capital. When a 9% discount rate is used, the per-share equity value drops to $110. I think investors can consider buying the stock when it dips below $135. Its 52-week low is 119.82.
Exhibit 9:
The J.M. Smucker Company Discounted Cash Flow Model (Seeking Alpha, Author Calculations)
Cautious investor sentiment is behind the strength in the consumer staples sector
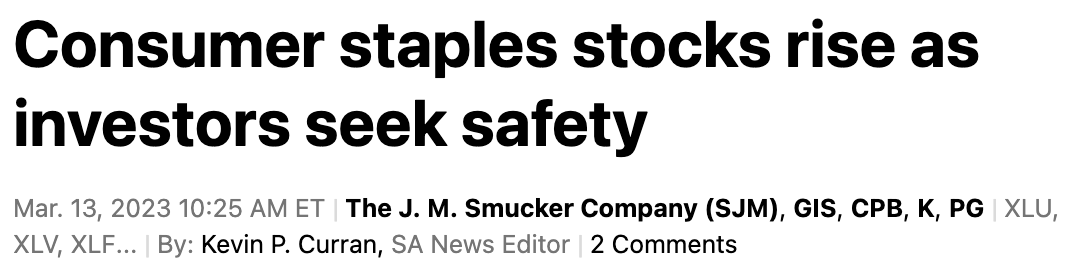
This headline from Seeking Alpha captures the reason behind the strength in the consumer staples sector (Exhibit 10) . Investors want to park their wealth in an industry less affected by the market's volatility; Consumer Staples stocks fit that bill. These stocks have a low beta of less than 1, meaning they are less risky, and their prices change less than the market. For example, J.M. Smucker Company has a beta of 0.21 , meaning that for every 1% change in the market, the company's stock is expected to change by 0.21% on average.
Exhibit 10:
Investors Seek the Safety of the Consumer Staples Sector (Seeking Alpha)
Unlike this article on Seeking Alpha that claimed the rally in Consumer Staples may not be over, the rally is over, and the sector offers little upside due to its high valuation in my view (Exhibit 11) . The article highlighted the Consumer Staples Select Sector SPDR Fund ETF (XLP). That ETF has gone sideways since the analyst's call. After the analyst's call on January 7, 2023, the ETF was at $74.94; on May 19, 2023, the ETF closed at $75.92, a gain of 1.3% over five months. Investors may see these stocks jump by a few percentage points when volatility increases but may soon give up their gains when it subsides. The high valuation of the stocks in the Consumer Staples sector is the primary reason the returns may be capped. The Consumer Staples Select Sector SPDR Fund ETF trades at a weighted average PE of 20.6x and a price-to-book ratio of 5.5x. The weighted average PE ratio of stocks in the Vanguard Consumer Staples ETF is 25.4x, with a price-to-book ratio of 4.8x.
Exhibit 11:
The Rally in the Consumer Staples Sector is Not Over. (Seeking Alpha)
J. M. Smucker has lost momentum over the past three months, having returned 1.3%. The stock has done exceedingly well, returning 23.5% compared to the S&P 500 total return of 9.3% (Exhibit 12) . The stock has underperformed the S&P 500 Index on a 3-year, 5-year, and 10-year basis. The RSI and MFI technical indicators show a weakening momentum in the stock, with both in the mid-thirties trending towards oversold levels (Exhibit 13) .
Exhibit 12:
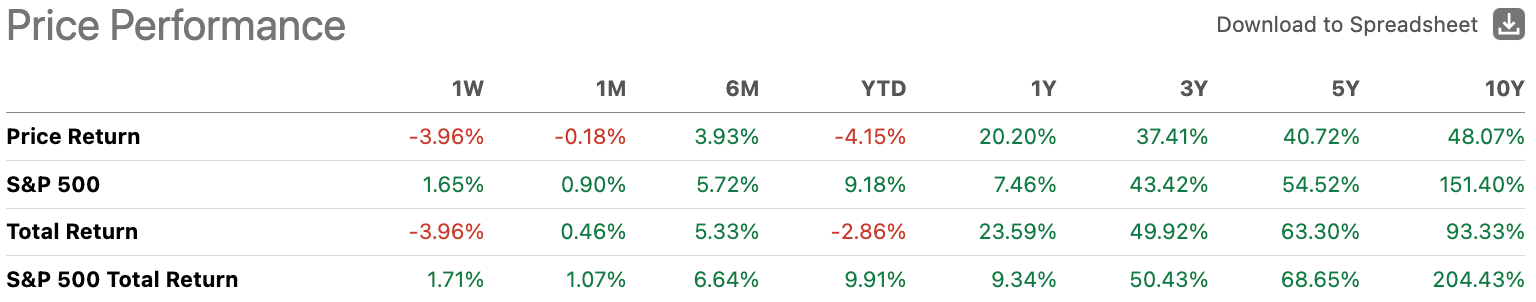
Exhibit 13:
The J.M. Smucker Company Technical Indicators (Seeking Alpha)
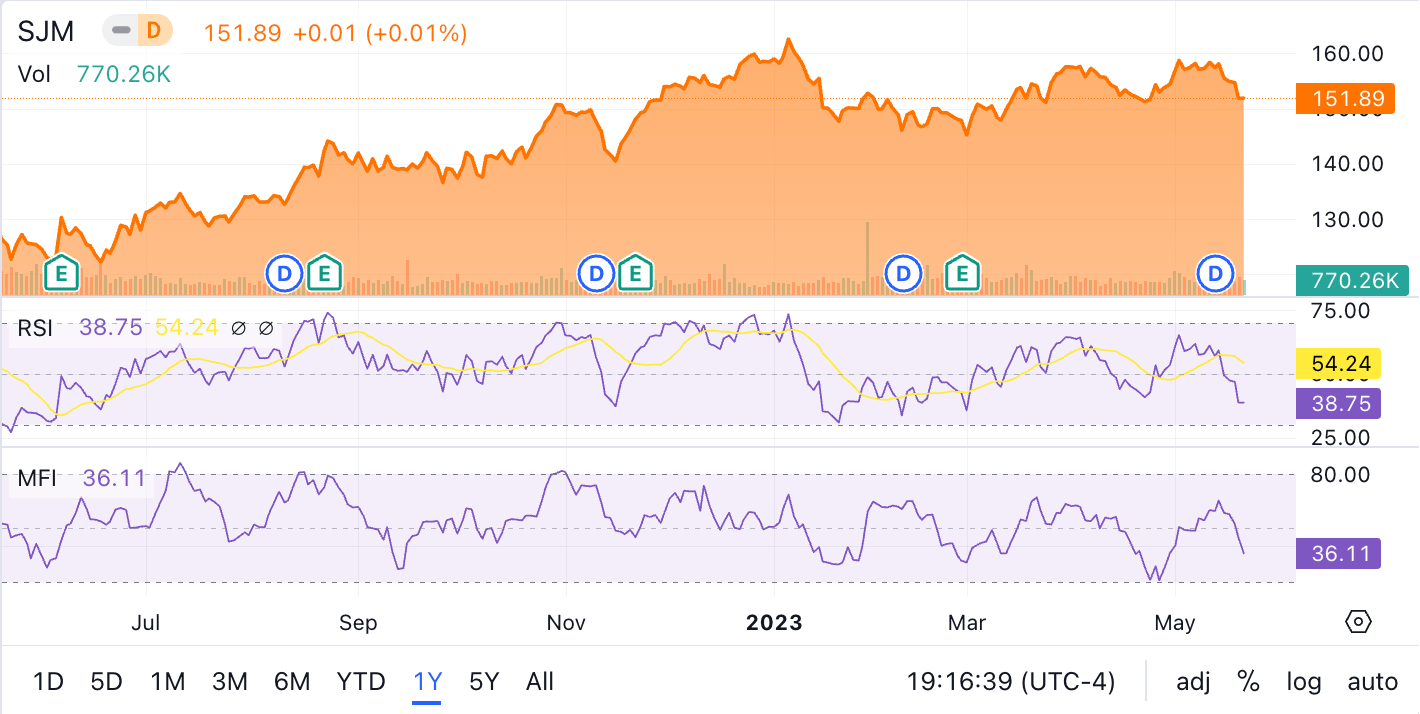
The J.M. Smucker Company is home to many iconic brands that will be favored for generations. The stock is trading at a slight premium to its five-year average as investors have piled into consumer staples stocks seeking protection against the market's volatility. Investors may consider buying the stock if the stock falls 10% or more in the coming months.
For further details see:
J. M. Smucker: Still Mildly Overvalued