JHG - Janus Henderson: Fee Margin And Net Flow Disappointment - Downgrade To Hold
2023-08-07 04:24:51 ET
Summary
- Janus Henderson reported a disappointing 2Q23 result, with a material decline in the investment fee margin and a warning of large net outflows in 3Q23E.
- A new JV focused on distributing Alternatives to the HNW sector shows that JHG is serious about diversifying its product and market reach.
- The business has been through a huge amount of change in the year since CEO Ali Dibadj joined, and the amount of turnover within the senior investment team is concerning.
- At ~$27 per share, JHG is slightly cheap, with a dividend yield above 5%, but the risk of continued organizational instability warrants a downgrade to Hold.
Introduction
Janus Henderson Group ( JHG ) released 2Q23 results on 02 August 2023. My previous Seeking Alpha note on JHG rated the stock a Buy at ~$27.23; that was looking like a solid call when JHG was trading close to $30 in mid/late July. However, the gains quickly unwound as the market digested the 2Q23 update, pushing the share price down by -5.8% on the day of the release. JHG’s price has drifted further lower since then, closing at $27.14 on 04 August 2023. In this note I’ll review the 2Q23 materials and discuss new positive and negative factors that are relevant to the JHG investment case. With JHG now slightly below the price level at which I last upgraded to Buy, I’ll consider whether the price fall is enough to offset the negative aspects of the 2Q23 result that the market has reacted to.
2Q23 Positives
Key positives reported in the 2Q23 materials are summarized and discussed below:
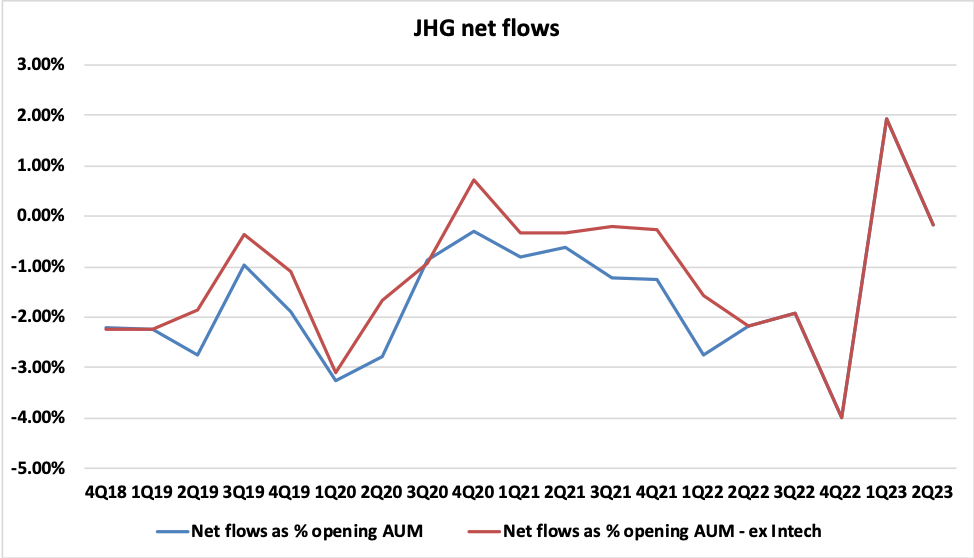
- Net flows for the quarter came in at an outflow of -$0.5bn. This may seem more like a negative than a positive, but relative to history, and taking account of previous comments from management, it is a solid outcome, and the third-best net flow result (excluding Intech) since I started covering JHG in late 2018.
Source: Created by author using data from JHG financial reports.
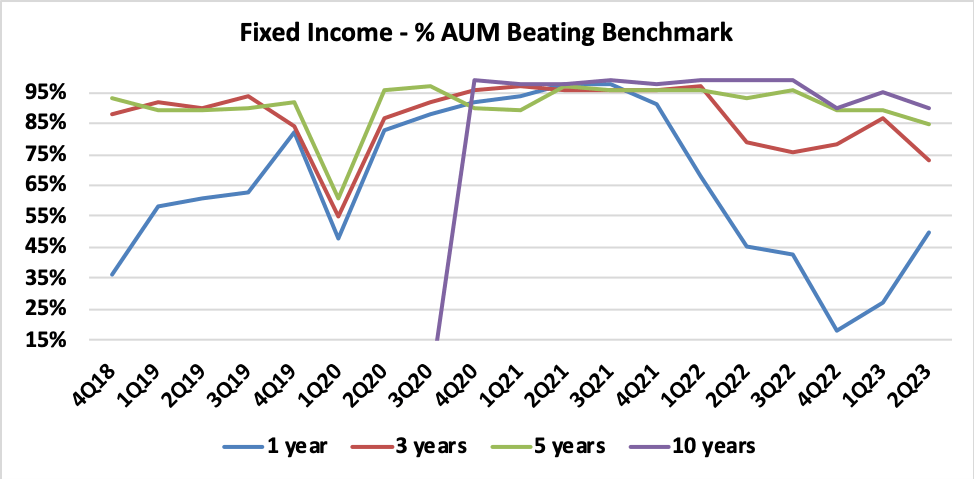
- Benchmark-relative investment product performance for Fixed Income was extremely poor at the 1-year measure for 4Q22 and 1Q23; 2Q23 delivered a much-needed improvement, with 50% of Fixed Income AUM ahead of benchmark at the 1-year measure. (In the chart below note that JHG only started to publish data for the 10-years period at 4Q20.
Source: Created by author using data from JHG financial reports.
- JHG announced a new JV, Privacore Capital , focused on the Alternatives sector. This is unlikely to be a game changer for JHG, with the group’s capital contribution to the entity being a modest $25m, but it is a positive step in terms of diversifying JHG’s product offering and market reach. Privacore will act as an open-architecture distributor and consultant for alternative investment products tailored to high-net-worth clients. It appears that JHG is hoping to distribute some of its own Alternatives products through the Privacore platform, and also to gain access to high-net-worth advisers in order to cross-sell other JHG products.
2Q23 Negatives
Key negatives reported in the 2Q23 materials are summarized and discussed below:
- The CFO guided to net outflows of -$3.5bn to -$5.0bn in 3Q23E. Looking back at the 1Q23 result, management stressed that the 1Q23 net inflow should not be taken as a sign that JHG was in a position to consistently generate positive net flows – but even in that context, the guidance for 3Q23E net outflows of -$3.5bn to -$5.0bn was disappointing.
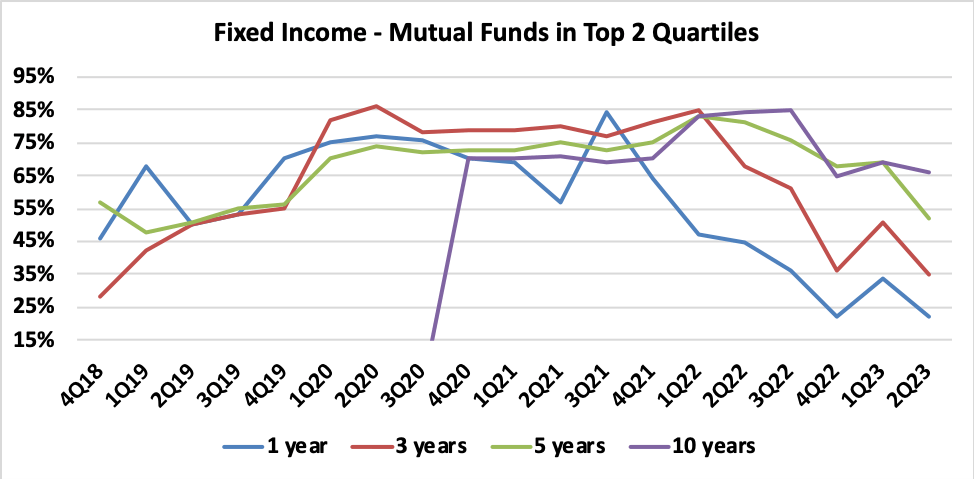
- Whilst the short-term performance of Fixed Income has improved relative to benchmark, peer-relative Fixed Income performance slipped again in 2Q23. Peer-relative performance results over both the 1-year and 3-years measures are very unsatisfactory. At the 1-year measure, only 22% of Fixed Income AUM was in the top two Morningstar quartiles for 2Q23. At the 3-years measure, 35% of Fixed Income AUM was in the top two Morningstar quartiles for 2Q23. These soft peer-relative results will make it particularly challenging for JHG to sell Fixed Income product into the retail channel.
Source: Created by author using data from JHG financial reports.
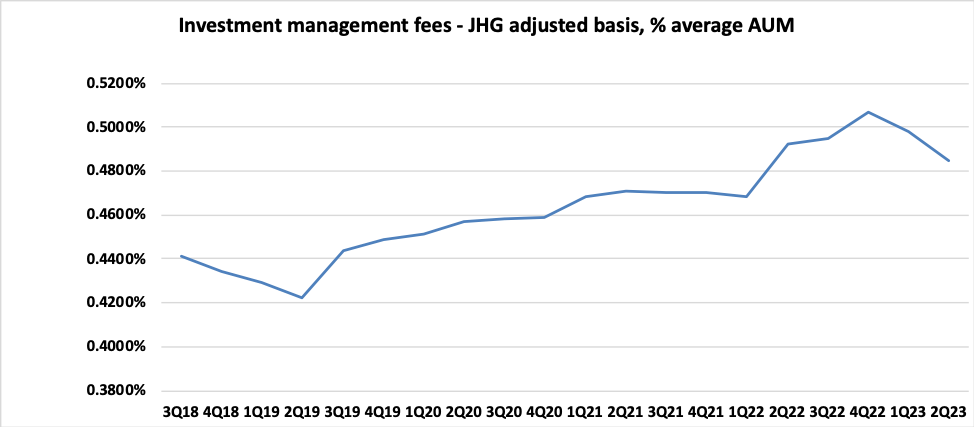
- The net management fee margin declined to 48.5bp of AUM, a material fall from 1Q23’s net management fee margin of 49.8bp. The fee margin is discussed in detail below.
Investment Management Fee Margin Analysis
JHG’s 2Q23 investment management fee margin (‘fee margin’) of 48.5bp was lower than I had anticipated. At 1Q23, management flagged that the fee margin would come under pressure due to business mix changes; in my 1Q23 valuation work I therefore allowed for a decline in the fee margin from the 1Q23 level of 49.8bp to a normalized level of 49.3bp. Consistent with the messaging at 1Q23, management commentary attributed the large 2Q23 fee margin reduction to business mix, driven by low margin institutional mandate wins in the first half of the year. In the 2Q23 management speech, CFO Roger Thompson flagged a stable fee margin in 3Q23E:
Net management fee margin for the second quarter was 48.5 basis points compared to the prior quarter of 49.8. The decline is primarily due to the impact of large institutional mandate fundings during the first half of 2023. All else equal, we anticipate the net management fee margin to stabilize in the third quarter.
Source: JHG 2Q23 Transcript , page 6, Seeking Alpha.
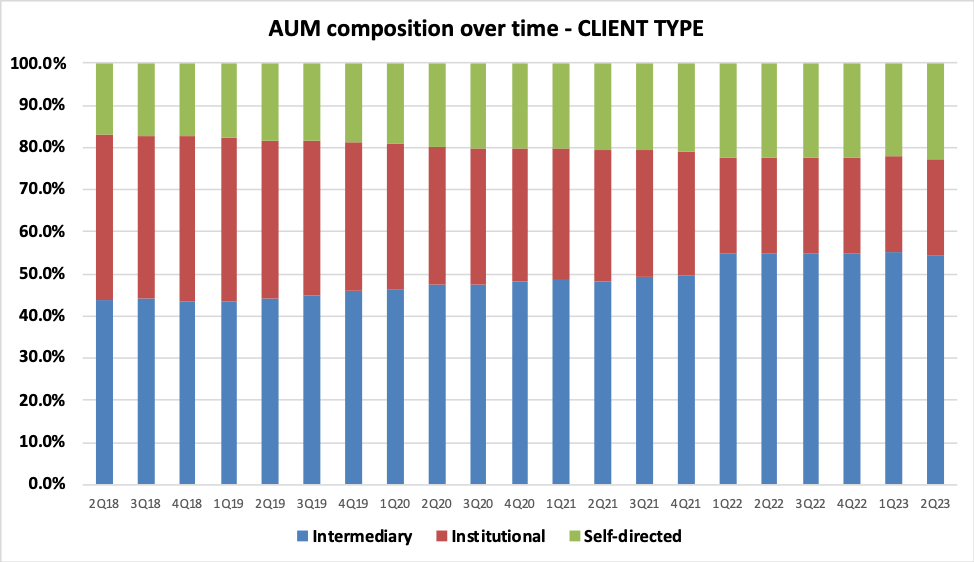
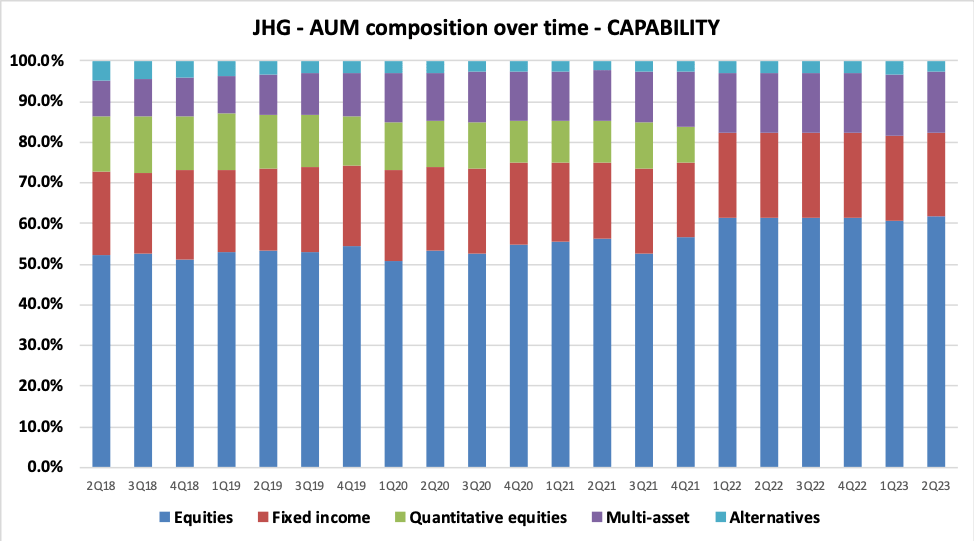
In Exhibit 1, I track JHG’s fee margin on a quarterly basis from 3Q18 to 2Q23. Note that the increase in the fee margin at 2Q22 was due to the exit of the very low margin Intech business. Looking at the post Intech exit period, the fee margin has declined from 49.2% at 2Q22 to 48.5% at 2Q23. There are many moving parts sitting behind the headline fee margin outcome – key factors include channel/client mix, product type/capability mix and marketplace competition. In Exhibit 2 (AUM by client type) and Exhibit 3 (AUM by capability), I provide data that can help us to understand the influence of business mix on JHG’s fee margin trends.
Exhibit 1:
Source: author’s calculations using data from JHG financial reports.
Exhibit 2:
Source: author’s calculations using data from JHG financial reports.
Exhibit 3:
Source: author’s calculations using data from JHG financial reports.
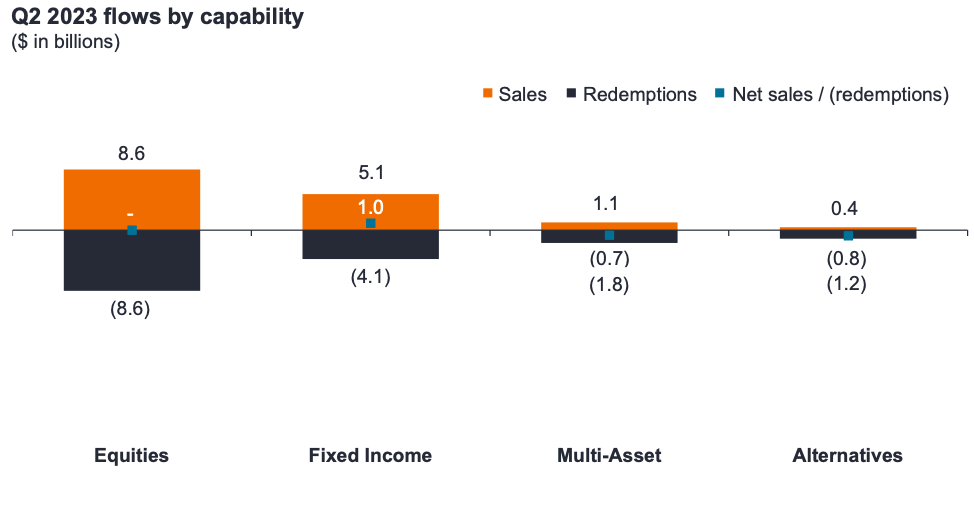
Exhibit 3 shows that in the period since 2Q22, AUM composition by capability has been relatively static. Similarly, in Exhibit 2, it is hard to see a clear trend that can be used to point to client type business mix being the source of the fee margin decline. Data to support management’s commentary that institutional mandate wins were the driver of the 2Q23 fee margin decline is therefore somewhat lacking. That said, the business mix data that JHG provides is rather high level, and it is possible that there are material differences in fee margins within a client type segment. In the 2Q23 management speech, JHG referenced positive AUM flows in Fixed Income ETFs; it is likely that the fee margin on these flows will be relatively low. 2Q23 net outflows in Multi-Asset (much of which related to retail clients) and Alternatives represents a loss of AUM that was likely to be on a relatively high fee margin (refer Exhibit 4).
Exhibit 4:
Source: JHG 2Q23 Presentation, slide 6.
It is difficult to forecast how JHG’s business mix will move in the future, and how net flow trends will influence the fee margin over time. JHG’s ‘Protect & Grow, Amplify, Diversify’ strategy includes aspects which can be expected to have both upward and downward influences on the fee margin, and the net impact is unclear. In recognition of the fact that accurately forecasting the fee margin is near to impossible, my general approach is to take the most recent quarterly fee margin as a key input for valuation purposes. Given that I have question marks regarding the drivers of 2Q23’s fee margin decline, for my 2Q23 valuation work, I have allowed for an additional downward move in the fee margin to 48.0bp.
Organisational Stability Needed
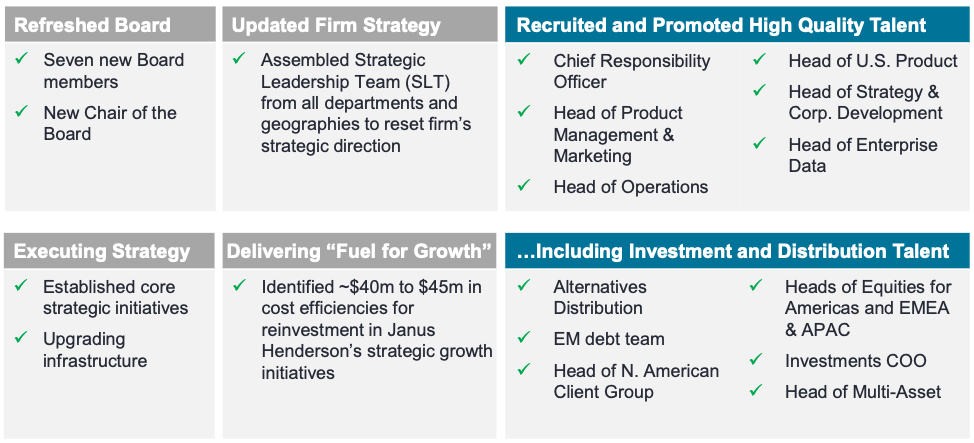
CEO Ali Dibadj has been in the role for slightly over twelve months. In that time, JHG has been through a great deal of organizational change. Exhibit 5 provides a summary of the major changes. It is clear that there has been a lot of firing and hiring of senior executives; whenever this happens there is likely to also be an increase in turnover of less senior staff, and it may take a year or two (at least) for the staffing situation to calm down.
Stability within investment teams is something that I look for in fund managers (both when thinking about investing in stocks, but also when thinking about investing in a fund manager’s products). Exhibit 5 points to a high level of instability in JHG’s investment teams over the last year. In late July, the group announced two new hires for Head of Equities Americas (Marc Pinto) and Head of EMEA and Asia Pacific Equities (Lukas Klein). These are two big roles within the investment team, and it is disappointing that JHG did not have the internal bench strength to fill at least one of the jobs internally. I expect that the arrival of Pinto and Klein will trigger a number of departures over the next year or two in the various teams that they are responsible for. I’m sure that rating houses and external consultants will have raised a few eyebrows at the level of turnover in the senior ranks of the JHG investment structure, and there may well be a heightened risk of product rating downgrades if there is any near-term slippage in investment performance.
Exhibit 5:
Source: JHG 2Q23 Presentation, slide 6.
Summary and Rating
My fair-value benchmark for a fund manager is a P/E of around 12x. At $27.14 per share (market close 04 August 2023), using JHG’s 2Q23 reported AUM, my normalized valuation framework generates a base case P/E of 11.0x. Note that this valuation allows for a further decline in the fee margin to 48bp, and a net outflow in 3Q23E of -$5.0bn.
Despite a soft quarter for net flows, relative to a year ago, I think JHG has made positive progress towards its goal of consistently generating net inflows. For fund managers there is nearly always a strong link between net flows and market sentiment, and if JHG can continue to strengthen its net flow performance this should be positive for the group’s share price.
For further details see:
Janus Henderson: Fee Margin And Net Flow Disappointment - Downgrade To Hold