VNQ - JBG SMITH: The Needle Is Still Pointing Down
2023-08-09 11:27:56 ET
Summary
- Office REITs are struggling due to the work-from-home trend, resulting in low occupancy and rents.
- JBG Smith Properties is aggressively recycling assets and focusing on the fast-growing National Landing area.
- JBGS investors have endured a long-term loss of share price and as revenues continue declining, there is significant risk of a dividend cut.
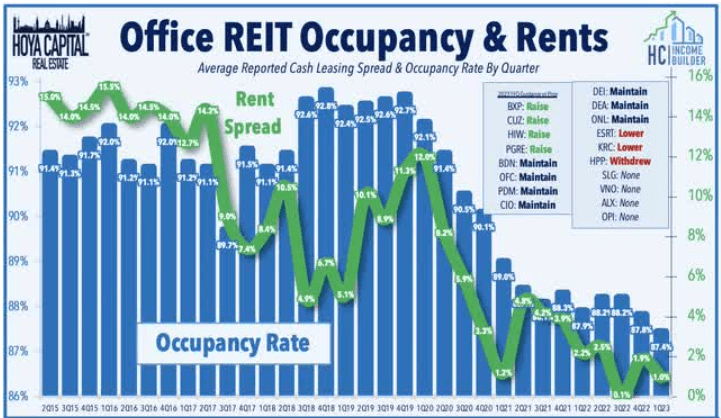
It is no secret that Office REITs are in trouble. The WFH (work from home) trend unleashed by the pandemic is here to stay, resulting in an oversupply of office space from coast to coast. Office REIT occupancy and rents are lingering near their all-time lowest levels.
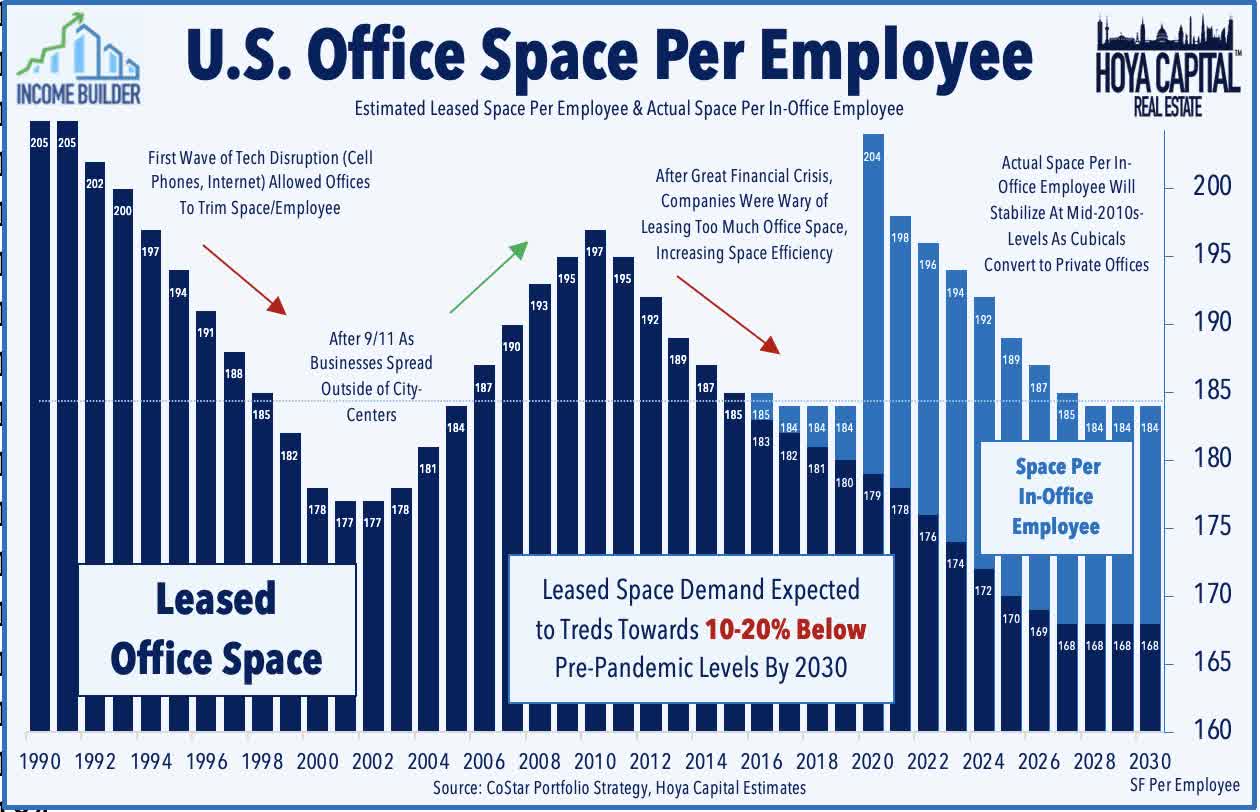
Office space leased per in-office employee is expected to continue declining through the rest of this decade.
Nevertheless, there is reason to think the worst is over for some office REITs. Hoya Capital's latest report on this sector reads in part:
We remain bearish on coastal REITs with transit-heavy commutes - the new "Class C/D malls" - but we're calling a bottom for a handful of Sunbelt and secondary-focused REITs.
Unfortunately, the company I will review in this article is not one of those.
Meet The Company
JBG Smith
Founded in 1957 as Miller, Brown, and Gildenhorn, and headquartered in Chevy Chase, Maryland, JBG Smith Properties ( JBGS ) went public as a REIT in the summer of 2017. The company owns and operates a portfolio of office and multifamily properties in the Washington, D.C. area, totaling 15.1 msf (million square feet), with another 9.8 msf in the development pipeline. The company's market cap is $1.88 billion.
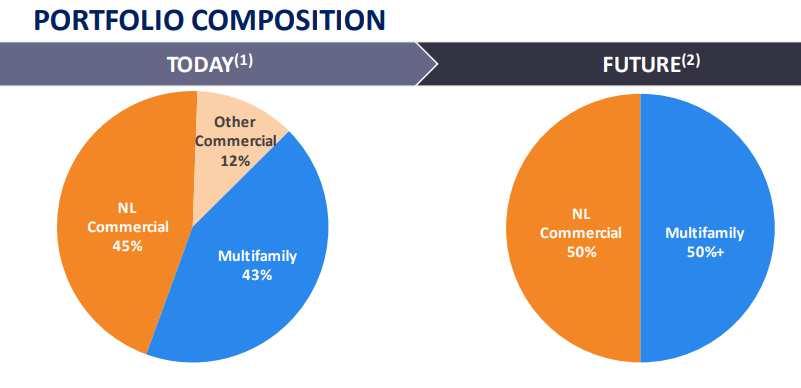
Of the total portfolio, 8.9 msf (59%) is office and commercial real estate with an occupancy rate of 84.0% and a 5.7-year weighted average lease term, while the other 41% is multifamily assets, enjoying 93.7% occupancy. The company owns over 6600 units, with another 1500+ in the pipeline.
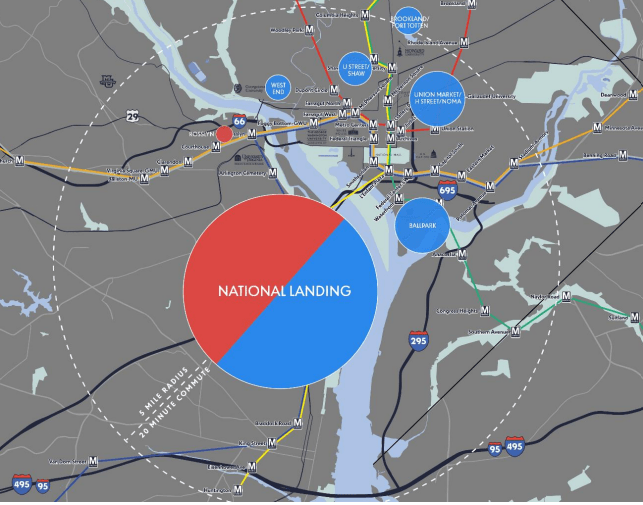
The company has seen the handwriting on the wall, and is aggressively recycling old assets and developing new ones, in order to transition to a 50-50 split. In addition, it is seeking to concentrate all its office assets in the fast-growing National Landing area, which consists of Pentagon City, Crystal City, and Potomac Yard.
National Landing is an innovation district , somewhat like the Research Triangle of Raleigh-Durham-Chapel Hill in North Carolina, bringing talent, infrastructure, and government-business synergy together. Most of this activity centers around national defense. National Landing saw a population growth of 13% from 2021 to 2022 . Asking rents for apartments in National Landing are up 16% post-COVID. It is an up-and-coming live-work-play neighborhood. With JBGS leading the way, National Landing seeks to be the nation's first 5G-enabled smart city. However, it currently has a 25% vacancy rate in its office properties, which is the highest in the Washington, D.C. area.
Quarterly Results
Quarterly results announced on August 8 after the close look like this (millions).
| Metric |
| Q2 2023 |
| Q2 2022 |
| YoY Growth |
| H1 2023 |
| H1 2022 |
| YoY Growth |
| Net Income |
| (-$10.5) |
| 123.3 |
| NA |
| $10.6 |
| $123.2 |
| (-91.4)% |
| FFO |
| $33.4 |
| $33.6 |
| (-0.6)% |
| $66.4 |
| $84.9 |
| (-21.8)% |
| Core FFO |
| $39.8 |
| $37.1 |
| 7.3% |
| $76.9 |
| $79.8 |
| (-3.6)% |
| Same-Store NOI |
| $78.3 |
| $79.1 |
| 0.1% |
| NR |
| NR |
| (-0.7)% |
Source: JBGS earnings release Aug. 8, 2023
Quarterly Core FFO rose YoY, by 7.3%, and FFO was flat, at (-0.6)%. But for the first half of this year, the results are dismal, with net income down a staggering (-91.4)% and FFO off (-21.8)%.
Commercial and office portfolio occupancy sagged 120 bps (basis points) from last quarter to 84.0%, but multifamily occupancy rose 80 bps to 93.7%.
JBGS bought back 9.3 million shares during Q2, at an average price of $14.54, and borrowed another $182 million at variable rates, while repaying $142 million worth of mortgage loans.
Growth Metrics
Here are the 3-year growth figures for FFO (funds from operations), and TCFO (total cash from operations). FFO for JBGS has yet to fully recover to pre-pandemic levels, but cash from operations has recovered, and FFO/share has grown by a 3-year CAGR of 4.17%.
| Metric |
| 2019 |
| 2020 |
| 2021 |
| 2022 |
| 3-year CAGR |
| FFO (millions) |
| $170 |
| $115 |
| $159 |
| $156 |
| -- |
| FFO Growth % |
| -- |
| (-32.4) |
| 38.2 |
| (-1.9) |
| (-2.82)% |
| FFO per share |
| $1.15 |
| $1.19 |
| $1.36 |
| $1.30 |
| -- |
| FFO per share growth % |
| -- |
| 3.5 |
| 14.3 |
| (-4.4) |
| 4.17% |
| TCFO (millions) |
| $174 |
| $169 |
| $218 |
| $178 |
| -- |
| TCFO Growth % |
| -- |
| (-2.9) |
| 29.0 |
| 2.3 |
| 0.76% |
Source: TD Ameritrade, Hoya Capital Income Builder, and author calculations
Meanwhile, here is how the stock price has done over the past 3 twelve-month periods, compared to the REIT average as represented by the Vanguard Real Estate ETF ( VNQ ).
| Metric |
| 2020 |
| 2021 |
| 2022 |
| 2023 |
| 3-yr CAGR |
| JBGS share price Aug. 8 |
| $28.40 |
| $31.05 |
| $23.76 |
| $16.84 |
| -- |
| JBGS share price Gain % |
| -- |
| 9.3 |
| (-23.5) |
| (-29.1) |
| (-16.0)% |
| VNQ share price Aug. 8 |
| $82.39 |
| $106.91 |
| $98.20 |
| $83.53 |
| -- |
| VNQ share price Gain % |
| -- |
| 29.8 |
| (-8.1) |
| (-14.9) |
| (0.46)% |
Source: MarketWatch.com and author calculations
JBGS shares have underperformed the VNQ in each of the past three 12-month periods, rewarding investors with a disappointing average annual return of (-16.0)%, while the VNQ has been flat at (0.46)%.
Since its IPO in 2017, shares in JBGS have yet to find a clear bottom, down (-45.6)% since it debuted at $36.89. Maybe this business model just doesn't work.
Seeking Alpha
Balance Sheet Metrics
Here are the key balance sheet metrics. As of June 30, JBGS is holding $166 million in cash, against debts totaling $2.5 billion.
| Company |
| Liquidity Ratio |
| Debt Ratio |
| Debt/EBITDA |
| Bond Rating |
| JBGS |
| 2.11 |
| 50% |
| 8.3 |
| -- |
Source: Hoya Capital Income Builder, TD Ameritrade, and author calculations
JBGS' liquidity ratio is on the good side at 2.11, its 50% debt ratio is typical of Office REITs in general, but its 8.3 Debt/EBITDA is pretty dismal. A troubling 29.6% of JBGS $2.35 billion debt is held at variable rates.
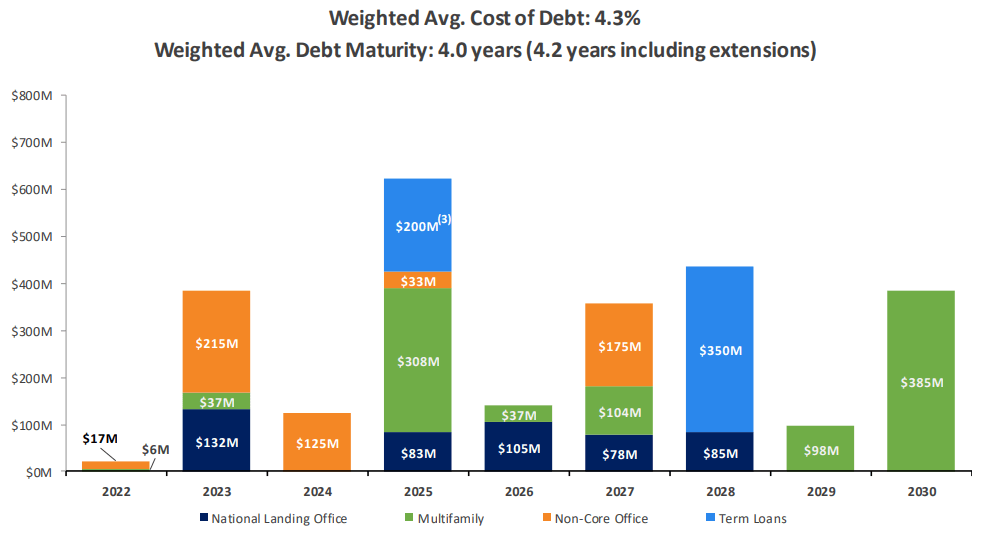
JBGS faces a total of $400 million in debt repayments this year, over half of which are for non-core office assets. Maturities in 2024 constitute only 5% of the total debt, but in 2025 faces over $600 million in maturing debt, which is more than 25% of the company's total indebtedness.
Dividend Metrics
JBG Smith has neither raised nor lowered its dividend since its inception. It is an above-average dividend payer, but that track record is in jeopardy. Usually, I like a Dividend Safety score of D+ or C-, but not in this case. The company's payout ratio is a slightly aggressive 70%, and further declines in revenues could lead to a dividend cut.
| Company |
| Div. Yield |
| 5-yr Div. Growth |
| Div. Score |
| Payout |
| Div. Safety |
| JBGS |
| 5.35% |
| 0.0% |
| 5.35 |
| 70% |
| D+ |
Source: Hoya Capital Income Builder, TD Ameritrade, Seeking Alpha Premium
Dividend Score projects the Yield three years from now, on shares bought today, assuming the Dividend Growth rate remains unchanged.
Valuation Metrics
The Price/FFO '23 multiple for JBGS is 13.9, which is a mild discount from the average REIT multiple of 16.7, but significantly higher than the average for an Office REIT. To some degree this undoubtedly reflects the more profitable multifamily aspect of the company, but it still seems high to me.
| Company |
| Div. Score |
| Price/FFO '23 |
| Premium to NAV |
| JBGS |
| 5.35 |
| 13.9 |
| (-19.1)% |
Source: Hoya Capital Income Builder, TD Ameritrade, and author calculations
Hoya Capital Income Builder estimates that JBGS would be a buy at $13.50, which is nearly 20% below its current price.
What Could Go Wrong?
All of JBGS assets are concentrated in the Washington, DC area. Any change in economic conditions affecting that small region could have an outsized impact on JBGS revenues and profitability.
A dividend cut is a distinct possibility, especially if the company struggles with declining revenues, which seems likely.
Although most observers believe the Fed has finished raising interest rates, it still could, and if so, the variable rate debt held by JBGS exposes it to further risk.
Investor's Bottom Line
Despite its transformational plans, and the interesting possibilities of the National Landing area, the brutal fact of the matter is that JBGS has been a losing proposition for investors since its inception in 2017, and the needle is still pointing down. At some point, this company could turn and start a long-term climb in share value, but that day doesn't appear to have arrived yet, nor is it on the foreseeable horizon. The dividend is above-average, but vulnerable to a possible cut in the next year or two. I rate the company a Sell.
Seeking Alpha Premium
TipRanks and Ford Equity Research also think JBGS will underperform, while the Street gives it a Hold rating.
As always, however, the opinion that matters most is yours.
For further details see:
JBG SMITH: The Needle Is Still Pointing Down