JBSAY - JBS Is A Quality Giant Trading At Low Cycle-Average Valuations
2024-01-20 03:09:26 ET
Summary
- JBS is the largest meatpacking company globally, with a strong market position and expanding into value-added products.
- The company's market power is evident in its growing margins and returns on capital, despite operating in commoditized markets.
- JBS's leverage is manageable, and its long-dated debt maturities and fixed interest rates enhance its value.
JBS S.A. ( OTCQX:JBSAY ) is the largest meatpacking company in the world. The company is the number one global processor and seller of beef and poultry and number two in pork. The company has also expanded downstream to value-added products like prepared foods, sausages, etc.
In my opinion, JBS shows a history of great capital allocation decisions that have consolidated its market power via the scale of purchasing, operations, and sales. This market power is evident in the company's growing margins and operating returns on capital despite operating in commoditized markets. Further, the company's strategy of growing downstream is greatly aided by its upstream cost advantages.
JBS is leveraged, but its debt has long-dated maturities and is mainly fixed interest. Further, given the company's return on assets, leveraging in these conditions becomes a value enhancer.
Because of recent margin problems caused by higher-than-normal correlation on its end markets, the company is trading at what I consider an enticing multiple of average past earnings, leaving future growth in scale and market power as an upside opportunity.
Signs and origins of scale moat
JBS' history shows two signs of a strong and growing moat.
The first one, in the chart below, is growing gross margins, which, coupled with more controlled SG&A to revenue levels, has also increased the company's operating margins (second chart below). The sudden fall in 2023 was abnormal and it will receive special treatment in a later section.
The second sign of market power is the increase in returns on capital. I like to calculate returns on capital as operating income over total assets, which is not a commonly used figure. The reason is that operating income reflects returns before capital is divided between debt and equity. In my opinion, dividing net income by total assets (classical return on assets or ROIC) makes no sense, as net income belongs to equity, while assets belong to equity and debt.
These charts tell us that JBS has been increasing its competitive position in its markets, at least for the past 15 years. This starkly contrasts with JBS operating in a commodity market, where margins are generally thin because the products are not differentiated.
In my opinion, JBS has built its margins and competitive strength via scale. The company is the largest food company in the world by revenue and the largest processor of beef and poultry, second in pork. In many countries, it is number one by a significant margin. The company operates in North America, South America, Europe, and Australia and sells in every continent.
Scale brings several advantages to JBS:
- It is a monopsony or oligopsony in most regions operating inside each country. This means that meat producers (cattle ranchers, poultry and pork factories, etc.) have little choice than selling to them. This allows JBS to set the purchase terms (price, payments, etc.). In Brazil, the largest beef exporter in the world, establishments with less than 50 heads control 75% of the country’s herd. These sellers have a shortage of working capital, lack of transportation, and lack of market-wide information. JBS is a giant compared to them.
- It can arbitrage processed meat across many factors: country of import and export, climate, feed costs, credit availability, qualities, import permissions, etc.
- It is way less exposed to common commodity cycles between regions. All meat industries (specially beef) suffer from over and under-supply cycles. But these cycles are circumscribed to a single geography and meat line (beef, poultry, or pork). During oversupply, producers are cash-strained, and prices fall. JBS can purchase in those regions while selling in high-price, under-supplied regions.
- Diversifying across exporting regions and countries can offer its customers higher supply security and supply chain simplicity. JBS can offer McDonald's or Walmart a single provider window serving their worldwide markets, simplifying a complex supply chain (meat is probably the most perishable, disease-prone, and regulated product in a supermarket). Once a supplier controls a sufficient amount of supply, market power moves to the supplier. If JBS controls 40%+ of the meat purchases of a large chain or country, the loss of that relationship can be catastrophic for the buyer.
- Traditional scale-based cost advantages like larger, more efficient facilities. This is a small component given that 80%+ of COGS in JBS' supply chain is the meat product itself.
Leveraging scale downstream
JBS can wield the upstream processing advantage, moving downstream to more value-added products. That has been the company's second strategic pillar (besides increasing scale).
This advantage appears in many areas. JBS' raw materials are cheaper than their competitors can buy from other meat processors. It can also subsidize its value-added products by reducing the processing margin of those raw materials. It can pressure competitors to behave correctly by threatening their supply if they purchase from JBS. Finally, it can ask for retail space in supermarket chains because it is already a pivotal supplier.
However, competition downstream requires a different approach, because of branding. JBS's advantage in the processing market is based on scale and pricing. This works because suppliers and purchasers are concerned with quality, price, and service. In the branded, consumer-oriented, value-added products market, a moat can be built using low-cost and subsidized raw materials, but eventually, a brand has to emerge. This has been the successful case of Seara and Friboi in Brazil, Pilgrim's Pride in the US, and Swift in many global regions.
Financial leverage
JBS is heavily leveraged. The company sustains $14 billion in net debts, with less than $10 billion in equity. However, I believe this level of leverage is both sustainable and desirable.
Starting with sustainability. JBS' average maturity is 12 years, meaning most of its debt is very long-term. Most importantly, 90%+ of that debt is fixed interest, with an average cost of 6.3%, or 1/2% above long-term US government bonds. This means the company will not suffer from spikes in interest costs, and if rates decrease back to (unsustainably) low levels, then it can repurchase and refinance.
Further, until before the recent margin problem, the company was consistently decreasing the weight of interest and debt compared to its operating capacity. In the charts below, I have removed 2023, which will be treated separately.
Finally, in dealing with desirability, I believe JBS is correct in leveraging.
A precondition is that the debt is sustainable, and we have seen it is, primarily because of long maturity and fixed interest.
The following condition is that the cost of the debt (the average 6/7%) is below the operating return the company can obtain from the assets financed by that debt. Returning to the operating income / total assets chart in the first section, the average ratio was 8% for the past 13 years (including 2013). If we refer to the past decade alone, the ratio was 9.5%. Further, that ratio showed a growing trend, which I associated with scale.
This means that JBS has obtained between 8% and 9.5% average returns on all of its capital and can finance part of that capital at very long-term maturities for 6 to 7%. Further, because the company is taking correct capital allocation decisions, that new capital is not decreasing but increasing the aggregate operating return on capital, further widening the gap. This is accretive to equity.
The company could have financed more of its acquisitions via equity, but it decided purposely to take debt, and return equity to shareholders in the form of continued dividends and share buybacks.
The recent margin decrease
In many of the above charts, everything works well until 2023, when gross margins collapse, carrying the rest with them (operating margins and leverage ratios).
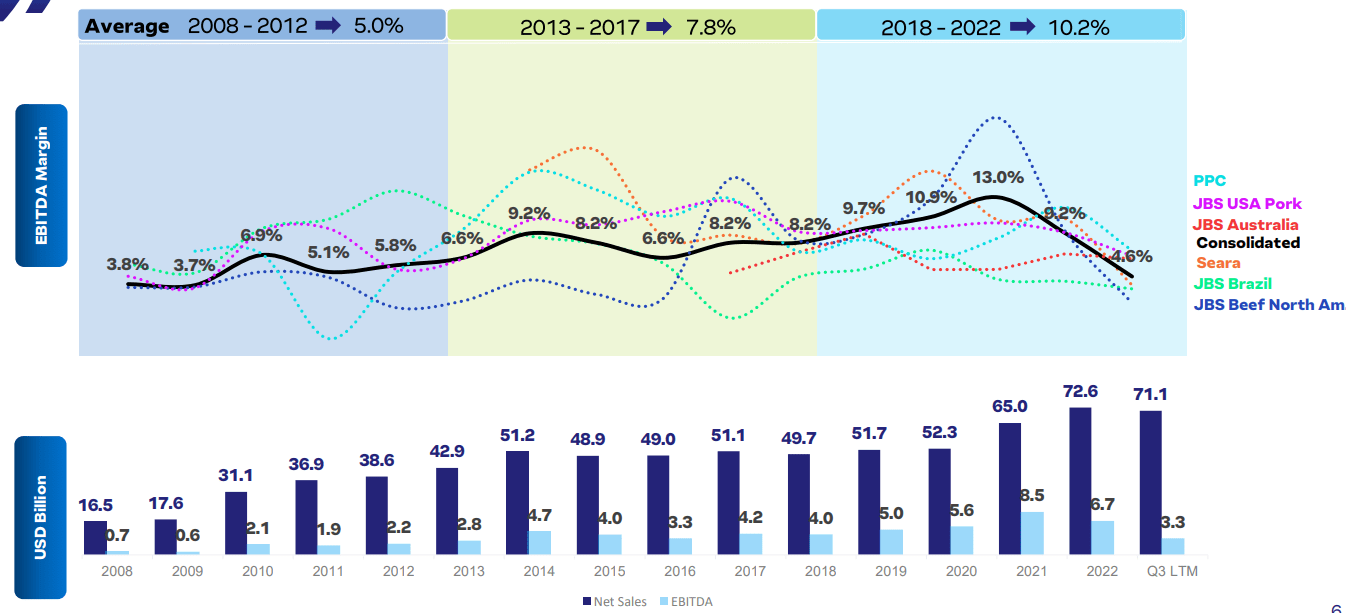
JBS claims that its geographical and protein diversification makes it resilient to specific cycles because when some markets-geographies are more strained, others are not. In the page below, from the company's presentation , the margins are separated by segment, showing how the trend is growing despite different markets undergoing bearish cycles.
JBS EBITDA margin and absolute values, aggregate and by segment (JBS IR presentation)
This claim has been vindicated for the past 13 years, with margins generally growing despite bearish movements in cattle and poultry prices.
However, the company claims that in 1Q23, all of its end markets underwent a significant margin fall. The company's management claims that in the past 50 quarters, only 4 times has there been such a low dispersion of margin direction, and 3 times of those 4, it has been positive. Management claim is, therefore that this was a 1 in 50 event.
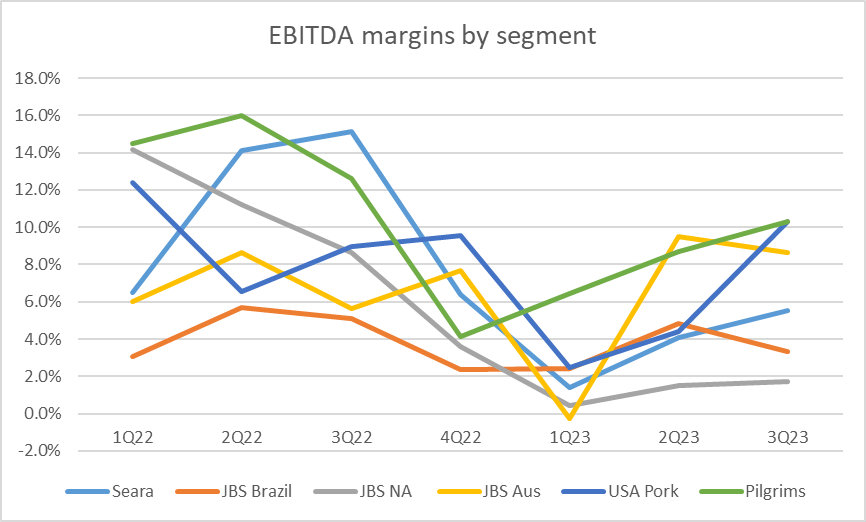
If we zoom into quarterly-level data, we can see that the falling trend twisted in 2Q23, and margins are recovering at the aggregate level (first chart). Further, at the quarterly segment level (second chart), several segments are back to 2022 profitability. That is the case of US Pork, JBS Australia, JBS Brazil, and, in some form, Pilgrims. The laggards are still Seara (value-added products in Brazil) and JBS North America (with the country undergoing the lower portion of the cattle cycle).
JBS EBITDA margins by segment (JBS fundamentals spreadsheet)
Valuation multiples
I do not believe that JBS can quickly (or permanently) return to the profitability it achieved during 2020-2022 because it coincided with a huge inflationary bout and a generalized bullish cycle across all commodities. That type of profitability instead marks a cyclical peak.
Further, given that JBS already controls a vast portion of the global meat market, I do not know how much more returns it can extract by scaling even more in the processing space. Higher returns on capital should come from investments in value-added products.
Fortunately, we do not need to assume more growth or profitability for JBS valuation to be compelling.
As commented before, for the past decade, JBS averaged a return on assets of 9.5%. The decade includes two cycle peaks (2014 and 2022) and two cycle valleys (2016-18, 2023-24). Coupled with an asset level of $40 billion, this implies average operating profits of $3.8 billion.
The average operating margin throughout that period has been 5.6%, resulting in a similar $3.9 billion operating profits when multiplied by the current $70 billion revenue level the company has reached.
Comparing this level of profitability with an EV of $27 billion already yields an attractive 7x EV/EBIT multiple.
For equity returns, we should remove around $1.4 billion the company is paying on its debt to reach a $2.5 billion average pre-tax profit.
Taxes are a complicated matter because of JBS' global operations. The average effective provision rate has averaged 40% for the past decade. This would leave $1.5 billion in average net income, yielding a 7x P/E ratio.
Given JBS' moat on its markets, history of successful capital allocation, and opportunities downstream, sustained by a strong balance sheet (in terms of maturities and interest cost), a 7x EV/EBIT and a 7x P/E ratio are attractive.
For further details see:
JBS Is A Quality Giant Trading At Low Cycle-Average Valuations