JEPI - JEPI: A 12% Yielding 'Retirement Dream ETF' With A Catch
Summary
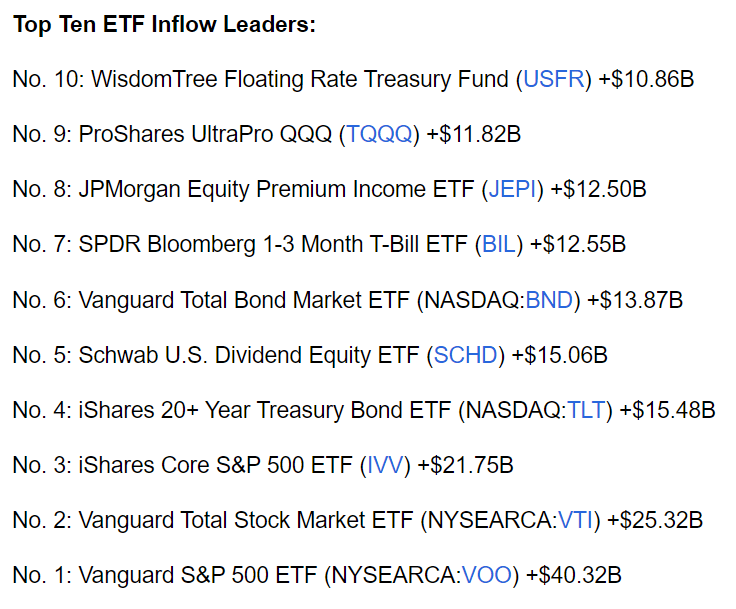
- JEPI was the 8th most popular ETF of 2022, and its 12% yield, paid monthly, has created a firestorm of investor interest.
- Since inception, JEPI has delivered an average yield of 9.3% and 13.4% annual returns, but with 37% less volatility than the S&P and with 50% smaller peak declines.
- Some investors consider it a "miracle" retirement ETF, but there are important things all investors need to know before buying it.
- According to management, JEPI is designed to deliver 5% to 8% yield over time, and 6% to 10% annual returns, 85% that of the S&P 500, with 35% lower volatility.
- 80% to 85% of JEPI's dividends are taxed as ordinary income, which means as much as 50% of the yield could go to the IRS if owned in a taxable account where the investor is in the highest tax bracket.
This article was published on Dividend Kings on Monday, January 23rd, 2023.
---------------------------------------------------------------------------------------
How would you like to earn a safe 12% annual yield, paid monthly?
Does that sound like a rich retirement dream stock? It does to many income investors, including five DK members who asked for an analysis of this ETF in the last week.
In fact, this ETF, the JPMorgan Equity Premium Income ETF ( JEPI ), was the 8th most popular ETF in 2022, with almost $13 billion in fund inflows.
Seeking Alpha
What if I told you this opportunity wasn't just one company, but an actively managed ETF from JPMorgan, run by a manager with 36 years of experience?
And what if I told you that this ETF had beaten the market since inception, with 13.4% annual returns and 37% lower volatility?
JPMorgan
5.3X the income of the S&P with better returns and far lower volatility? Sounds amazing doesn't it?
My family's hedge fund , the DK ZEUS Income Growth portfolio, is always looking for ways to improve our yield and long-term return potential. Theoretically, JEPI offers a great way to do just that.
What ZEUS Income Growth Would Look Like IF We Added JEPI
| Stock |
| Yield |
| Growth |
| Total Return |
| Weighting |
| Weighted Yield |
| Weighted Growth |
| Weighted Return |
| VIG |
| 1.9% |
| 10.0% |
| 11.9% |
| 8.33% |
| 0.2% |
| 0.8% |
| 1.0% |
| SCHG |
| 0.6% |
| 12.8% |
| 13.4% |
| 8.33% |
| 0.1% |
| 1.1% |
| 1.1% |
| JEPI |
| 11.6% |
| 4.1% |
| 15.7% |
| 8.33% |
| 1.0% |
| 0.3% |
| 1.3% |
| SCHD |
| 3.4% |
| 8.6% |
| 12.0% |
| 8.33% |
| 0.3% |
| 0.7% |
| 1.0% |
| EDV |
| 4.1% |
| 0% |
| 4.1% |
| 16.67% |
| 0.7% |
| 0.0% |
| 0.7% |
| DBMF |
| 9.0% |
| 0% |
| 9.0% |
| 8.33% |
| 0.8% |
| 0.0% |
| 0.8% |
| KMLM |
| 9.4% |
| 0.0% |
| 9.4% |
| 8.33% |
| 0.8% |
| 0.0% |
| 0.8% |
| AMZN |
| 0.0% |
| 19.2% |
| 19.2% |
| 5.56% |
| 0.0% |
| 1.1% |
| 1.1% |
| LOW |
| 2.0% |
| 20.6% |
| 22.6% |
| 5.56% |
| 0.1% |
| 1.1% |
| 1.3% |
| MA |
| 0.6% |
| 23.2% |
| 23.8% |
| 5.56% |
| 0.0% |
| 1.3% |
| 1.3% |
| BTI |
| 7.4% |
| 10.4% |
| 17.8% |
| 2.78% |
| 0.2% |
| 0.3% |
| 0.5% |
| ENB |
| 6.3% |
| 4.9% |
| 11.2% |
| 2.78% |
| 0.2% |
| 0.1% |
| 0.3% |
| MO |
| 8.3% |
| 5.0% |
| 13.3% |
| 2.78% |
| 0.2% |
| 0.1% |
| 0.4% |
| HASI |
| 4.3% |
| 10.8% |
| 15.1% |
| 2.78% |
| 0.1% |
| 0.3% |
| 0.4% |
| BAM |
| 4.0% |
| 14.6% |
| 18.6% |
| 2.78% |
| 0.1% |
| 0.4% |
| 0.5% |
| NEP |
| 4.1% |
| 13.5% |
| 17.6% |
| 2.78% |
| 0.1% |
| 0.4% |
| 0.5% |
| Total |
| 4.8% |
| 9.9% |
| 14.7% |
| 100.00% |
| 4.8% |
| 8.1% |
| 12.9% |
(Source: DK Research Terminal, FactSet, Morningstar)
At first glance, JEPI seems like a no-brainer addition to our family hedge fund, where I'm moving my entire life savings to, as is my Uncle.
Who wouldn't want a 5% yield and 13% long-term return while enjoying:
The Ultimate Sleep-Well-At-Night Retirement Portfolio For My Family's Needs
| Bear Market |
| ZEUS Income Growth |
| 60/40 |
| S&P |
| Nasdaq |
| 2022 Stagflation |
| -13% |
| -21% |
| -28% |
| -35% |
| Pandemic Crash |
| -9% |
| -13% |
| -34% |
| -13% |
| 2018 |
| -10% |
| -9% |
| -21% |
| -17% |
| 2011 |
| 4% |
| -16% |
| -22% |
| -11% |
| Great Recession |
| -20% |
| -44% |
| -58% |
| -59% |
| Average |
| -10% |
| -21% |
| -33% |
| -27% |
| Average Decline vs. Benchmark |
| NA |
| 47% |
| 29% |
| 36% |
| Median |
| -10% |
| -16% |
| -28% |
| -17% |
| Median Decline vs. Benchmark |
| NA |
| 63% |
| 36% |
| 59% |
(Source: Portfolio Visualizer Premium, Charlie Bilello, Ycharts)
Excellent yield, great returns, and super low volatility? If JEPI could actually deliver on its recent yield and returns, then it would truly be a world-beater blue-chip addition to our portfolio.
- a portfolio that's likely to pay for my sister's kids to go to college
- and buy them a home
- and pay for their retirement
- and buy my parents a house in Poland
- and pay for my kids college educations
- and help boost my Uncle's charitable donations into the tens of millions
So this weekend, I spent many hours researching the pros and cons of JEPI to see if this 12% yielding monthly dividend ETF was too good to be true.
And what I found has important implications for any retiree hoping JEPI is the answer to their rich retirement dreams.
What Does JEPI Do?
JEPI is a kind of covered call ETF, meaning it writes options against an underlying portfolio of stocks.
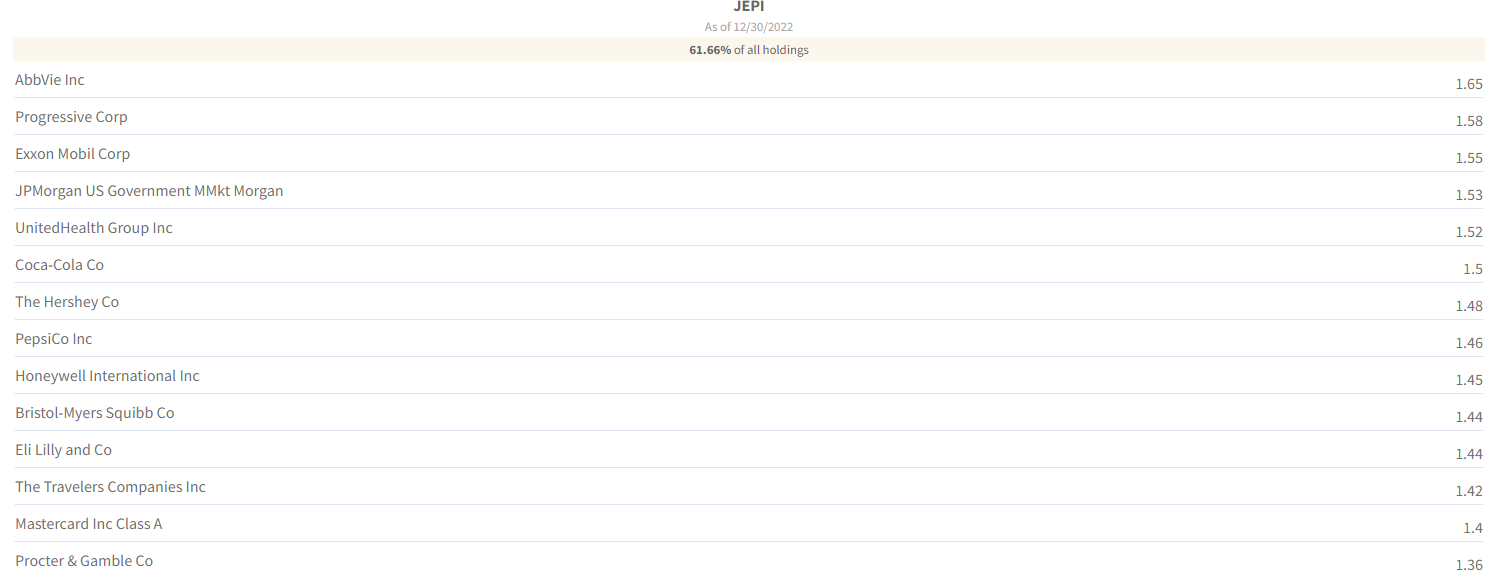
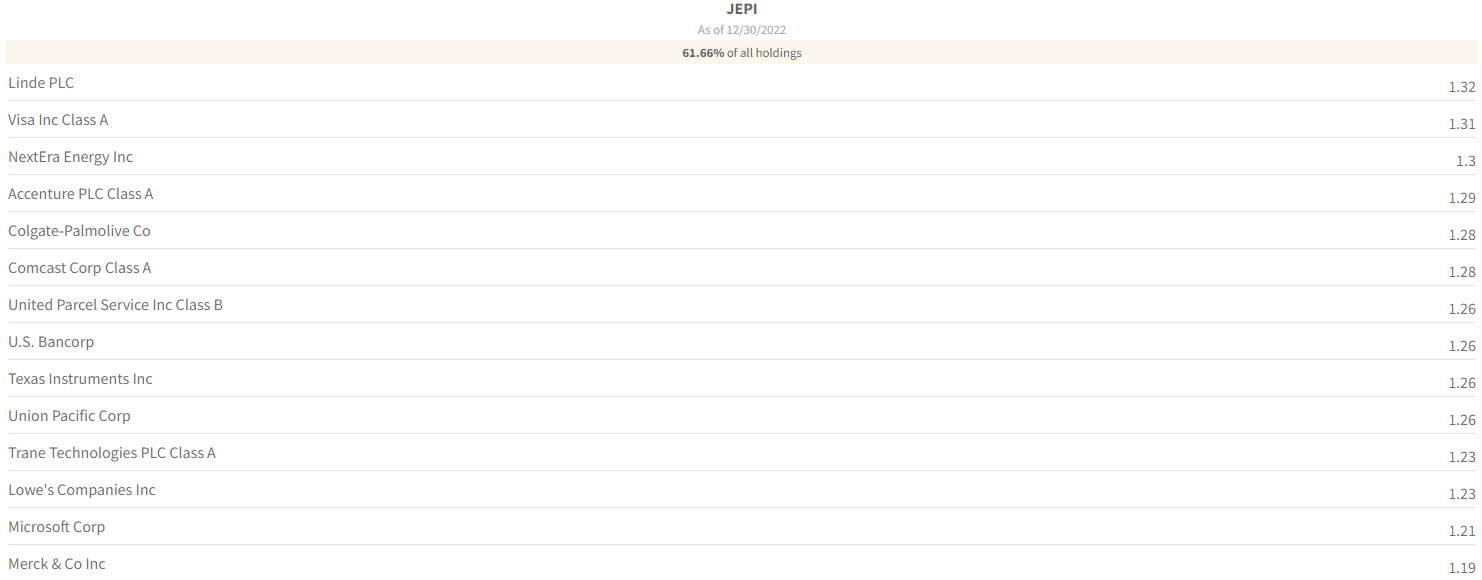
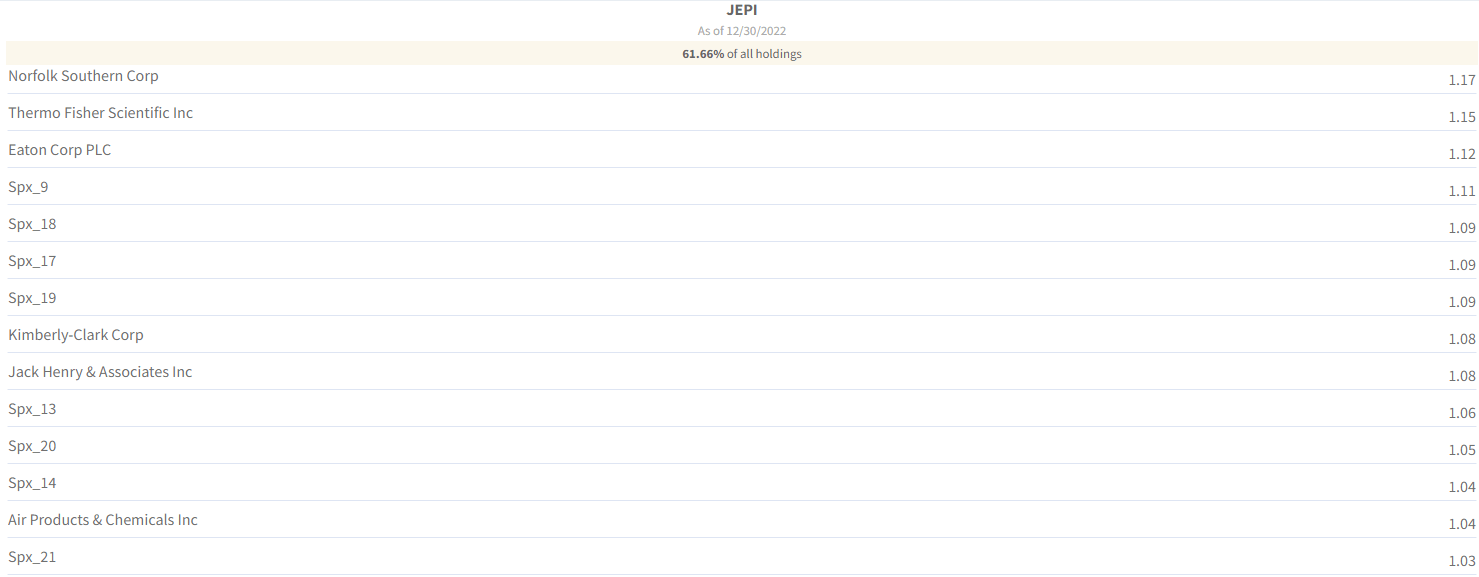
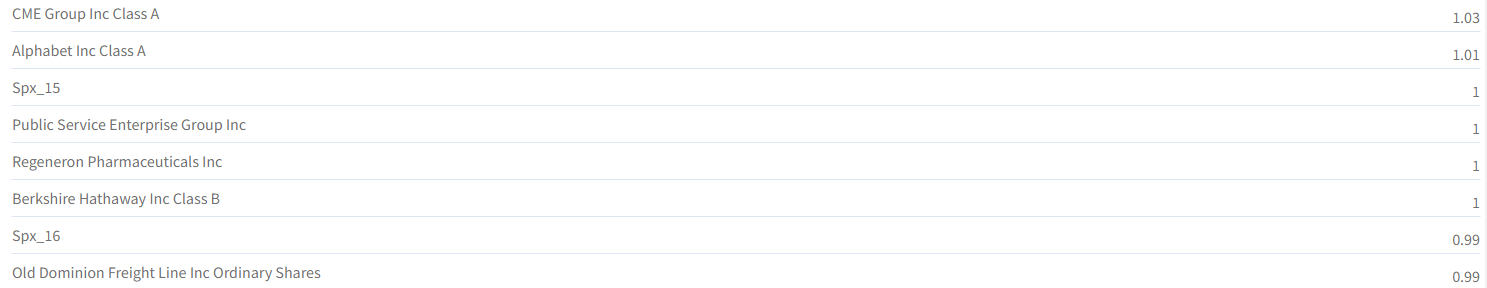
JEPI's Top 50 Holdings
Fund Visualizer
Fund Visualizer
Fund Visualizer
Fund Visualizer
JEPI owns 111 companies, some of the best blue-chips on earth. It's a diversified, generally low-volatility portfolio that yields about 2% right now.
JPMorgan
It's led by a team of six, including some executives with 36 years of experience in derivatives and covered call strategies.
JPMorgan
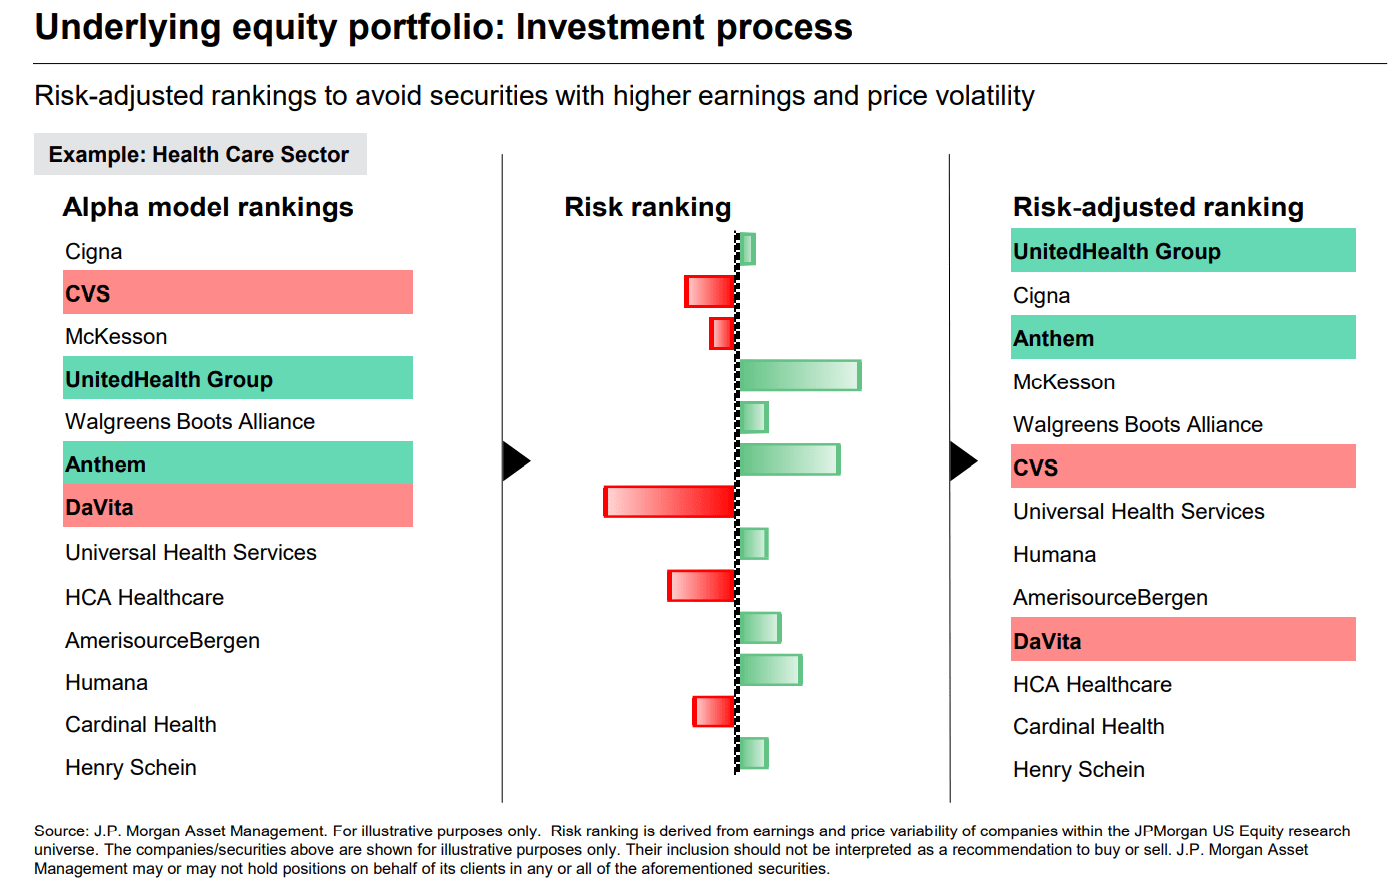
This team uses a proprietary strategy that ranks the companies that pass its quality screen by earnings and price volatility. This is to maximize volatility-adjusted returns over time.
JPMorgan
Management's goal is to deliver around 8% to 9% annual returns, including dividends, with about 37% lower volatility than the S&P.
Beating the market isn't the goal, and JEPI's prospectus makes it clear that investors shouldn't expect this to continue.
What makes JEPI different than most covered call ETFs is two things.
First, it uses equity-linked notes, or ELNs, instead of standard covered call writing.
- Most of these contracts are for one week.
Second, its ELNs are out of the money, rather than the industry norm of near or in-the-money calls, which tend to be for one month.
An equity-linked note ((ELN)) is an investment product that combines a fixed-income investment with additional potential returns tied to equities' performance. Equity-linked notes are usually structured to return the initial investment with a variable interest portion that depends on the performance of the linked equity." - Investopedia
Basically, ELNs are agreements with other institutions that generate income and are a POTENTIALLY superior alternative to covered calls.. . unless there is a financial crisis and some of its counterparties default on these contracts.
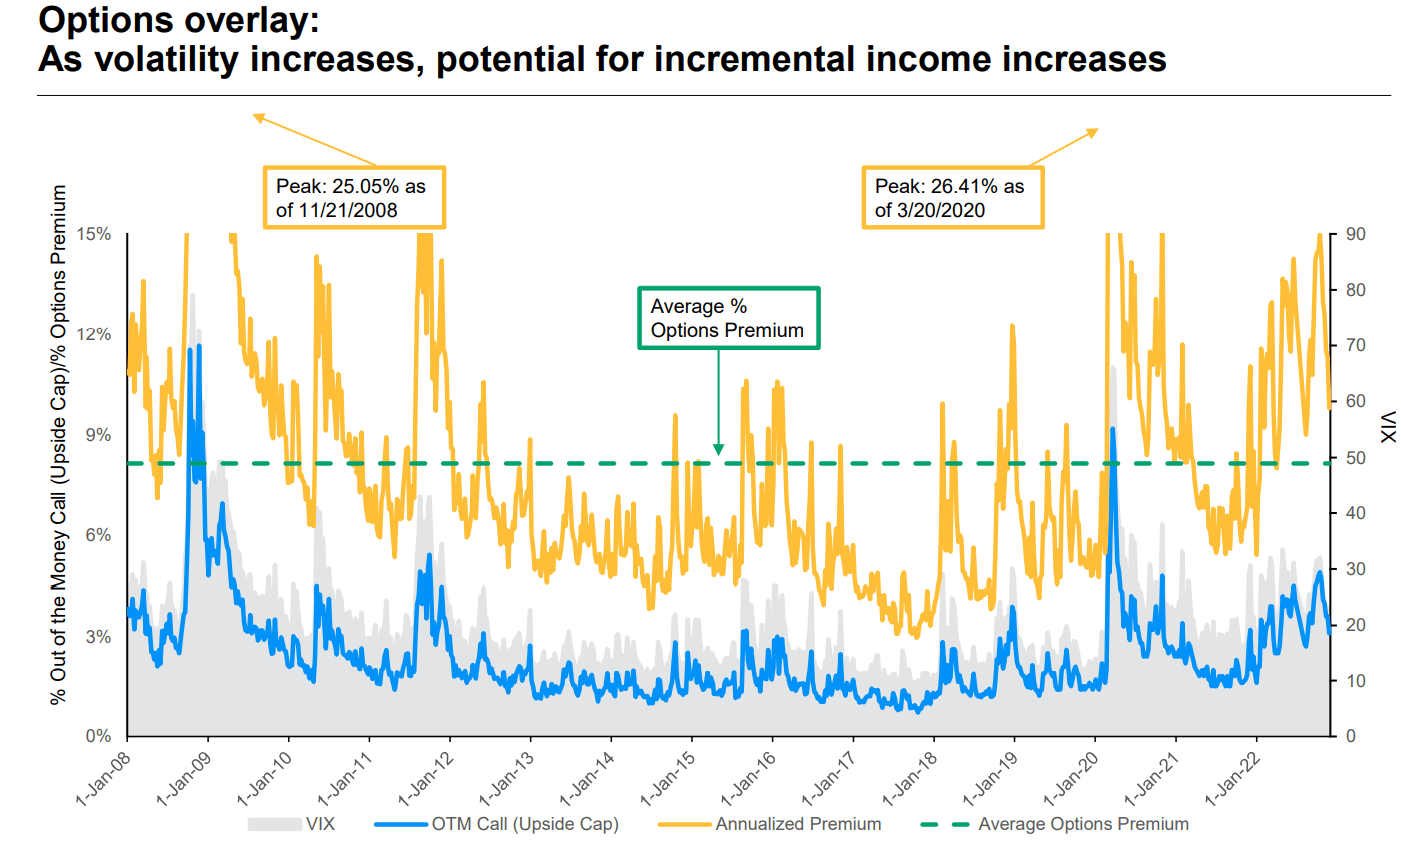
It's a more aggressive strategy that takes advantage of market volatility to generate high income.
JPMorgan
Over the past 15 years, the market has averaged about 8% ELN income premiums, including four bear markets and two crashes.
- 5% to 8% long-term yields are what management is guiding for
15% to 20% of JEPI's portfolio is ELNs that makeup almost all of its income, which is what it pays out as monthly dividends.
In other words, 80% to 85% of the portfolio is world-class blue-chips designed to generate returns, while 15% to 20% of the portfolio generates almost all of the income.
Why Everyone Loves JEPI
Why was JEPI the 8th most popular ETF for new inflows in 2022?
Ycharts
In a year when both stocks and bonds fell about 18%, the 60/40 fell 16%, and the Nasdaq lost a third of its value, JEPI's sky-high yield helped it fall just 3.5%.
- -13.8% excluding dividends
- still better than the market
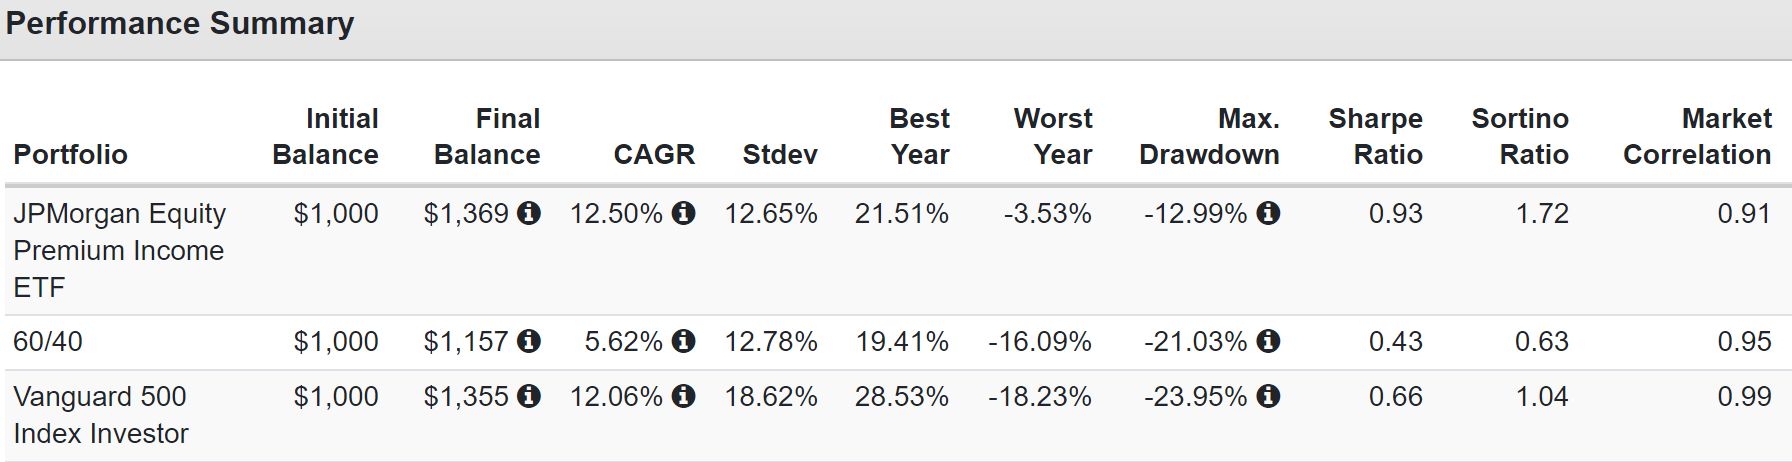
Historical Returns Since June 2020
Portfolio Visualizer Premium
Since its inception, JEPI has been a rockstar capturing 60% of the market's downside but 70% of its upside. It's averaged a yield of 9.3% during this time.
Its annual volatility was as low as the 60/40's and 33% less than the S&P 500, and its negative-volatility-adjusted returns (Sortino ratio) were about 70% better than the S&P's.
In fact, it managed to outperform the S&P, thanks to its ultra-yield and low volatility construction.
Portfolio Visualizer Premium
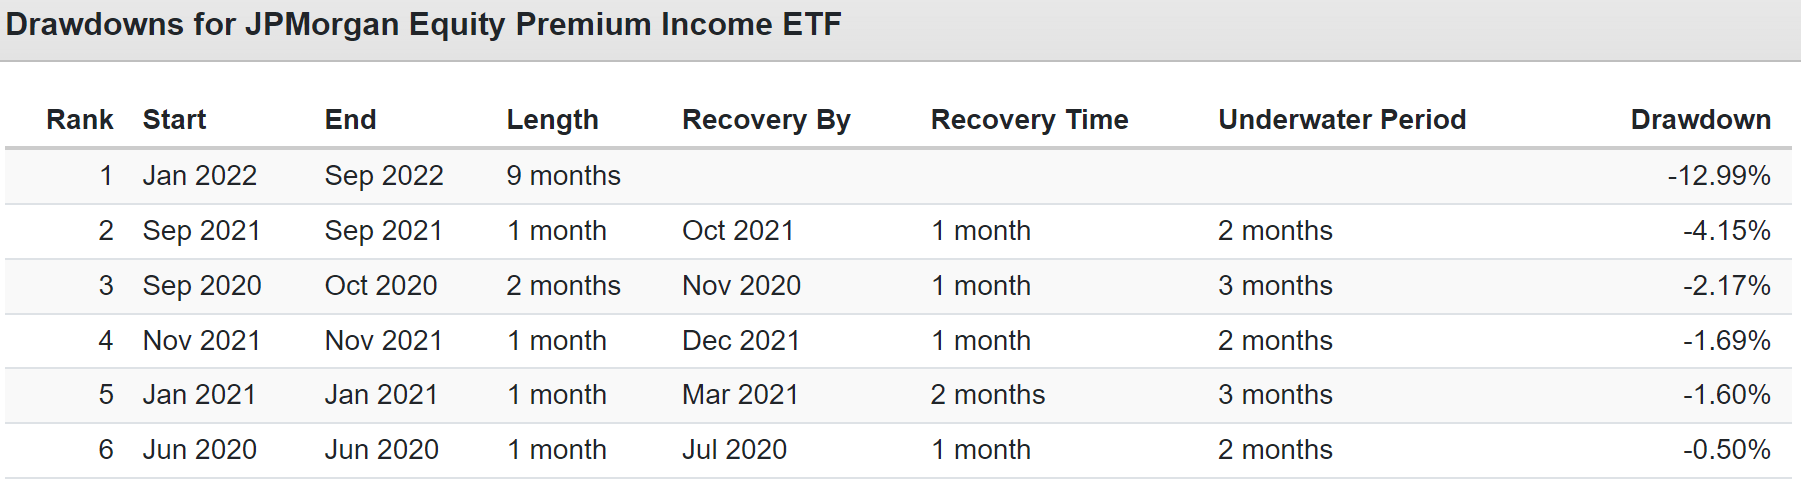
Its peak decline during the 2022 bear market (so far) was just 13%. How impressive is that?
- Nasdaq: -35%
- S&P -28%
- 60/40: -21%
- ZEUS Income Growth: -13%
- JEPI: -13%
9.3% average yield and a peak decline half that of the stock market? Can you see why income investors love this ETF?
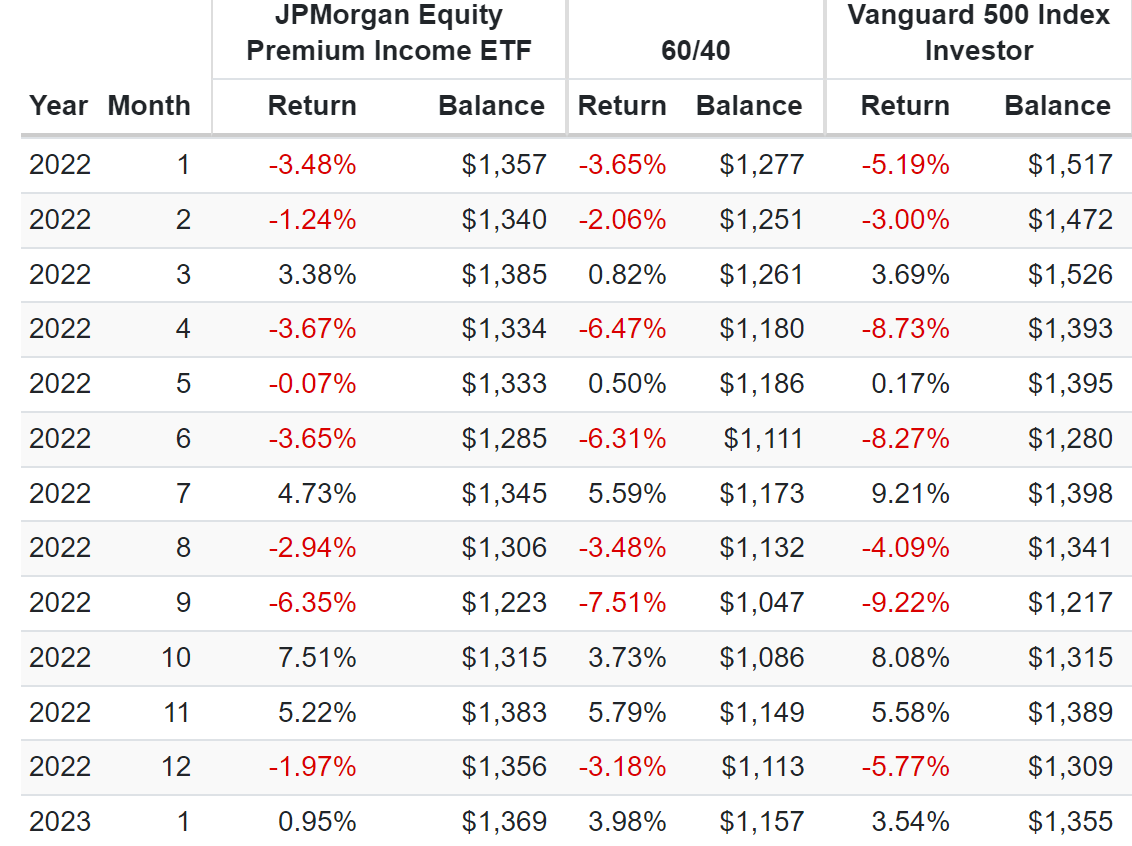
Speaking of income, look at how steady JEPI's income has been.
Portfolio Visualizer Premium
When the S&P fell 9% in September 2022, JEPI fell just 6%.
When the market fell 8% in June, JEPI, fell half as much.
When the market fell 9% in April, JEPI fell less than 4%.
JEPI is a kind of hedge fund, but one that is focused on maximum income today and low volatility in even the most extreme market conditions.
And thus far, it's performed better than even JPMorgan expected.
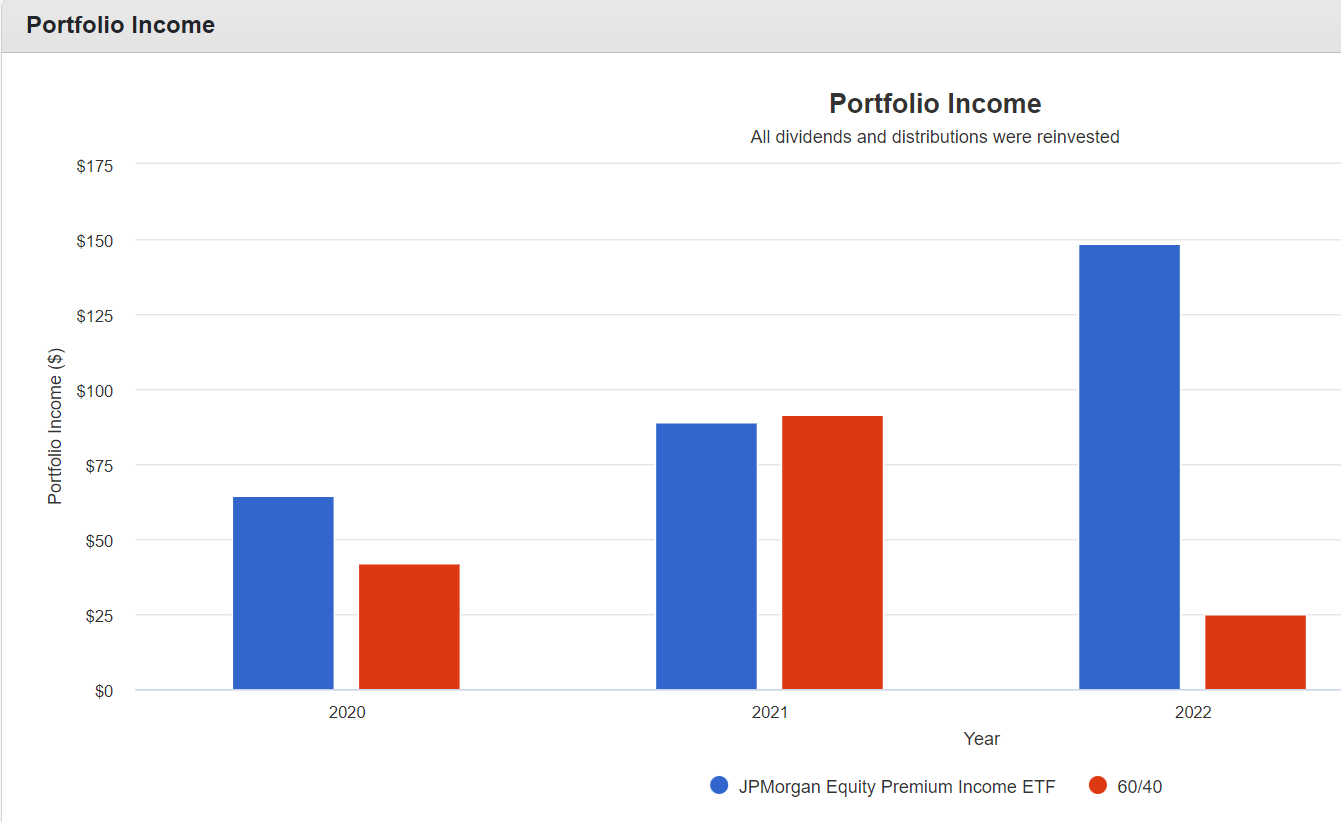
But one of the most impressive things about JEPI isn't just the low volatility, and ultra-yield, but how steady its dividends have been.
Portfolio Visualizer Premium
Covered call ETFs aren't known for stable dividends, but on an annual basis, JEPI has delivered remarkably steady and quick income growth.
That's in both a soaring market (2021), a crashing market (2022), and most recently in a sideways market.
Up, down, or sideways, JEPI has been an ultra-yield rich retirement dream stock.. . so far.
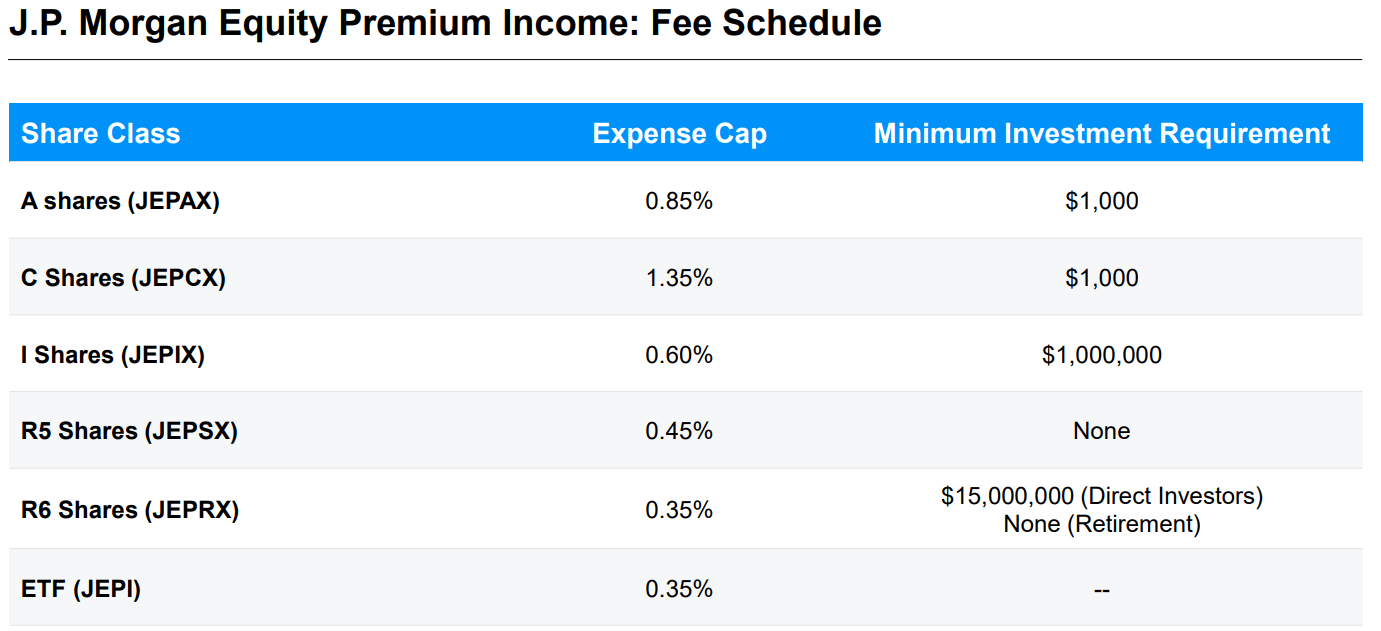
JPMorgan
And all this is for an expense ratio that's as low as the institutional fund with a $15 million minimum investment. For context, 0.35% is the same expense ratio as the ProShares S&P 500 Dividend Aristocrats ETF ( NOBL ).
What About JEPQ?
JPMorgan has a growth-focused covered call ETF called JPMorgan Nasdaq Equity Premium Income ETF ( JEPQ ) that yields 9% and also pays monthly dividends.
You might think this is a growth version of JEPI, and several DK members have told me they own it under this precise thesis.
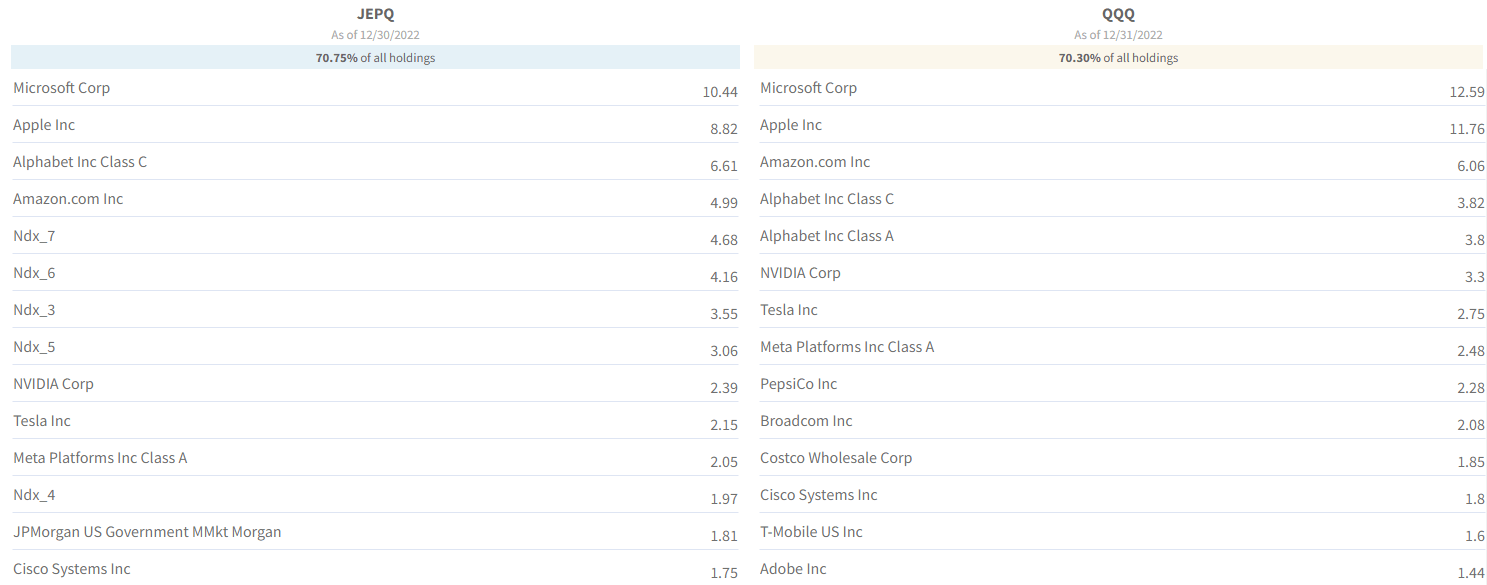
JEPQ And Nasdaq 100 Top 14 Holdings
Fund Visualizer
JEPQ is an actively managed fund that owns similar stocks to the Nasdaq 100, but it's a slightly different portfolio.
JEPI is designed for maximum yield and minimal returns, which is why it owns low volatility blue-chips.
There is inherently less upside potential at risk from ELNs (an alternative version of a covered call) because what JEPI owns is slower growing.
In contrast, JEPQ owns a higher volatility, faster-growing portfolio whose ELN caps the upside more than JEPI's ELN strategy does.
Thus while JEPQ should have superior upside potential compared to something like QYLD, you should expect higher volatility from JEPQ than with JEPI, lower income, and worse returns relative to its target benchmark (the Nasdaq 100).
Historical Returns Since June 2022
Portfolio Visualizer Premium
I'm not as impressed with JEPQ as I am with JEPI because it muddles its strategy resulting in higher volatility, bigger declines, and lower income.
Why did JPMorgan launch JEPQ? Because in 2022, JEPI was a rockstar and was attracting massive inflows. So they probably figured it was the best time to launch something that seemed similar and could be marketed as "JEPI with growth stocks."
But as you can see, a muddled focus has done exactly what one would expect from JEPQ's strategy, disappointing income investors.
OK, so JEPQ might not be great, but JEPI is a rich retirement dream stock right? While it's an attractive option for some, it's hardly a "must own" magic bullet to a rich retirement.
Reasons JEPI Isn't Right For Everyone
Covered call ETFs generally perform best in volatile sideways markets, and don't tend to lose as much when we see a bear market.
- with face-ripping bear market rallies that fail
- and big crashes that result in high-option premium
- an overall sideways market that generates massive option income
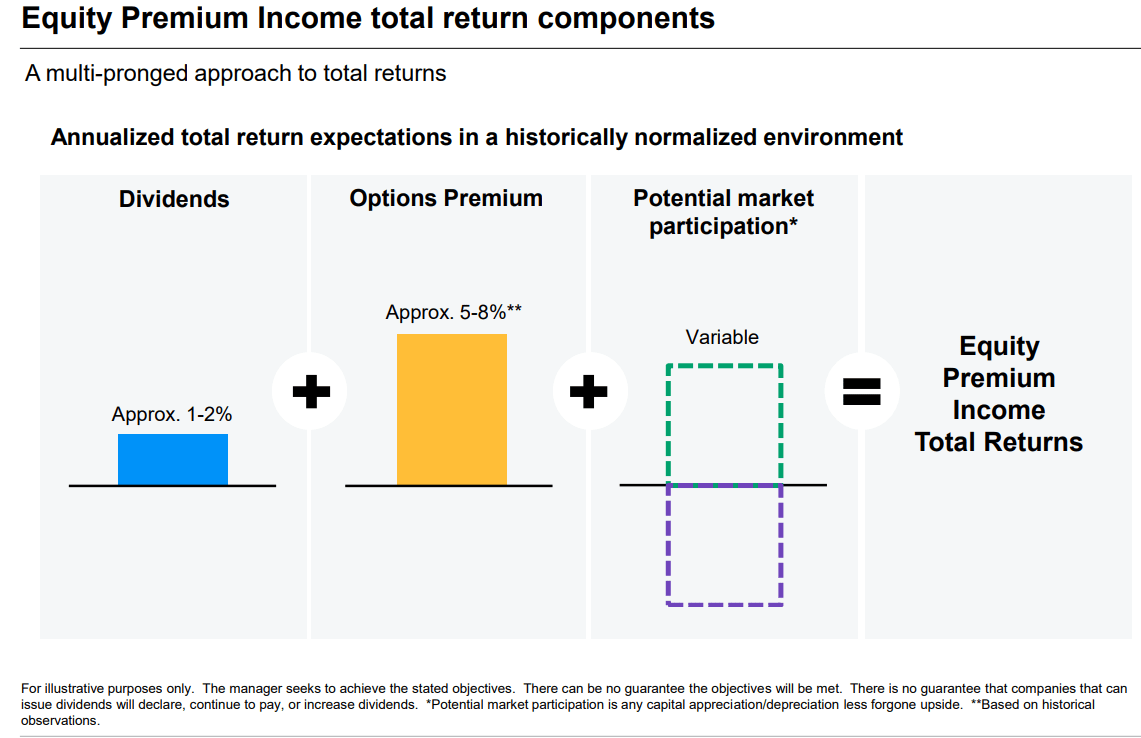
What does JEPI's management expect long-term from their super popular ETF?
JPMorgan
About 6% to 8% returns, or roughly 85% of the market's long-term upside potential, but with 5% to 8% yield and about 35% less volatility.
That's the true investment thesis for JEPI, which all investors need to realize.
But what about the 9.3% average yield and almost 13% market-beating returns? That's over 1.5 years which JPMorgan's own research indicates is just 6% likely to continue long-term.
What evidence do we have that JEPI's management guidance is likely to be closer to 8% than 13%?
We can use JEPIX, the institutional mutual fund version of JEPI, as a proxy to see how this strategy performs over a longer period.
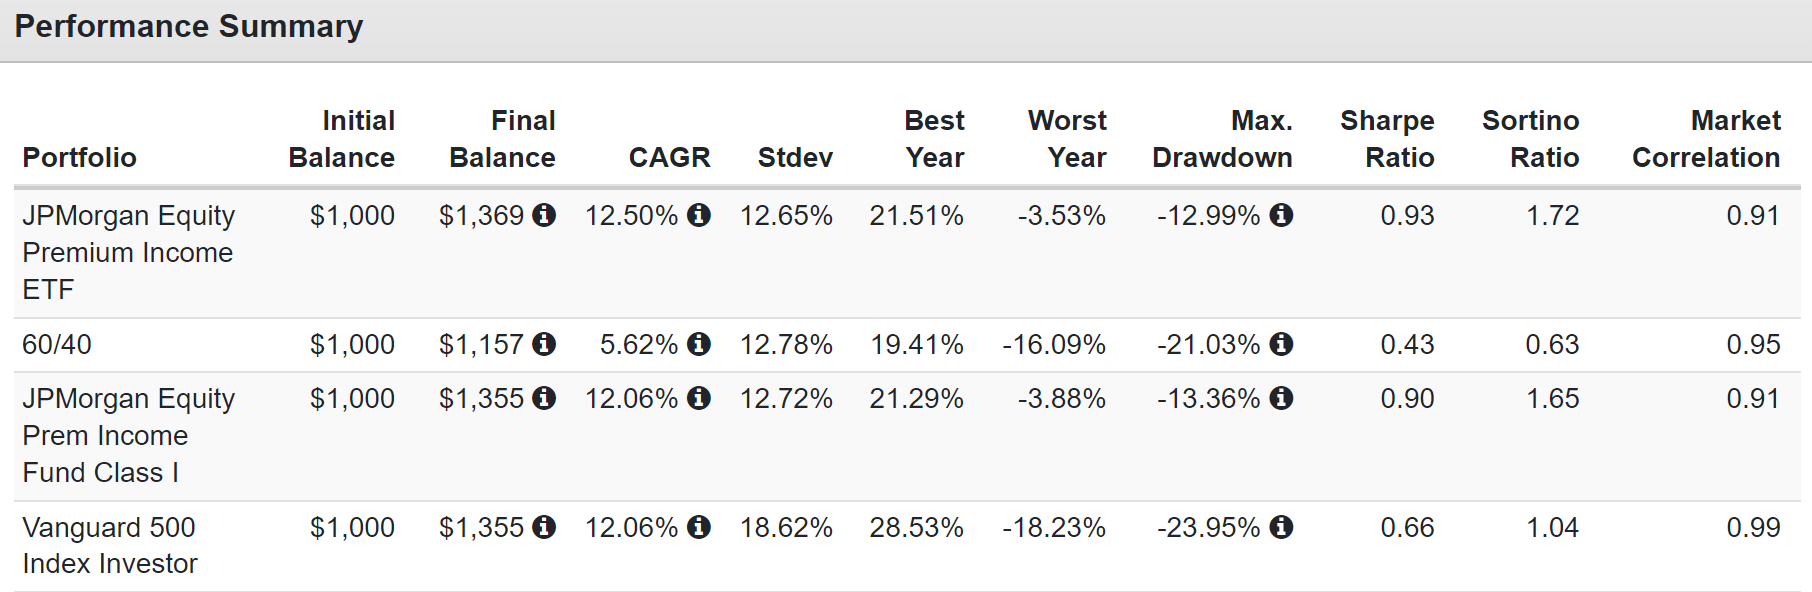
Historical Returns Since June 2020
Portfolio Visualizer Premium
As you can see, JEPI and JEPIX have nearly identical return and volatility profiles.
Their annual volatility is basically the same as their peak declines.
Ycharts
JEPIX and JEPI have nearly identical yields, confirming that JEPIX is a higher-cost mutual fund version of JEPI.
But one that has been around since September 2018.
Historical Returns Since September 2018
Portfolio Visualizer Premium
Management is guiding for 8% long-term returns; since inception, JEPIX has delivered 8% returns.
- 85% of the market's returns vs. 80% management target
Management strives for 35% lower volatility than the market, and JEPIX delivered 30% less volatility.
JEPIX has been delivering exactly what JPMorgan's management says JEPI can deliver in the future: smaller declines during bear markets but still declines.
Portfolio Visualizer Premium
During the Pandemic crash, JEPIX didn't do much better than the S&P, because it was such a quick collapse and there wasn't time for monthly yield to cushion the blow.
In future market flash crashes, the same kind of returns are likely.
- JEPI isn't necessarily a great alternative to other kinds of diversified portfolios like a 60/40 or ZEUS:
Portfolio Visualizer Premium
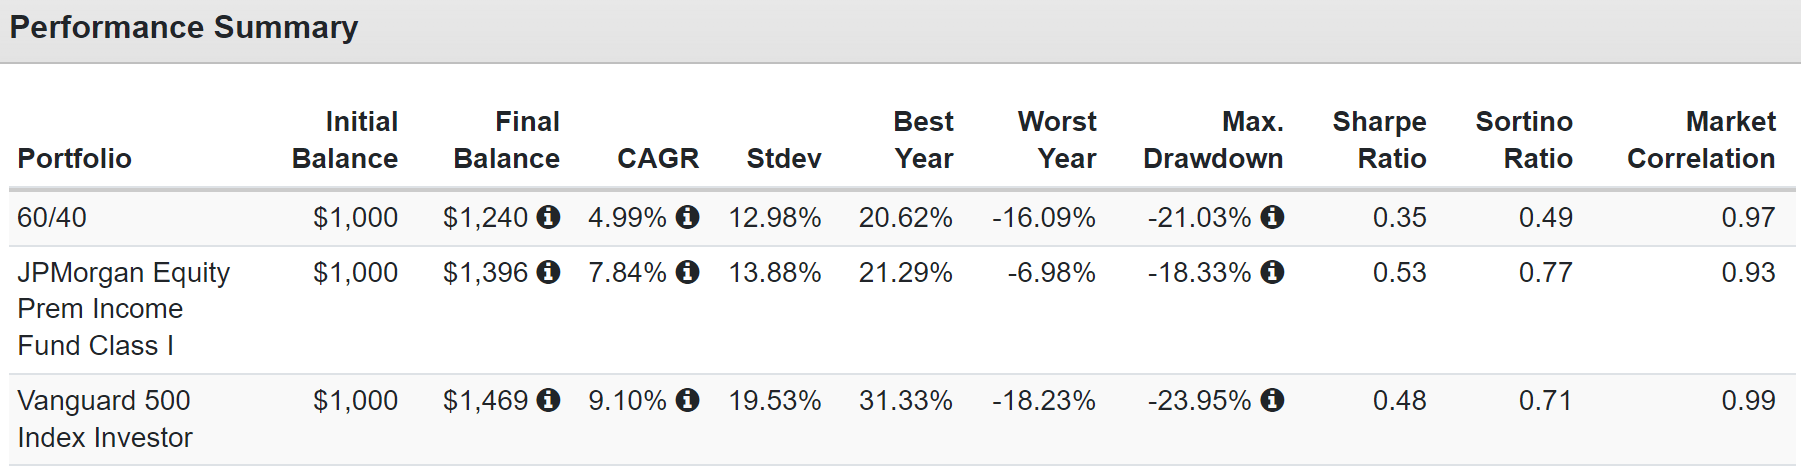
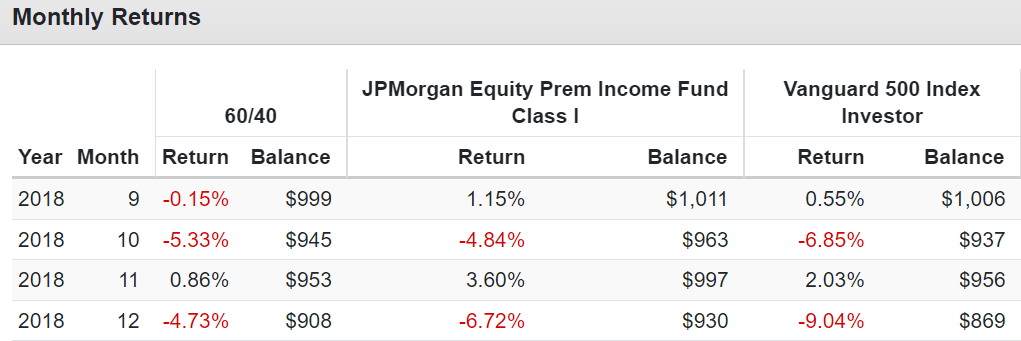
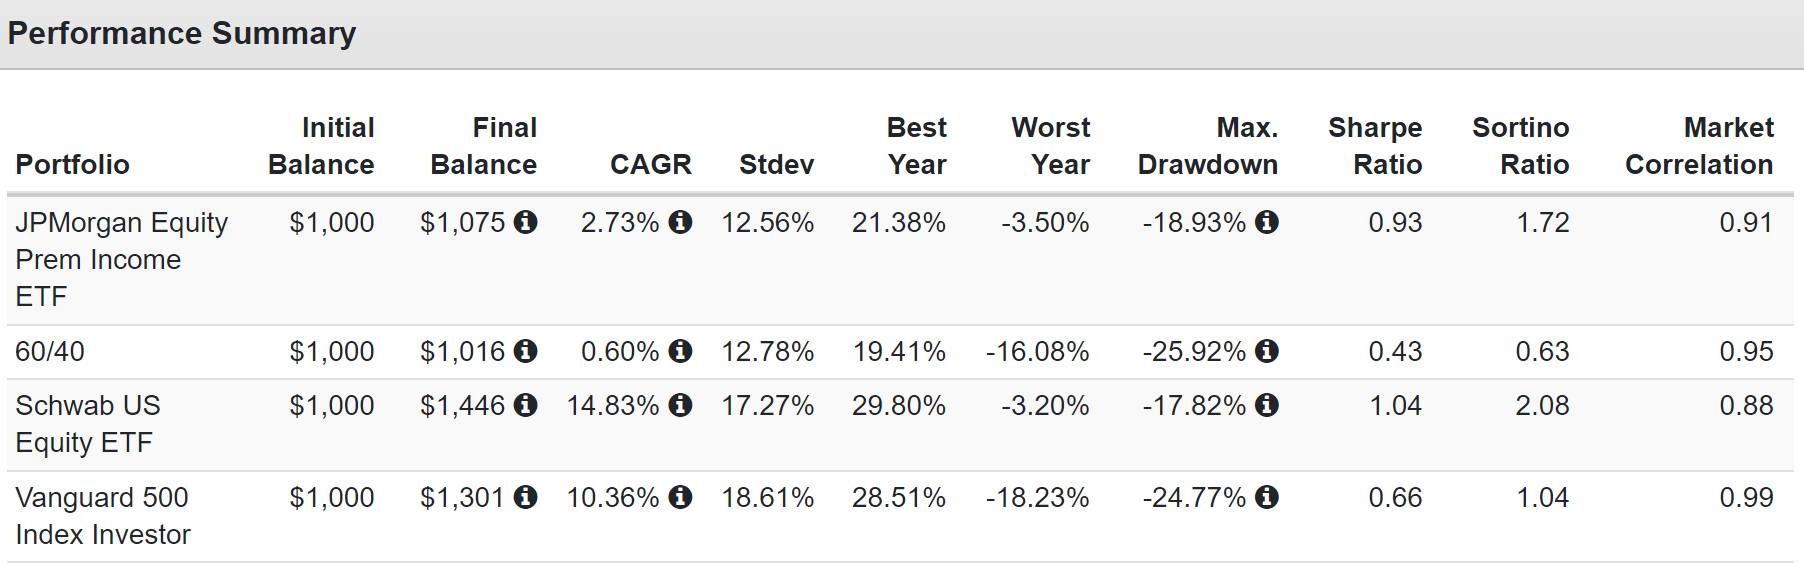
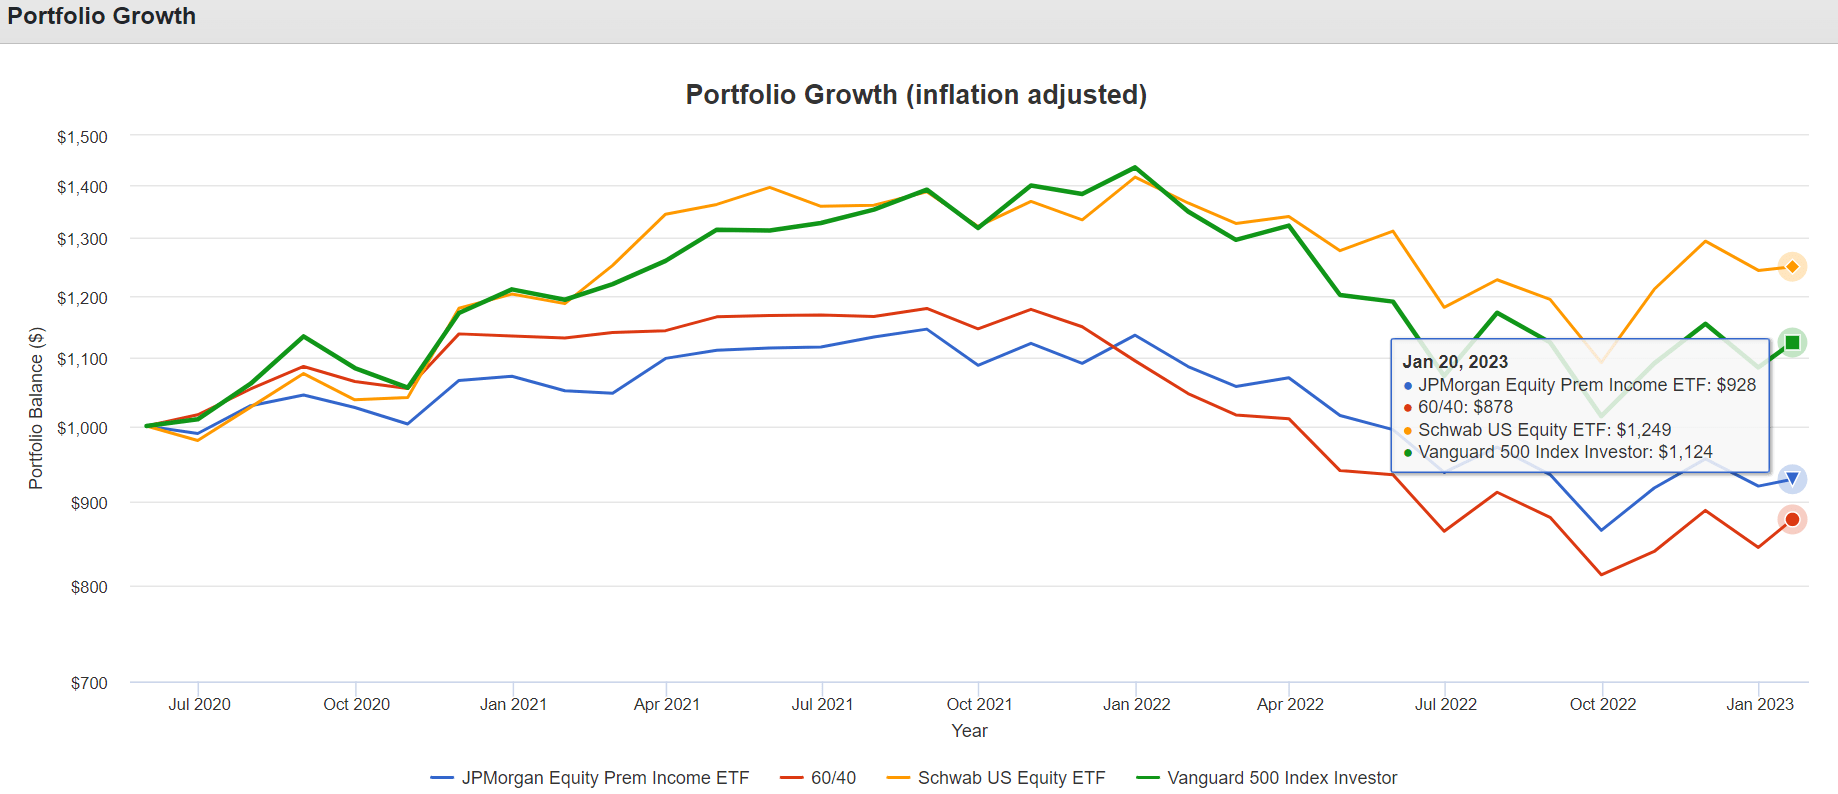
JEPIX fell just 8% at its peak during the 2018 bear market, which was slightly better than the 60/40's 9%.
And when the market fell 9% in December 2018, JEPIX fell 6.72%, or 7%, slightly worse than management expected.
OK, so JEPIX has delivered the 8% returns management expected for 2.5 years, but isn't there a chance it might perform better in the future?
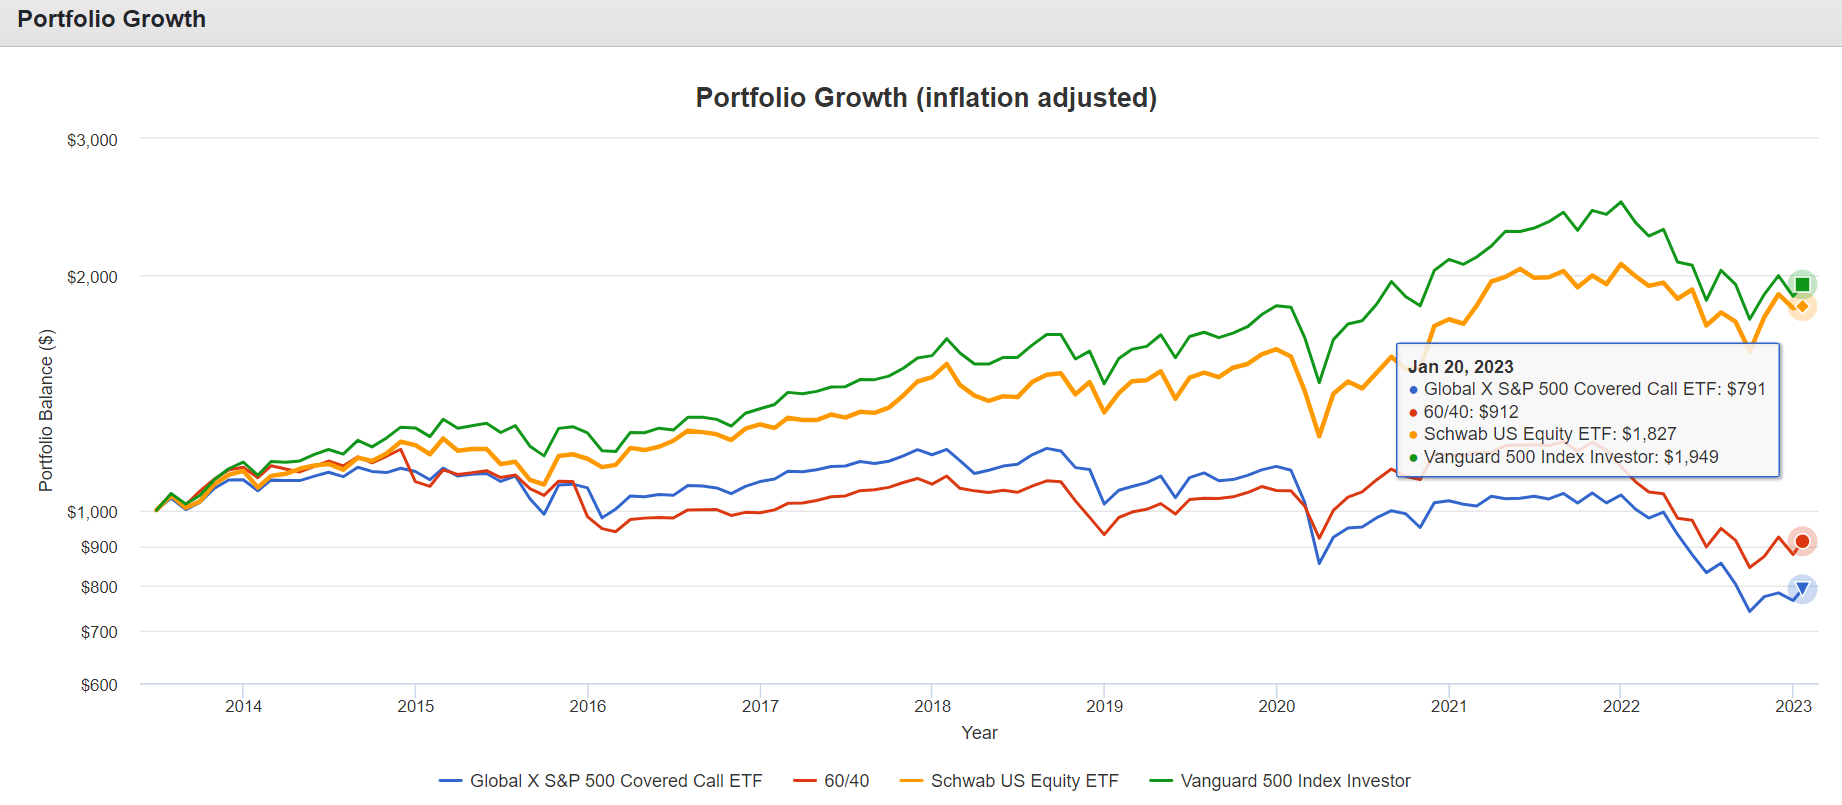
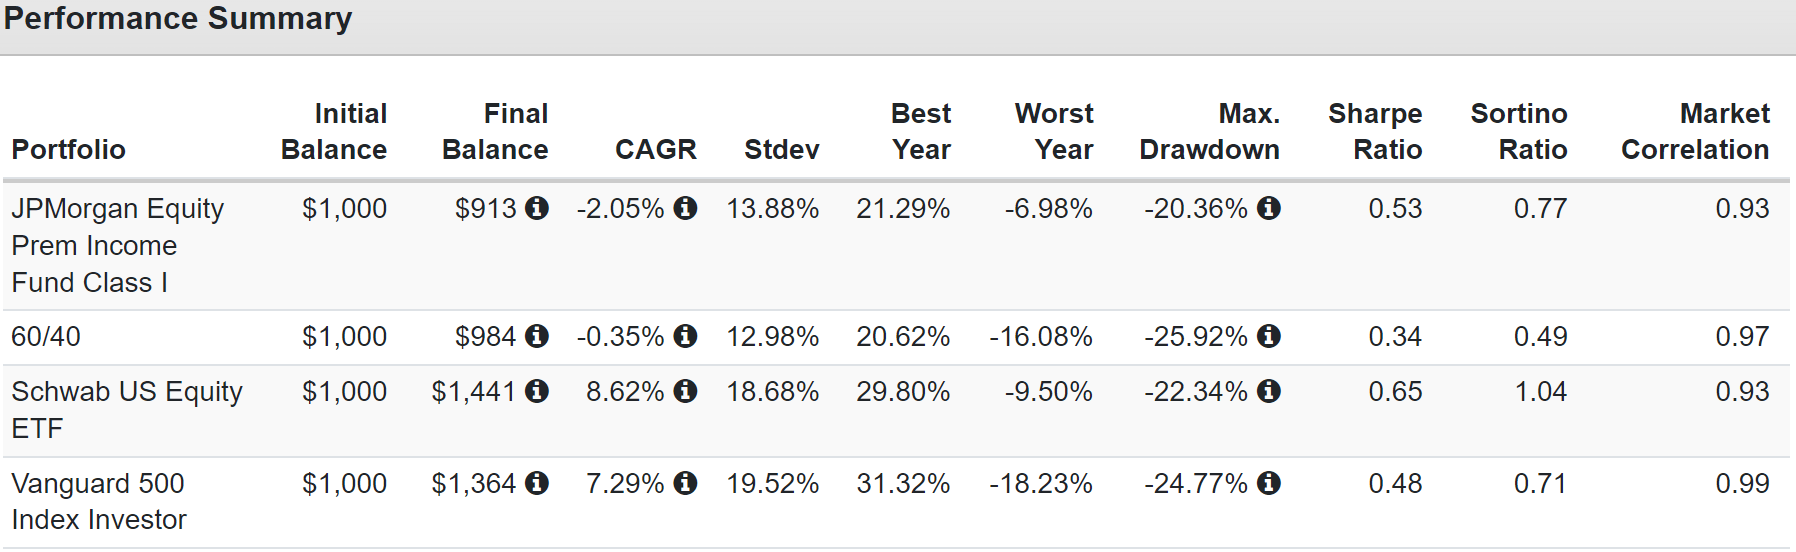
To see why that's unlikely, let's compare JEPIX to the Global X S&P 500 Covered Call ETF ( XYLD ), the oldest covered call ETF.
Historical Returns Since September 2018
Portfolio Visualizer Premium
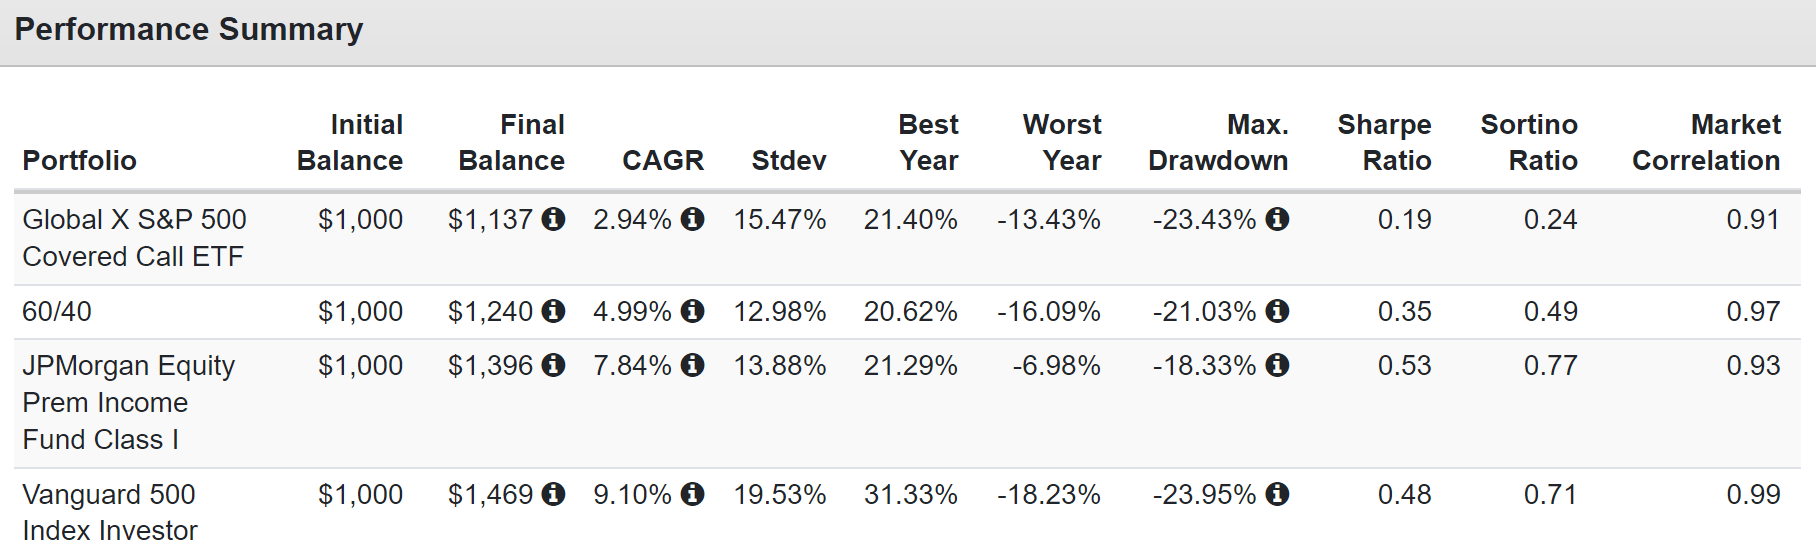
Compared to XYLD, JEPIX proved a far superior covered call fund, with 5% better annual returns, lower volatility, and much smaller peak declines.
In fact, its negative volatility-adjusted returns were 3X better than XYLD and about 7% better than the S&P.
- This is why I (and some other analysts) consider JEPI the gold standard of covered call ETFs
JEPIX's use of out-of-the-money ELNs compared to XYLD's at-the-money covered calls and a superior portfolio of low-volatility blue-chips made all the difference for income investors.
Historical Returns Since 2013
Portfolio Visualizer Premium
XYLD's historical returns during a strong bull market were 57% good, far below the 80% JEPI's management expects from their superior ETF.
Volatility was lower, but not as low as what JEPI's management expects, and has delivered during some very extreme market conditions so far.
Morningstar's analysts expect about 12.6% long-term returns from JEPI, and if you add the 5% historical outperformance of JEPIX over XYLD, you get around 11% to 12% potential returns.
However, remember that JEPI's management guidance is for 6% to 10% returns, with just a 6% chance that JEPI can continue delivering its 12% to 13% returns so far.
The Most Important Catches To Owning JEPI
Ok, so maybe JEPI should be thought of as a 6.5% yielding low volatility blue-chip ETF that generates 8% long-term returns and experiences 35% less volatility than the S&P.
But that's still awesome; many people would love to own that. But there are three very important catches to JEPI that you need to know before you buy it.
First, let's not forget that a key reason JEPI has such a great yield and such remarkable returns so far is its use of ELNs. The risk with those is that if counterparties default on those contractual obligations, JEPI can blow up.
- not necessarily the portfolio itself which is 80% to 85% blue-chips
- but 80% to 85% of the income could potentially collapse in another financial crisis
In other words, those who think they can safely buy 100% JEPI and retire rich are taking on much more income risk than they believe, especially if they think JEPI's income will keep rising yearly.
- JEPI's management says to expect 5% to 8% long-term yields
Second, you should know that ELN income and covered call income in general, is taxed at ordinary income rates.
- just like REIT dividends
Rather than 0%, 10%, 15%, 20%, or 23.8% tax rates, as is the case with qualified dividends, just 15% to 20% of JEPI's dividends are qualified.
This means owning it in a tax-deferred retirement account is optimal.
The effective JEPI tax rate for high-income investors is close to 50% if owned in taxable accounts.
- a post-tax yield of closer to 6% for investors in the top tax bracket
- and management guidance for post-tax 2.5% to 4% yields
If you're in the top tax bracket, a 2.5% to 4% yield would equate to much lower total returns than 6% to 8%.
That's because JEPI's annual turnover is 195%.
JEPI Prospectus
Since its inception, JPMorgan estimates the average investor, net of fees and taxes, made 18% compared to 25% pre-tax returns.
- Taxes ate 28% of gains
But in the past year, 40% of returns were reduced by taxes and high turnover-related expenses.
And remember, this is just for the average American, with a 28% tax bracket.
- the top income tax bracket saw 8% returns over the last year and 12% since inception
- up to 50% of your returns could go to taxes
What does that mean for long-term investors? If you're rich enough to be in the top tax bracket, management's guidance for 6% to 10% returns could end up being 3% to 5%. 4.2% to 7.0% for the average American investor in the 28% tax bracket
5.6% mid-range post-tax returns compared to about 8.5% for the S&P is a lot less exciting.
But there is one final important thing to know about covered call ETFs like JEPI.
You Can't Spend All The Dividends, Or You'll Lose Money Over Time
Even a 6.5% yield over time, as management is guiding for, still sounds great. But here's the catch. If you don't reinvest a significant portion of those dividends, your initial investment will lose money over time.
Historical Returns Since 2013 (No Dividend Reinvestment)
Portfolio Visualizer Premium
What if you own a covered call ETF and take all the dividends as cash instead of reinvestment them? Then you pretty much earn nothing other than income.
But don't forget about inflation.
Portfolio Visualizer Premium
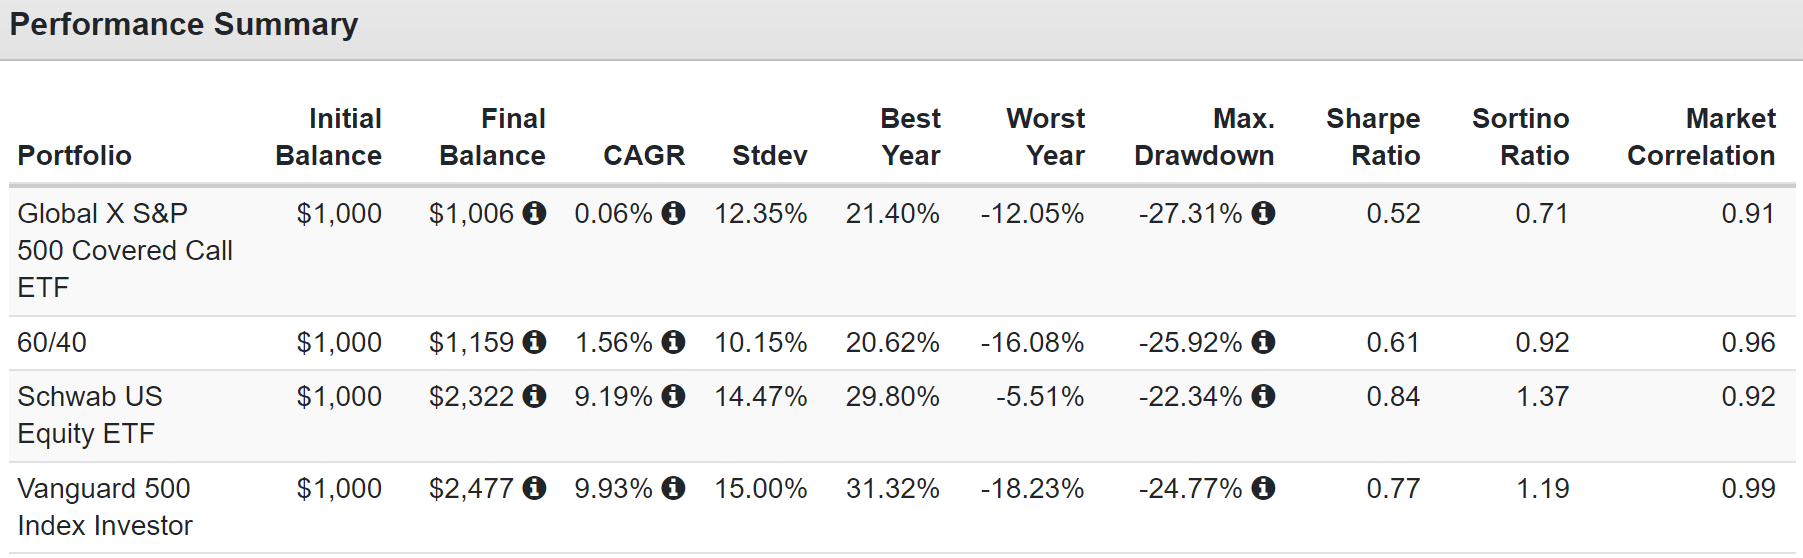
XYLD investors who took their dividends in cash have lost 21% of their original investment over the last nine years when adjusting for inflation.
- -2.6% real return on principle
To offset this and keep your principle intact, you would have had to reinvest 38% of the dividends.
OK, that's pretty bad, but JEPI is the gold standard of covered call ETFs so how did it and JEPIX do?
Historical Returns Since September 2018 (No Dividend Reinvestment)
Portfolio Visualizer Premium
If you took your JEPIX dividends in cash and not reinvested them, you've lost money over the last 2.5 years.
Portfolio Visualizer Premium
JEPIX investors have lost 23% on their original investment while taking cash. Sure they got a lot of cash, but to keep their principle flat adjusted for inflation, they would have had to reinvest basically all the dividends.
OK, but what about JEPI?
Historical Returns Since June 2020 (No Dividend Reinvestment)
Portfolio Visualizer Premium
JEPI, without dividend reinvestment, delivered around 3% annual returns.
Portfolio Visualizer Premium
Since inception, if you had invested in JEPI and taken your dividends in cash, then even ignoring high taxes, you'd be down 7% when adjusting for inflation.
- reinvesting 50% of the dividends into more JEPI shares would have kept your principal whole
- the same % as XYLD since 2013
In other words, if you want to avoid your original investment getting eaten away by inflation over time, you should plan to reinvest 50% of the dividends.
- up to 50% of dividends to taxes (for the top tax bracket)
- and reinvest the other 50% to keep your principal from eroding
In other words, if you're rich with JEPI, you might not be able to spend the dividends at all unless you don't care about preserving your principle.
Bottom Line: JEPI Is The Best Covered Call ETF But Don't Expect To Retire Rich From This ETF Alone
Simply put, JEPI is the best-covered call ETF I've ever seen, and I'm not the only one who thinks that. CFA Nathan Winkelpleck also considers JEPI the best-covered call ETF on Wall Street.
But while JEPI's returns and income since its mid-2020 inception have been stellar, anyone who thinks this 12% yielding monthly ETF is the solution to their rich retirement dreams is likely to be disappointed.
JEPI's unique combination of low volatility blue-chips, combined with out-of-the-money ELNs, and some of the best active management in the industry, has resulted in amazing returns.. . so far.
The fact that it's been able to deliver rising annual income for two consecutive years in booming, crashing, and sideways markets, is impressive.
However, management is guiding for a 5% to 8% long-term yield from JEPI, and long-term 6% to 8% annual returns are more likely than the 13.4% it's delivered so far.
More importantly, because of how JEPI makes its returns, almost entirely through income generated by ELNs, there are several important things potential investors need to know.
What All Potential JEPI Investors Need To Know
- ELNs expose JEPI to counter-party risk
- in the event of another financial crisis, JEPI's income could blow up
- if you don't reinvest most of JEPI's dividends, your principle will erode over time, adjusted for inflation
- so you can't spend all the dividends (or any of them if you're in the top tax bracket)
- 80% to 85% of JEPI's dividends are taxed as ordinary income
- so it's best owned in tax-deferred retirement accounts
Is JEPI the best-covered call ETF? I've yet to find one that delivers better volatility-adjusted returns and RELATIVELY stable income.
- JEPI is best for those who own it in a retirement account and reinvest the dividends
- 5% to 8% yield over time with 6% to 10% annual returns and 33% less volatility than the S&P 500 (in a Roth IRA)
Is it right for my family's hedge fund? No, and here's why.
What ZEUS Income Growth Looks Like With JEPI (Management Guidance) - Ignoring Taxes
| Stock |
| Yield |
| Growth |
| Total Return |
| Weighting |
| Weighted Yield |
| Weighted Growth |
| Weighted Return |
| VIG |
| 1.9% |
| 10.0% |
| 11.9% |
| 8.33% |
| 0.2% |
| 0.8% |
| 1.0% |
| SCHG |
| 0.6% |
| 12.8% |
| 13.4% |
| 8.33% |
| 0.1% |
| 1.1% |
| 1.1% |
| JEPI |
| 6.5% |
| 1.5% |
| 8.0% |
| 8.33% |
| 0.5% |
| 0.1% |
| 0.7% |
| SCHD |
| 3.4% |
| 8.6% |
| 12.0% |
| 8.33% |
| 0.3% |
| 0.7% |
| 1.0% |
| EDV |
| 4.1% |
| 0% |
| 4.1% |
| 16.67% |
| 0.7% |
| 0.0% |
| 0.7% |
| DBMF |
| 9.0% |
| 0% |
| 9.0% |
| 8.33% |
| 0.8% |
| 0.0% |
| 0.8% |
| KMLM |
| 9.4% |
| 0.0% |
| 9.4% |
| 8.33% |
| 0.8% |
| 0.0% |
| 0.8% |
| AMZN |
| 0.0% |
| 19.2% |
| 19.2% |
| 5.56% |
| 0.0% |
| 1.1% |
| 1.1% |
| LOW |
| 2.0% |
| 20.6% |
| 22.6% |
| 5.56% |
| 0.1% |
| 1.1% |
| 1.3% |
| MA |
| 0.6% |
| 23.2% |
| 23.8% |
| 5.56% |
| 0.0% |
| 1.3% |
| 1.3% |
| BTI |
| 7.4% |
| 10.4% |
| 17.8% |
| 2.78% |
| 0.2% |
| 0.3% |
| 0.5% |
| ENB |
| 6.3% |
| 4.9% |
| 11.2% |
| 2.78% |
| 0.2% |
| 0.1% |
| 0.3% |
| MO |
| 8.3% |
| 5.0% |
| 13.3% |
| 2.78% |
| 0.2% |
| 0.1% |
| 0.4% |
| HASI |
| 4.3% |
| 10.8% |
| 15.1% |
| 2.78% |
| 0.1% |
| 0.3% |
| 0.4% |
| BAM |
| 4.0% |
| 14.6% |
| 18.6% |
| 2.78% |
| 0.1% |
| 0.4% |
| 0.5% |
| NEP |
| 4.1% |
| 13.5% |
| 17.6% |
| 2.78% |
| 0.1% |
| 0.4% |
| 0.5% |
| Total |
| 4.5% |
| 9.7% |
| 14.2% |
| 100.00% |
| 4.3% |
| 7.9% |
| 12.2% |
(Source: DK Research Terminal, FactSet, Morningstar)
JEPI would still be a potentially solid addition, BUT the 0.7% yield boost falls to 0.2%, and for that, my family would have to give up 0.4% long-term return potential.
- ignoring taxes in our taxable account and at the top tax bracket
Add in the requirement for reinvestment of the dividends to preserve your principle, and my family's hedge fund is NOT adding JEPI, though it was a close call.
- we only add a stock that improves the portfolio's overall fundamentals
- including total return potential
- JEPI management guidance is for 20% lower returns than the S&P
- We'd have to own it in our hedging bucket
- but our goal is to only own hedges that go up in down markets, not just fall 35% less than the market
- right now, dividends are going to medical bills (we can't afford to reinvest them)
- so an investment in JEPI (coming out of SCHD allocation) right now would guarantee a decline in principle
Does that mean that JEPI is a bad high-yield ETF? No.
Does it mean you shouldn't buy it as part of a diversified retirement portfolio? Absolutely not.
It just means that JEPI's magical 12% yield and 13.4% historical return are likely a fluke (94% probability, according to JPMorgan) created by the perfect storm of conditions in recent years.
If you understand JEPI's pros and cons, potential, and risks, it can be a great addition to a conservative high-yield income portfolio.
Just remember that there are very few magic bullets on Wall Street.
I've heard of investors going "all into JEPI" as a one-stock retirement plan.
That's likely a mistake, given its limitations and inherent risks.
If you understand what JEPI is and, more importantly, what it is not, then you can make an informed decision about this currently 12% yielding monthly ETF.
Is it great? As far as covered call ETFs go, yes. Is it the magic formula for an instant retirement? Almost certainly not.
Is it worth considering for your portfolio? Possibly.
Is it right for every portfolio, including my family's hedge fund? No, it's not.
Could JEPI continue to outperform its peers and management expectations in the future? Sure, though that's a bit speculative.
Should investors in the top tax bracket who want to spend the dividends rather than reinvesting them own it in a taxable account? Probably not.
For further details see:
JEPI: A 12% Yielding 'Retirement Dream ETF' With A Catch