JEPQ - JEPI Vs. JEPQ: Which Is Best For Income Investors And Retirees?
2023-11-13 08:00:00 ET
Summary
- JEPI and JEPQ are two of the most popular income ETFs in the market today and with good reason.
- Both have high yields, with JEPI yielding 9.3% and JEPQ 11.1%.
- JEPQ has outperformed the S&P 500 since inception, a rare feat for an income fund. JEPI has not, but returns have been much more stable, and consistent.
- An in-depth comparison of these two funds follows.
The JPMorgan Equity Premium Income ETF (JEPI) and the JPMorgan Nasdaq Equity Premium Income ETF (JEPQ) are two of the most popular income ETFs in the market today and with good reason. Owing to their popularity and reader interest, thought to do an in-depth comparison of these funds.
Both are large-cap U.S. equity funds, with JEPI focusing on lower-volatility stocks, and JEPQ focusing on mega-cap tech stocks. Both are actively managed.
Both funds indirectly write covered calls on their holdings, boosting their dividends, but decreasing potential capital gains. JEPI yields 9.3%, while JEPQ yields 11.1%.
Both funds tend to outperform their benchmark when markets move down or sideways, as was the case last year. Both funds tend to underperform during bull markets, as has been the case YTD. In my opinion, both funds are likely to slightly underperform long-term, as has been the case since inception.
JEPQ has outperformed JEPI since inception, due to being overweight the best-performing tech. JEPQ's performance track record is quite short, however. JEPI's returns have been lower, but more stable, and the fund's track record is much longer too.
In my opinion, both JEPI and JEPQ are strong investment opportunities and buys. I prefer JEPI, due to the fund's comparatively safe, low-risk holdings and more stable performance track record.
Equity Holdings Comparison
JEPI - Large-Cap U.S. Equities / Low Volatility Focus
JEPI invests around 80% - 90% of its portfolio in large-cap U.S. equities, focusing on those with lower volatility. JEPI's portfolio are almost all blue-chip stocks, including Microsoft (MSFT), Visa (V), AbbVie (ABBV), and Pepsico (PEP). These are comparatively safe, resilient companies, with all the benefits that entail. It currently holds 115 stocks, about average for an actively managed equity fund, lower than most broad-based equity index funds.
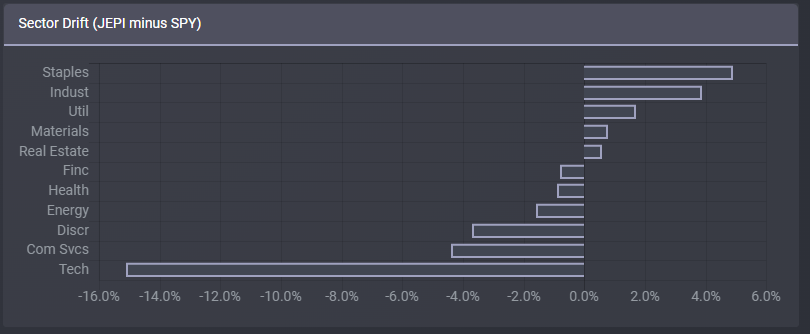
JEPI provides investors with diversified industry exposure, but is overweight comparatively safe, stable industries, including consumer staples and industrials. On the flipside, the fund is underweight tech and consumer services. Although I would not characterize the latter industries as risky , these industry tilts are quite common in many dividend and value funds, and are in-line with fund objectives.
Compare JEPI's industry exposures to those of the S&P 500.
JEPI invests the other 10% - 20% of its portfolio in equity-linked notes, or ELNs. These are effectively equivalent to writing one-month, out-of-the-money call options on the S&P 500 index. Said options have a significant impact on the fund and its performance, but more on that later.
JEPQ - Large-Cap U.S. Equities / Tech Focus
JEPQ invests around 80% - 90% of its portfolio in large-cap U.S. equities, focusing on those in the Nasdaq-100. In practice, this means focusing on tech and communication services. Portfolio holdings include most of the well-known names in said space, including Microsoft, Apple (AAPL), Google (GOOG)(GOOGL), and Amazon (AMZN). These companies tend to exhibit strong growth, but frothy valuations. It currently holds 81 stocks, about average for an actively managed equity fund, lower than most broad-based equity index funds.
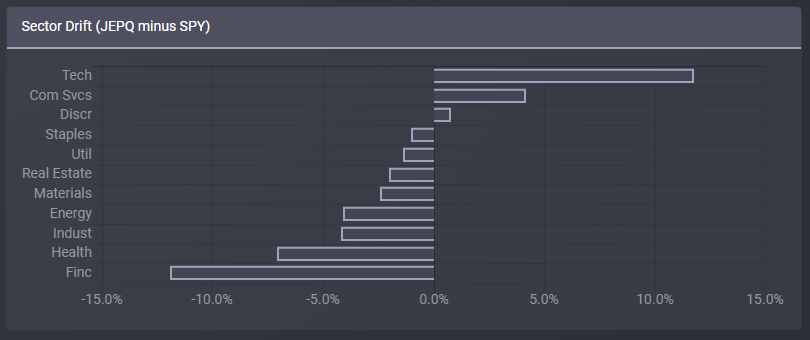
JEPQ provides investors with some industry exposure, but is significantly overweight tech, and is significantly underweight several industries, including financials and energy.
Compare JEPQ's industry exposures versus those of the S&P 500.
JEPQ invests the other 10% - 20% of its portfolio in equity-linked notes, or ELNs. These are effectively equivalent to writing one-month, out-of-the-money call options on the Nasdaq-100 index. Bear in mind, that JEPI's ELNs are for the S&P 500 index. Both invest in ELNs, but the index is different.
Equity Holdings Comparison
Both funds invest most of their assets in large-cap U.S. equities, with JEPI focusing on lower-volatility stocks, and JEPQ on growth and tech. JEPI is much more diversified than JEPQ, with more holdings and more balanced industry weights.
Due to the above, JEPI tends to experience lower volatility than JEPQ.
Data by YCharts
At the same time, JEPQ tends to outperform when tech outperforms, as has been the case YTD.
Data by YCharts
On the flip side, JEPQ tends to underperform when tech underperforms, as was the case in 2022.
Data by YCharts
JEPI's low-volatility stocks should see lower losses during bear markets too. Although this was the case during the latest bear market, see above, that was mostly due to tech underperforming. Ideally, I would compare the performance of JEPI and JEPQ during early 2020, the onset of the coronavirus pandemic, but JEPQ did not exist at the time.
JEPI's lower volatility is an important benefit for shareholders and an important advantage relative to JEPQ. For retirees, lower volatility is of particular importance, in my opinion at least.
Dividends Comparison - JEPQ Clear Winner
Dividend Yield
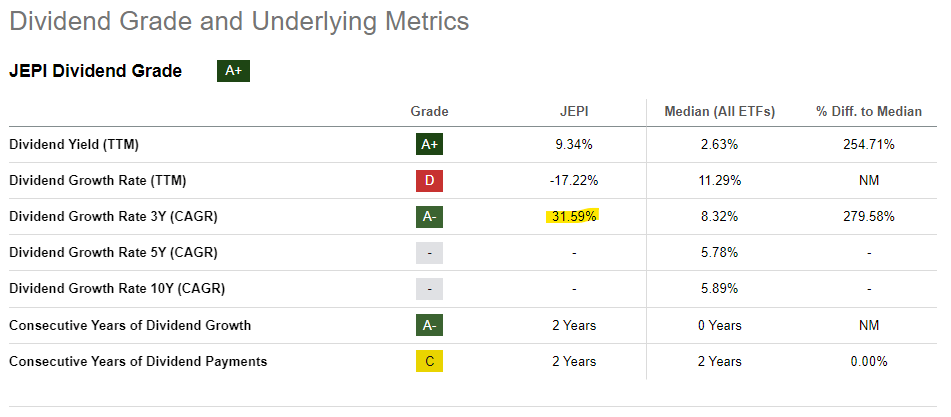
Both funds invest in covered call ELNs, which generate significant income for shareholders. Said income is distributed to shareholders as dividends, resulting in a 9.3% dividend yield for JEPI, and 11.1% for JEPQ. Both are strong yields on an absolute basis, and much higher than those of most asset classes, including equities, bonds, and high-yield bonds.
Data by YCharts
Both yields are comparable to those of several niche income-producing asset classes, including mREITs, MLPs, and BDCs.
Data by YCharts
Both yields are higher than those of the average covered call ETF, but are in-line with several of the larger, higher-yielding ones by Global X.
Data by YCharts
JEPI and JEPQ both sport strong dividend yields, a significant benefit for investors, and their core investment thesis. Both are ultimately income vehicles, which investors buy (or not) for their dividends. JEPQ's yield is quite a bit higher, at 11.1% versus 9.3%, an important advantage of the fund compared to JEPI.
Dividend Growth
For both funds, dividends mostly come from their ELNs / covered call strategy. The income generated from said strategy is dependent on many factors, but assets (per share) and (implied) equity volatility are key.
As fund assets (per share) grow, the funds can sell more / more expensive options, which means more premiums. These are ultimately returned to shareholders in the form of higher dividends. Insofar as equity prices go up both funds should see higher share prices, leading to positive dividend growth.
JEPQ is too young a fund to meaningfully analyze its dividend growth.
JEPI has seen positive dividend growth since inception in mid-2020 and could see positive growth moving forward as well. Dividend growth has been spotty, and dividends are down YTD, however.
For both funds, dividends are also dependent on option prices. These are dependent on many factors, including (implied) equity volatility. As (implied) equity volatility increases, so does the probability that risky options will be profitable, increasing their price. Both JEPI and JEPQ sell options, so higher option prices mean higher premiums, income, and dividends. Comparing JEPI's volatility with its dividends clearly shows their relationship.
Data by YCharts
Both funds are somewhat dependent on (implied) equity volatility for their dividends, which increases dividend volatility, and puts investors at some risk of dividend cuts. As an example, JEPI's dividends are down YTD because equity volatility declined. This is an important negative for both funds and one which is difficult to forecast, and sometimes under-discussed.
For retirees, focusing too strongly on JEPI, JEPQ, and other covered call funds means that their retirement is dependent on equity volatility. This seems a bit odd and, in my opinion, unwise. Diversification is important, not only across funds but across strategies.
As a final point, JEPQ yields more than JEPI because the Nasdaq-100 index is more volatile than the S&P 500. This is generally the case, so JEPQ should yield more than JEPI long term.
Data by YCharts
Capital Gains and Losses Comparison - JEPQ Technical Winner
Covered Call ELNs and Capital Gains / Losses
Both funds invest in covered call ELNs, which reduce potential and realized capital gains relative to their respective benchmarks. As a reminder, that means the S&P 500 for JEPI, and the Nasdaq-100 for JEPQ.
As an example, JEPI saw capital gains of 13.4% during 2021, while the S&P 500 soared 27.0%. Gains were roughly half those of its index.
Data by YCharts
JEPQ has seen capital gains of 18.9% YTD, while the Nasdaq is up a whopping 42.1%. Gains were less than half those of its index.
Data by YCharts
In both cases above, the equity holdings and industry tilts of each fund also impacted their performance, complicating the analysis. Specifically, JEPI saw lower gains than expected, due to being underweight tech.
In my opinion, I think it is fair to say that both funds have moderate potential capital gains, but that these are significantly reduced compared to their respective benchmarks.
Importantly, the covered call ELNs do not impact potential capital losses. As an example, JEPQ saw capital losses of 20.2% from inception to early 2023, compared to 19.2% for the Nasdaq-100 index. Losses were effectively identical, with a small difference due to volatility.
Data by YCharts
Both funds have reduced potential capital gains, a significant negative for shareholders. Their dividends might make up the difference, however.
Equity Holdings and Capital Gains / Losses
JEPI focuses on lower-volatility stocks, which should reduce capital losses during downturns and recessions. As an example, JEPI's share price was down 13.8% during 2022, compared to 19.5% for the S&P 500.
Data by YCharts
In my opinion, JEPI's lower-volatility stocks should see lower capital losses during future downturns and recessions too, an important benefit for the fund and its shareholders.
Historical Capital Gains / Losses
Notwithstanding the above, in practice, JEPI has seen higher capital losses than JEPQ since inception.
Data by YCharts
JEPI's higher losses were almost entirely due to being underweight tech during a period of significant tech outperformance, and owing to JEPQ's short performance track record. JEPQ had good timing, and that impacts these comparisons.
Data by YCharts
Capital Gains and Losses - Tying It All Together
Both funds have reduced potential and realized capital gains, due to their covered call strategies.
JEPI's lower volatility stocks should see lower capital losses in most downturns and recessions, as has been the case since its inception.
In practice, JEPQ's overweight tech position has led to lower capital losses since its inception.
In my opinion, JEPQ is the technical winner in this section, but I think JEPI's lower-volatility stocks will prove the long-term winner. The data does say otherwise, but we simply don't have that much data for JEPQ.
Total Returns Comparison - JEPQ Technical Winner
Bull Market Returns
Both funds invest in covered call ELNs. These generate significant income for shareholders, but reduce potential capital gains. The net effect tends to be negative during bull markets, as capital gains are particularly high during these. As such, both funds tend to underperform during bull markets, relative to their respective benchmarks.
As an example, JEPI underperformed during 2021, during which the S&P 500 soared almost 30%. JEPI did see double-digit capital gains and dividends during the said year, but these were not a match for the S&P 500.
Data by YCharts
Looking at JEPQ, the fund has underperformed YTD, during which the Nasdaq-100 has risen by more than 40%. JEPQ has seen double-digit capital gains and dividends YTD, but these were not a match for tech gains.
Data by YCharts
JEPI and JEPQ both tend to underperform during bull markets relative to their respective benchmarks . This might not necessarily be true for different benchmarks. As an example, JEPQ has outperformed the S&P 500 YTD, owing to the fund's significant overweight tech position. The covered calls did reduce the gains from these, but not by enough.
Data by YCharts
The fact that both funds tend to underperform during bull markets is an important negative for shareholders. Nevertheless, in my opinion, gains have proven to be reasonable enough during bull markets, especially for retirees more focused on income.
Bear Markets and Sideways Movements
Both funds invest in covered call ELNs. These generate significant income for shareholders but reduce potential capital gains. The net effect tends to be positive during bear markets, or when markets move sideways, as capital gains tend to be low to non-existent during these. As such, both funds tend to outperform during bear markets and when markets move sideways, relative to their respective benchmarks.
As an example, JEPI outperformed during 2022, during which the S&P 500 was down almost 20%. Outperformance was partly due to higher dividends, from the covered call ELNs, and partly due to lower capital losses, from focusing on lower-volatility stocks.
Data by YCharts
Looking at JEPQ, the fund outperformed from inception to early 2023, during which the Nasdaq-100 was down almost 20%. Outperformance was entirely due to higher dividends (JEPQ did not see lower reductions in share prices, unlike JEPI).
Data by YCharts
Both funds tend to outperform during bear markets relative to their respective benchmarks. This is an important benefit for both funds, and one which might be of particular importance to income investors and retirees.
Total Returns Track-Record
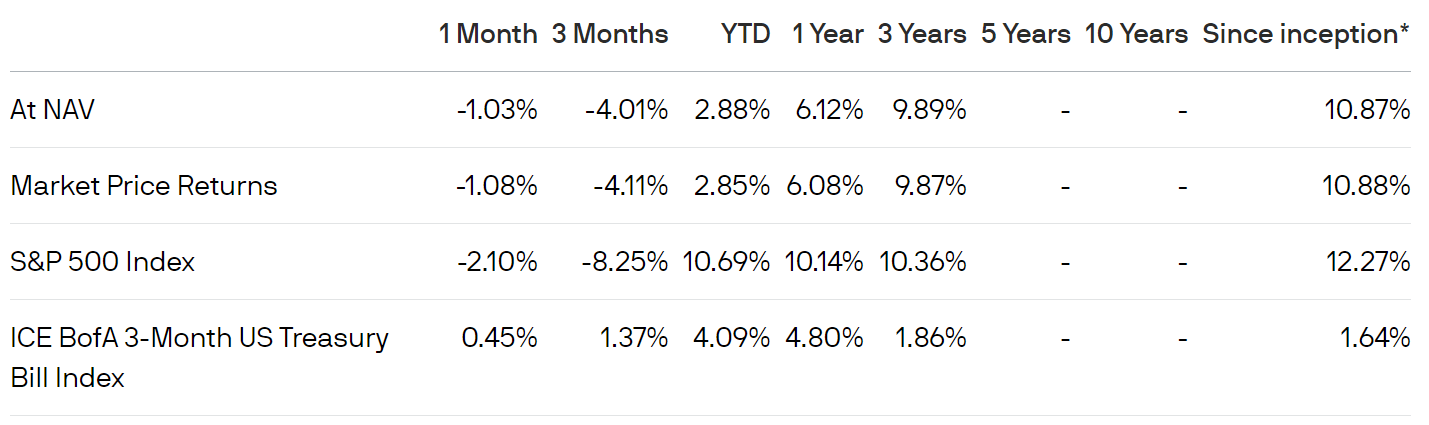
Both funds have somewhat underperformed relative to their respective benchmarks since inception.
JEPI has returned 10.9% to shareholders per year since inception, compared to 12.3% for the S&P 500. JEPI has underperformed by 1.3%, a small, but impactful difference.
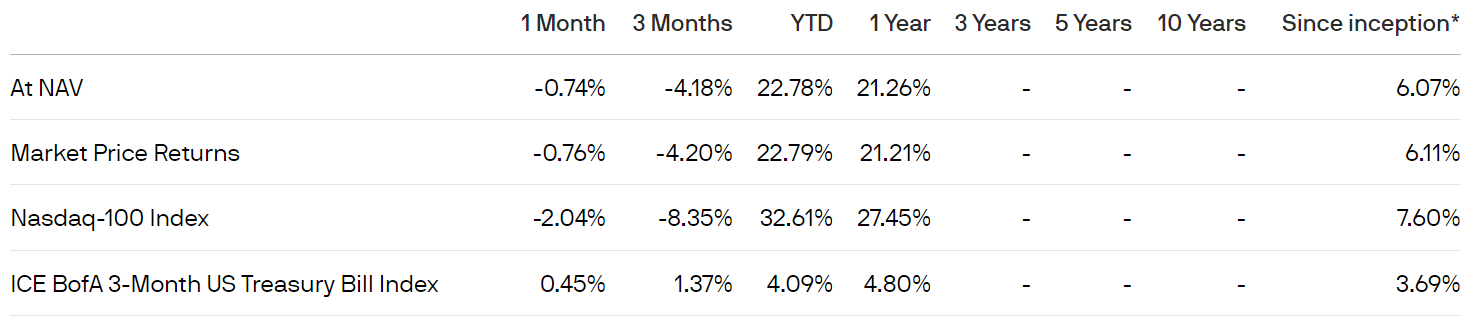
JEPQ has returned 6.1% to shareholders per year since inception, compared to 7.6% for the Nasdaq-100 index. The fund has underperformed by 1.5%, also a small but impactful difference.
As the funds were created several years apart, the figures above are not directly comparable (inception dates are too far apart).
In practice, JEPQ has moderately outperformed relative to JEPI since the former's inception. Outperformance was almost entirely due to being overweight best-performing tech stocks, and good timing on JEPQ's part.
Data by YCharts
In my opinion, the fact that JEPQ has outperformed JEPI since inception is not all that important. JEPQ's performance track record is simply too short, and the fund was created at a very opportune time. Other investors might disagree.
In my opinion, as both funds tend to underperform during bull markets, and as these are the most common market scenarios, both funds will likely underperform their respective benchmarks long-term. Their outperformance during bear markets also matters, insofar as markets are (mostly) rational, and less risky investments have lower returns. Much will depend on future market conditions and movements, however.
Overall Investment Thesis
This was a lengthy article, so thought a quick summary looking at the funds as a whole and their investment thesis was warranted.
Both funds invest in U.S. large-cap equities and indirectly sell covered calls on their holdings.
Both funds sport strong dividend yields but have lower potential capital gains.
Total returns tend to be higher during bear markets, and when markets move sideways, lower during bull markets.
Overall, I think the funds are strong investment opportunities and seem particularly well-suited for income investors and retirees. These might find their strong dividends and outperformance during bear markets particularly enticing, and be willing to forego some capital gains and total returns for these benefits. Other investors, especially more aggressive, long-term buy-and-hold investors, might disagree.
In general terms, both funds have broadly similar investment thesis, but I do find JEPI to be the slightly stronger choice.
The fund's lower-volatility holdings and strong dividends are a perfect match for many retirees. I've been told by several subscribers that it was easier to hold JEPI than other equity funds during 2022, as the fund suffered lower losses (less scary), and they could focus on the dividends (and ignore the losses). Sure, holding an S&P 500 index fund would have led to a strong recovery this year, but not many investors have the stomach to hold such a fund when markets are plummeting double-digits, and retirees can't fund their 2022 spending with 2023 capital gains.
The fund's lower-volatility holdings also help support the fund's share price, of particular importance for covered call funds. As these funds have reduced potential capital gains but experience full capital losses, their share prices have difficulties recovering from any losses and sometimes decline long-term. JEPI's lower-volatility holdings suffer relatively low losses, so share prices should remain stable, and perhaps grow, long-term. In theory, and in practice.
Data by YCharts
JEPQ's much stronger performance track record is definitely an important advantage, but I find the issues above more important and compelling.
Conclusion
JEPI and JEPQ both offer investors strong dividend yields, and potential outperformance during bear markets, but lower potential capital gains and long-term total returns.
In my opinion, JEPI is the slightly superior investment opportunity, due to the fund's comparatively safe, low-risk holdings and more stable performance track record. Still, both funds are solid investment opportunities, and quite similar to each other.
For further details see:
JEPI Vs. JEPQ: Which Is Best For Income Investors And Retirees?