JEPI - JEPI Vs. SCHD: One Is Good But The Other Is Better
2024-01-05 12:27:05 ET
Summary
- Dividend investing combines steady income with long-term growth, making it a resilient strategy.
- The JPMorgan Equity Premium Income ETF (JEPI) and Schwab U.S. Dividend Equity ETF (SCHD) are popular options for dividend investors.
- JEPI offers lower volatility, higher dividend yield, and better risk-adjusted returns compared to SCHD.
Introduction To Dividend Investing
In the vast landscape of investment strategies, dividend investing stands out as a resilient and time-tested approach that combines a steady stream of income from dividends with the potential for long-term growth on the underlying holdings.
As investors, we seek reliable securities to enhance our portfolios, and dividends offer a compelling addition to holding onto stocks. In addition, dividend investing has proven to be a low-volatility investment strategy and can be a solid way to secure a stable income for many years.
In this article, we will discuss two of the most popular Exchange Traded Funds (ETFs) for dividend and income investors: the JPMorgan Equity Premium Income ETF (JEPI) and the Schwab U.S. Dividend Equity ETF (SCHD). Each of the two ETFs is constructed differently but essentially tries to achieve the same goal - deliver frequent distributable income with less volatility than the broader equity market.
Many may argue that SCHD and JEPI are not directly comparable ETFs, and while that may be true, they are still two of the most popular instruments for investors to generate period income.
Although the two ETFs aim to provide stable period returns with low volatility, they are not providing a better return than (SPY) over a three-year period. There are times when the ETFs outperformed SPY, such as October 2022 - but they were quickly reined in and overtaken over the following 12 months.
However, as we will see, many other reasons exist for including an ETF in your portfolio.
Ycharts
Furthermore, we will explore how each of the two ETFs are constructed. This will inevitably lead us to a discussion about the strategy that JPMorgan (JPM) and Schwab (SCHW) have built around each of their ETFs, as well as an analysis of the performance of the two ETFs.
Why ETF's?
The Magnificent 7 had an incredible year, with Nvidia (NVDA) gaining close to 250%. As you can see in the chart below from our X post , where we discussed the top gainers of 2023, the worst-performing Magnificent 7 stock was Apple (AAPL), which had a return of over 54.05%!
You might ask yourself, shouldn't I just buy Microsoft (MSFT), Tesla (TSLA), Alphabet (GOOGL)(GOOG), Amazon (AMZN), Meta (META),… and there are definitely arguments to be made for that. In this article we will discuss the benefits of investing in a dividend ETF and between SCHD and JEPI, there is a clear winner!
You may ask yourself, why would I invest in an ETF? If you are looking for a low-risk investment with a basket of stocks or other securities, increasing diversification, then ETFs could be a good option. ETFs are generally considered low-cost and tend to have much lower expense ratios than actively managed funds you would get from a hedge fund or a mutual fund. In addition, ETFs can be more tax-efficient and offer the option to reinvest dividends immediately. Seems appealing, doesn't it?
ETFs can expose you to many stocks from a particular industry, security, country, or broad market index. Essentially, they can pack a big basket of securities into one product that lets you quickly diversify your portfolio. ETFs can also expose asset classes other than equities, including bonds, currencies, and commodities.
The ease of diversification comes with a small yearly fee, and the expense ratio, that can range from reasonably high to almost negligible. For JEPI and SCHD, the expense ratio is 0.35% and 0.06%, respectively.
For reference, popular ETFs like ARK Innovation ETF (ARKK) or the YieldMax TSLA Option Income ETF (TSLY) have expense ratios of 0.75% and 0.99%, respectively. Thus, the expense ratio for SCHD and JEPI would fall under the negligible range.
You could construct your portfolio to replicate JEPI or SCHD; however, the time to research and manage may not be worth it to everyone.
Besides that ETFs can benefit you from diversification, how they are managed can significantly differentiate between ETFs. For instance, JEPI aims to generate income by selling covered calls on its stock holdings. Covered calls are a widely used options strategy that lets the seller (in this case, JP-Morgan) collect a premium on the options they sell. On the other hand, SCHD focuses on higher-yielding companies and takes a much more passive dividend-collecting approach. In addition, SCHD aims to replicate the Dow Jones US Dividend 100 Index (DJUSDIV).
As we will see, although we prefer one ETF over the other, both JEPI and SCHD can provide you with exposure to many different sectors.
A Decomposition
It is essential to understand what you buy when you pick between JEPI and SCHD (or maybe you buy both). JEPI manages around $30.6B in assets, while SCHD manages $51.7B at the time of writing, and their holdings differ significantly.
Ycharts
Below, you can find a table that shows the top 10 holdings of JEPI and SCHD and how significant of a percentage each takes up the total portfolio.
Stock info and portfolioslab.com
SCHD has a more concentrated approach, resulting in its top 10 holdings accounting for over 40% of the total ETF. On the other hand, JEPI is less concentrated, with the top 10 accounting for just over 16% of its assets under management.
In addition, the types of stocks the two ETFs hold are noticeably different. Seasoned investors might notice that SCHD holds well-known dividend-paying stocks such as Verizon ( VZ ), AbbVie ( ABBV ), and Texas Instruments ( TXN ).
On the other hand, JEPI holds some of the biggest companies on the market that have sustained solid and stable growth for an extended period - for instance, Microsoft, Amazon, and Visa ( V ).
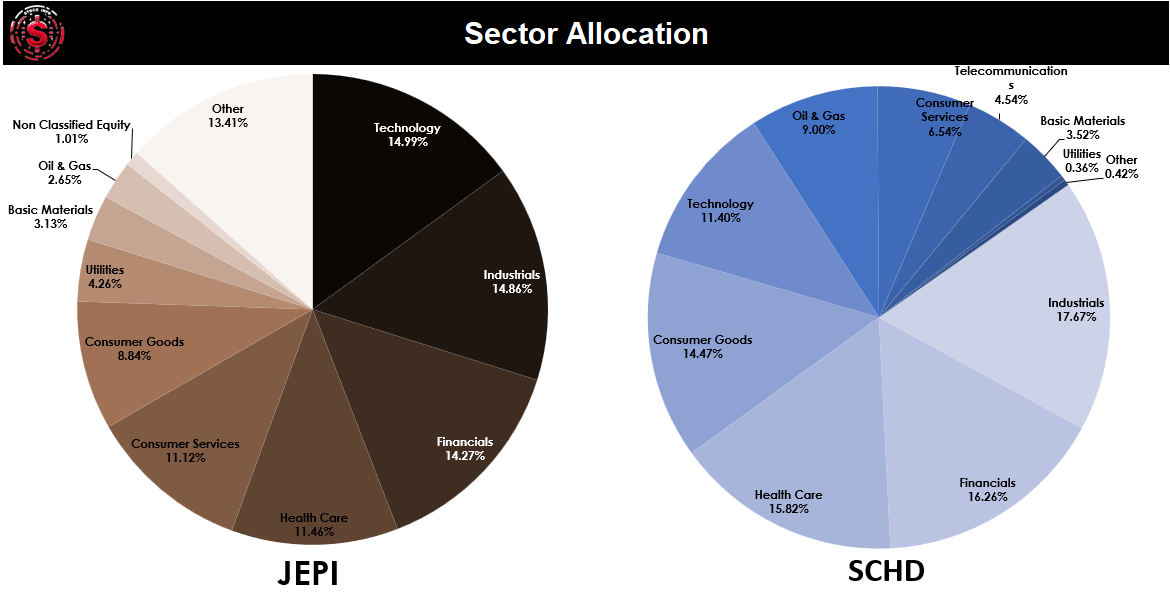
Regarding sector allocation, we also see a pretty significant difference between the two. JEPI has many more tech stocks under its management, whereas SCHD focuses more on industrials. In addition, the oil and gas sector only constitutes 2.65% of JEPI, while it accounts for 9.00% of SCHD.
Stock info and portfolioslab.com
When you decide whether to invest in JEPI or SCHD, ask yourself what you think you'd rather have exposure to.
JEPI's tech-heavy allocation makes it somewhat susceptible to interest rate hikes, whereas, on the other hand, SCHD's heavy allocation into industrials makes it slightly less affected by that. On the other hand, industrials can be victims of market cyclicality and the change in oil prices, which are highly relevant in today's geopolitical landscape.
This is all up to you as an investor and what you believe the best cause of action is. It is essential to consider your risk tolerance, investment horizon, and income goals before choosing the ETF that best aligns with your financial objectives.
Regarding risk tolerance, it should also be noted that the risk associated with these two ETFs is highly exposed to the S&P 500. Investors should consider the overall market sentiment and direction before buying these two ETFs.
Strategic differences
In this section, we will discuss the strategic and methodological differences between SCHD and JEPI. The two ETFs have wildly different philosophies behind their construction, and although their goal is the same, the way they generate returns is wildly different.
The JEPI strategy
From our perspective as investors, the most compelling aspect of JEPI has undoubtedly been its impressive yield, with the low volatility of the portfolio trailing behind as a secondary factor. This appeal was particularly evident in 2022 when Treasuries were experiencing double-digit losses, JEPI served as a valuable alternative income source for investors during a period marked by a scarcity of both yields and positive total returns on the fixed-income side. We can also see this from the graph in the introduction, where JEPI maintains a relatively stable level compared to SPY and SCHD.
Furthermore, the fact that JEPI is actively managed also works heavily in its favor. Many other covered call funds, such as QYLD, use an index as their underlying and employ a static option writing strategy. JEPI, on the other hand, adopts a more dynamic approach to security selection. Active management allows the fund managers to maintain the overall low volatility style of the portfolio while adjusting it to align with the current market environment.
With an annual turnover rate of around 190% , JEPI engages in a fair amount of trading. Some may think there is no long-run advantage in an actively managed fund versus a passive fund, which is a fair point.
However, the implementation of covered calls deviates from your traditional, actively managed funds - and this is where the advantage lies.
JEPI's strategy involves significant investment in companies listed in the S&P 500 Index, supplemented by equity-linked notes (ELNs). J. P. Morgan invests in ELNs, specifically constructed to replicate the economic traits of the S&P 500 Index, and covered call options in a singular note format. These ELNs are not traded on an exchange. The options within the ELNs are tied to the benchmark or ETFs mimicking the S&P 500 Index.
The written call option strategy may limit potential gains, but it contributes significantly to the fund's overall performance and return. As these covered call options get closer to expiration or overall market conditions change, J. P. Morgan will reset the ELNs and take potential losses or gains that come with it.
To achieve its objectives, JEPI seeks to offer investors performance closely aligned with the S&P 500 while mitigating volatility and providing additional income through the option strategy. A key aspect is maintaining stable monthly distributions, with a minimum of 80% of assets allocated to equities, including common stocks and ELNs. The rest of the 20% will, for the most part, be in either bonds or cash.
In terms of stock selection, the fund emphasizes attractive valuations. It considers various criteria, such as catalysts for potential stock price increases, impact on overall portfolio risk, and perceived reward-to-risk ratios. They also actively buy and sell securities based on these criteria, aiming to optimize the portfolio's attractiveness over time. Environmental, social, and governance ((ESG)) factors are considered in the analysis to identify material risks and opportunities.
In our opinion, getting all these benefits for an expense ratio of 0.35% is favorable for investors. While it may not be as low as the expense ratios of major S&P 500 ETFs, the 0.35% figure remains quite reasonable, particularly for an actively managed equity portfolio with a built-in covered call strategy.
J. P. Morgan also offers a similar ETF with exposure to a broader world market called JEPG. The strategy is similar to JEPI but offers a more comprehensive array of geographical exposure.
The SCHD Strategy
SCHD lets you invest in dividend-paying U.S. stocks, making it an excellent product to boost returns from your stock investments or dial down risk in your portfolio. As mentioned earlier, this ETF is based on DJUSDIV, which consists of some of the best dividend-paying and fundamentally strong companies.
DJUSDIV assesses the performance of high dividend-yielding U.S. stocks from companies with a consistent dividend payment history. What makes SCHD a little different from DJUSDIV is that SCHD excludes specific stocks and uses a different weighting than the underlying index.
To be eligible in SCHD, stocks must have ten consecutive years of dividends, a minimum $500 million float-adjusted market cap, and meet specific liquidity criteria. Then, stocks are selected based on cash flow, return on equity, dividend yield, and 5-year dividend growth rate. SCHD caps single-stock representation at around 4% and sector representation at 25%.
Under normal circumstances, the fund invests at least 90% in these stocks to replicate the index's performance. However, the asset managers may adjust weightings for tax considerations for their clients. The fund can invest up to 10% in non-index securities, anticipating future index changes or managing cash through derivatives. This may sound a lot like the active management approach that JEPI has, but the turnover rate is only 28% - not particularly active.
SCHD's goal is a 95% or better correlation with DJUSDIV, but factors like transaction costs and legal restrictions may impact the correlation slightly.
As you can see, the strategy and methodology behind the two ETFs differ significantly. While JEPI does not mirror an index and instead relies on the firm's ability to pick the correct stocks, SCHD aims for a correlation to the underlying index. Both methods have pros and cons, but we believe JEPI's strategy is a preferred choice, which we will see in the next section.
A Comparison of Performance
Let us compare the performance of the two ETFs. First of all, you might be most interested in the return of the funds - after all, that is what we investors are looking for and what the goal of the funds is: better-than-average returns while maintaining low volatility.
In the introduction, the absolute return on a three-year basis was 32.26% for SCHD and 29.79% for JEPI. On the surface, it seems like there is a clear winner here. However, JEPI has given a better return over the past year between the two ETFs. The graph below shows that JEPI gave quite a significantly larger return than SCHD in 2023.
Ycharts
JEPI outperformed SCHD by almost five percentage points in 2023, which is impressive.
Now, let us look under the hood and compare the two funds based on metrics other than total return. You may see the additional advantages of owning JEPI.
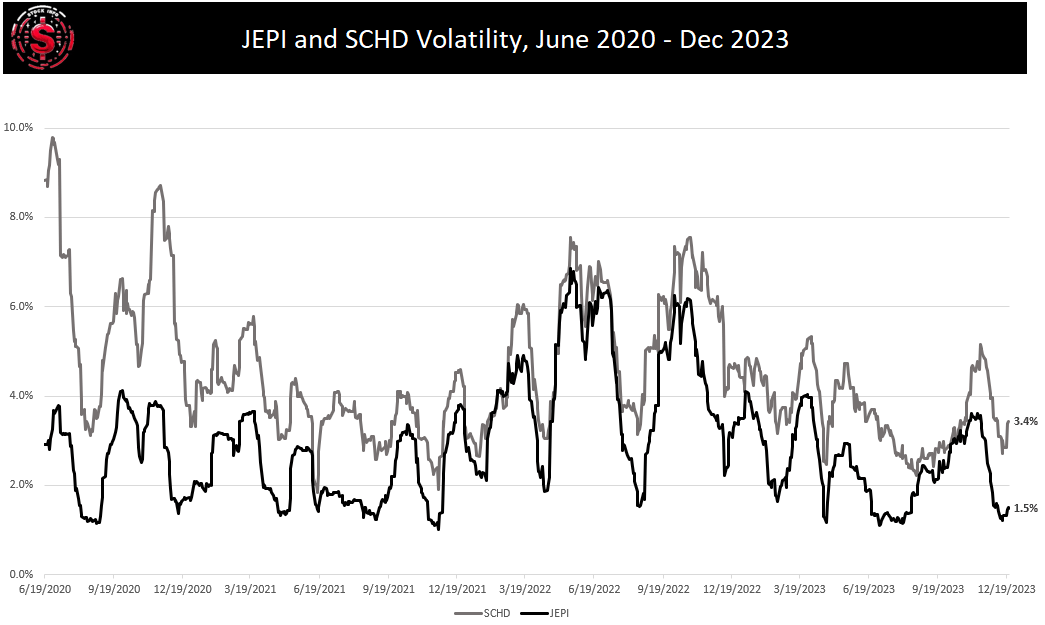
If we compare volatility between JEPI and SCHD, it is pretty clear which one has been the most volatile historically. It is important to remember that with volatility comes potentially significant returns on your investments, but it can also be a risk of having significant losses. Therefore, prudent and risk-averse investors may appreciate that JEPI offers lower volatility than SCHD.
Stock info and portfolioslab.com
Although JEPI generally experiences less volatility, there are periods where the volatility between the two ETFs is almost the same, and JEPI still fluctuates less overall.
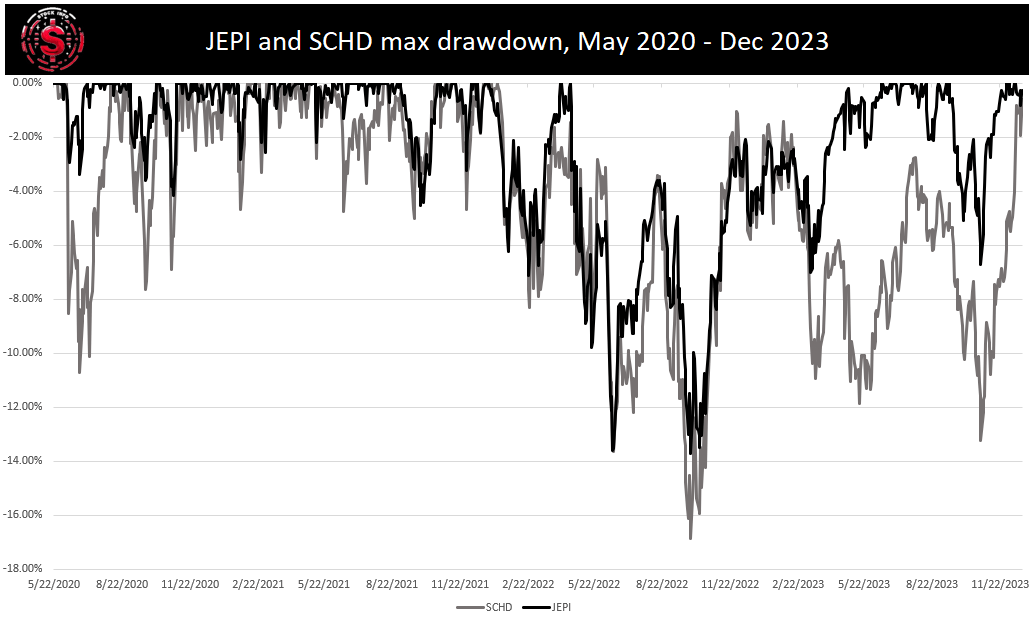
Naturally, with volatility comes risk, and to quantify risk, we can look at the drawdown for each of the two ETFs. In case you are unfamiliar with drawdown and what it represents, it refers to the "peak-to-trough" decline in the value of a portfolio or investment. It measures the percentage decline from the highest point (peak) to the lowest point (trough) before a new peak.
A larger drawdown indicates a more significant decline in value and suggests a higher level of risk compared to a security with a lower drawdown. When you compare two securities against each other using drawdown, you would usually prefer the one with the lowest.
It is a decent measure of the risk associated with security, and the graph below shows the drawdown for JEPI and SCHD, respectively. We want to emphasize that from 3/22/2023 to today - SCHD has a much larger drawdown than JEPI. While the holdings of the two ETFs certainly affect the drawdown, the stock selection and covered calls in JEPI cause it to have lower drawdowns than SCHD.
Stock info and portfolioslab.com
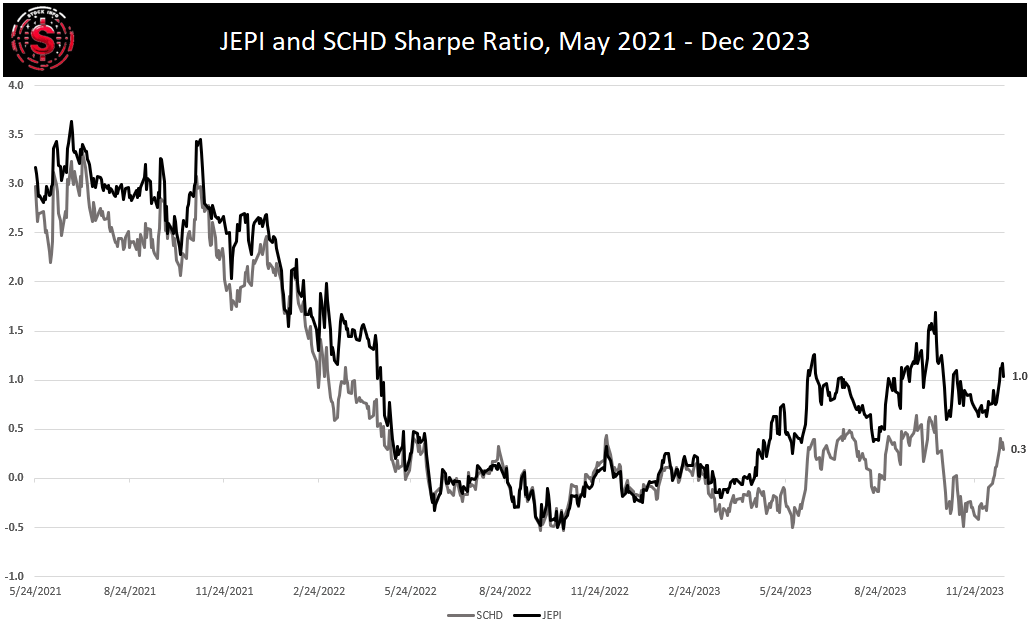
Furthermore, we can use the Sharpe ratio to evaluate the return while accounting for the risk you take as an investor. The Sharpe ratio is a metric that determines the risk-adjusted return of a security and is a vital metric when evaluating funds, portfolios, and other investments against each other.
Sharpe Ratio is a way to measure how well an investment or portfolio has performed when you consider both the return it gave and the risk it carried. Given the volatility, the ratio incorporates the risk-free rate to evaluate how much "alpha" you generate from your investment.
When comparing JEPI and SCHD, you would pick the ETF with the higher Sharpe ratio since that means you are getting better risk-adjusted returns on your investment. It is pretty clear from the graph below that JEPI has the more attractive Sharpe ratio.
Stock info and portfolioslab.com
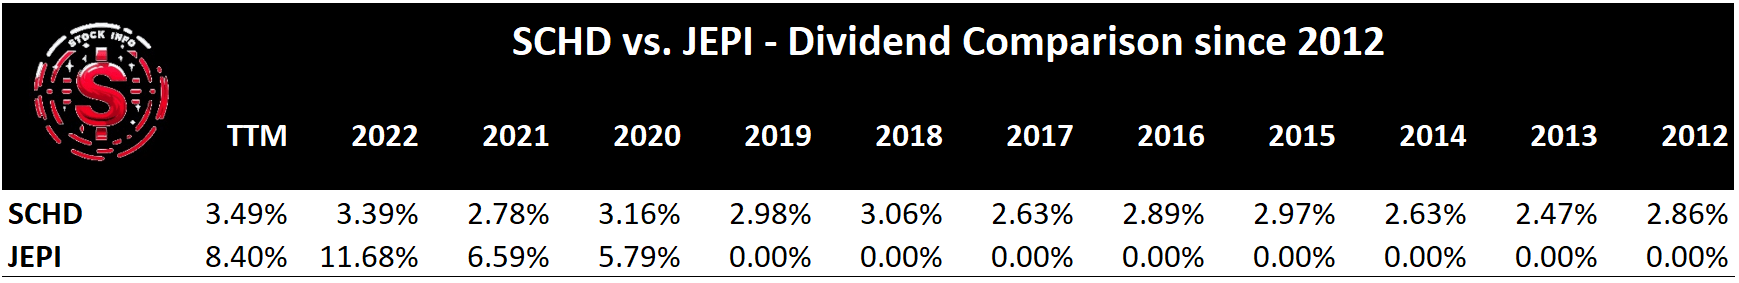
Lastly - we know many dividend investors like the dividend yield measure when making investment decisions, and below, you can see the historical dividend yield for the two ETFs.
SCHD has never had an exceptionally high dividend yield and hovers around 2.5% to 3.5%. JEPI, on the other hand, has a significantly higher dividend yield than SCHD, with a very impressive 11.7% yield in 2022.
Stock info and portfolioslab.com
Risks
Besides being exposed to overall systemic risk, given that both ETFs give you a lot of exposure to many sectors, there are some key differences. For one, JEPI's methodology of writing covered calls to generate income is a trade-off they make by capping potential upside gains in favor of income during bear markets. For example, during the recent bull run from late October to the end of 2023, JEPI likely capped much of the potential gain from this run with the covered calls. They will still have cashed in on the gains from the run and collected the premium. However, if the strike price was significantly lower than the price of their holdings on the expiration day.
SCHD does not face these caps on gains, but SCHD is also more susceptible to downswings as a trade-off, which we can see from the drawdown graph. Besides this, SCHD's heavy allocation to oil and gas also presents a larger geopolitical risk than JEPI.
Conclusion
While SCHD may outshine JEPI on a longer time horizon, JEPI's lower volatility and incredible dividend yield make it the superior choice in our eyes. When you are looking for an attractive product that can give you broad market exposure and lower the overall volatility of your portfolio, then JEPI is precisely what you are looking for. In addition, the high dividend yield lets you reinvest the ETF's distributed income, thus generating an even higher income for the coming years, compounding these gains.
After all, Einstein once referred to compound interest as the world's eighth wonder: "He who understands it, earns it … he who doesn't … pays it." In addition, Warren Buffet has called compound interest the investor's best friend - so why not let your best friend help you build wealth in 2024 and beyond?
Furthermore, the better Sharpe ratio and lower drawdown of JEPI solidify our choice for JEPI. If you must choose between SCHD and JEPI, you simply cannot pass on a product that gives you a Sharpe ratio of 1 when the alternative only provides 0.3.
In addition, going into 2024, the markets face a time where the rate cuts, and when they will take place, are not set in stone. Therefore, it is likely that we will see some volatility in 2024, which is where JEPI will shine.
For us, it is pretty clear that JEPI is a buy over SCHD.
For further details see:
JEPI Vs. SCHD: One Is Good, But The Other Is Better