JEPI - JEPQ: Lessons From JEPI
2023-09-06 02:49:58 ET
Summary
- The JPMorgan Nasdaq Equity Premium Income ETF is a relatively new member of the JPMorgan income fund family.
- Given the lack of data, many investors are likely uncertain about its current valuation and long-term return potential.
- This article compares it to the JPMorgan Equity Premium Income ETF. Given their similar strategy, such comparison provides a few key insights.
- Future incomes are expected to be under pressure due to high-interest rates and quieter volatility.
- The dividend yields are not as attractive as on the surface.
Thesis: JEPQ vs. JEPI
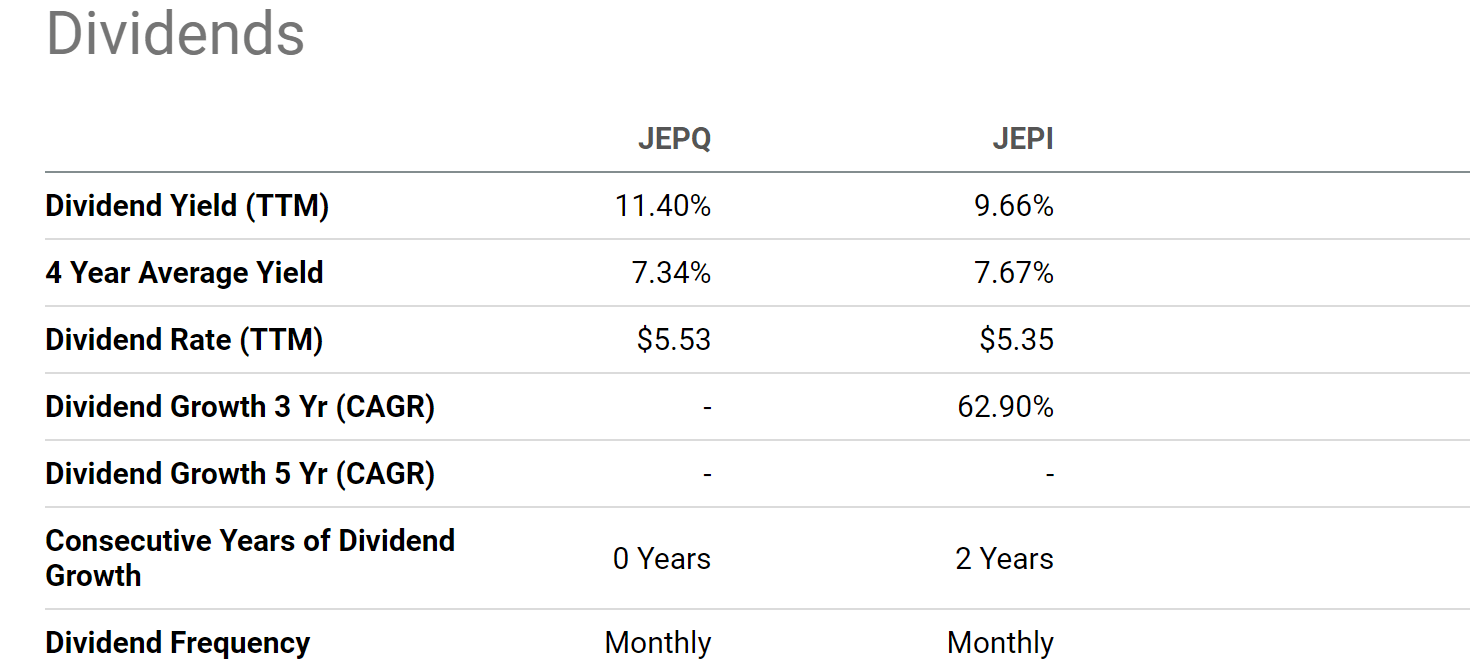
The JPMorgan Nasdaq Equity Premium Income ETF ( JEPQ ) is a recent addition to the JPMorgan ETF family, with income investors as its primary audience. As seen, the fund currently provides an 11.4% dividend yield, paid monthly. Such a yield is not only much higher than its historical average (the 4-year average is reported to be 7.34%) but also higher than other similar funds. However, note that the fund was only launched on 05/03/2022. Therefore, the 4-year average is not really meaningful in this case.
Source: Seeking Alpha
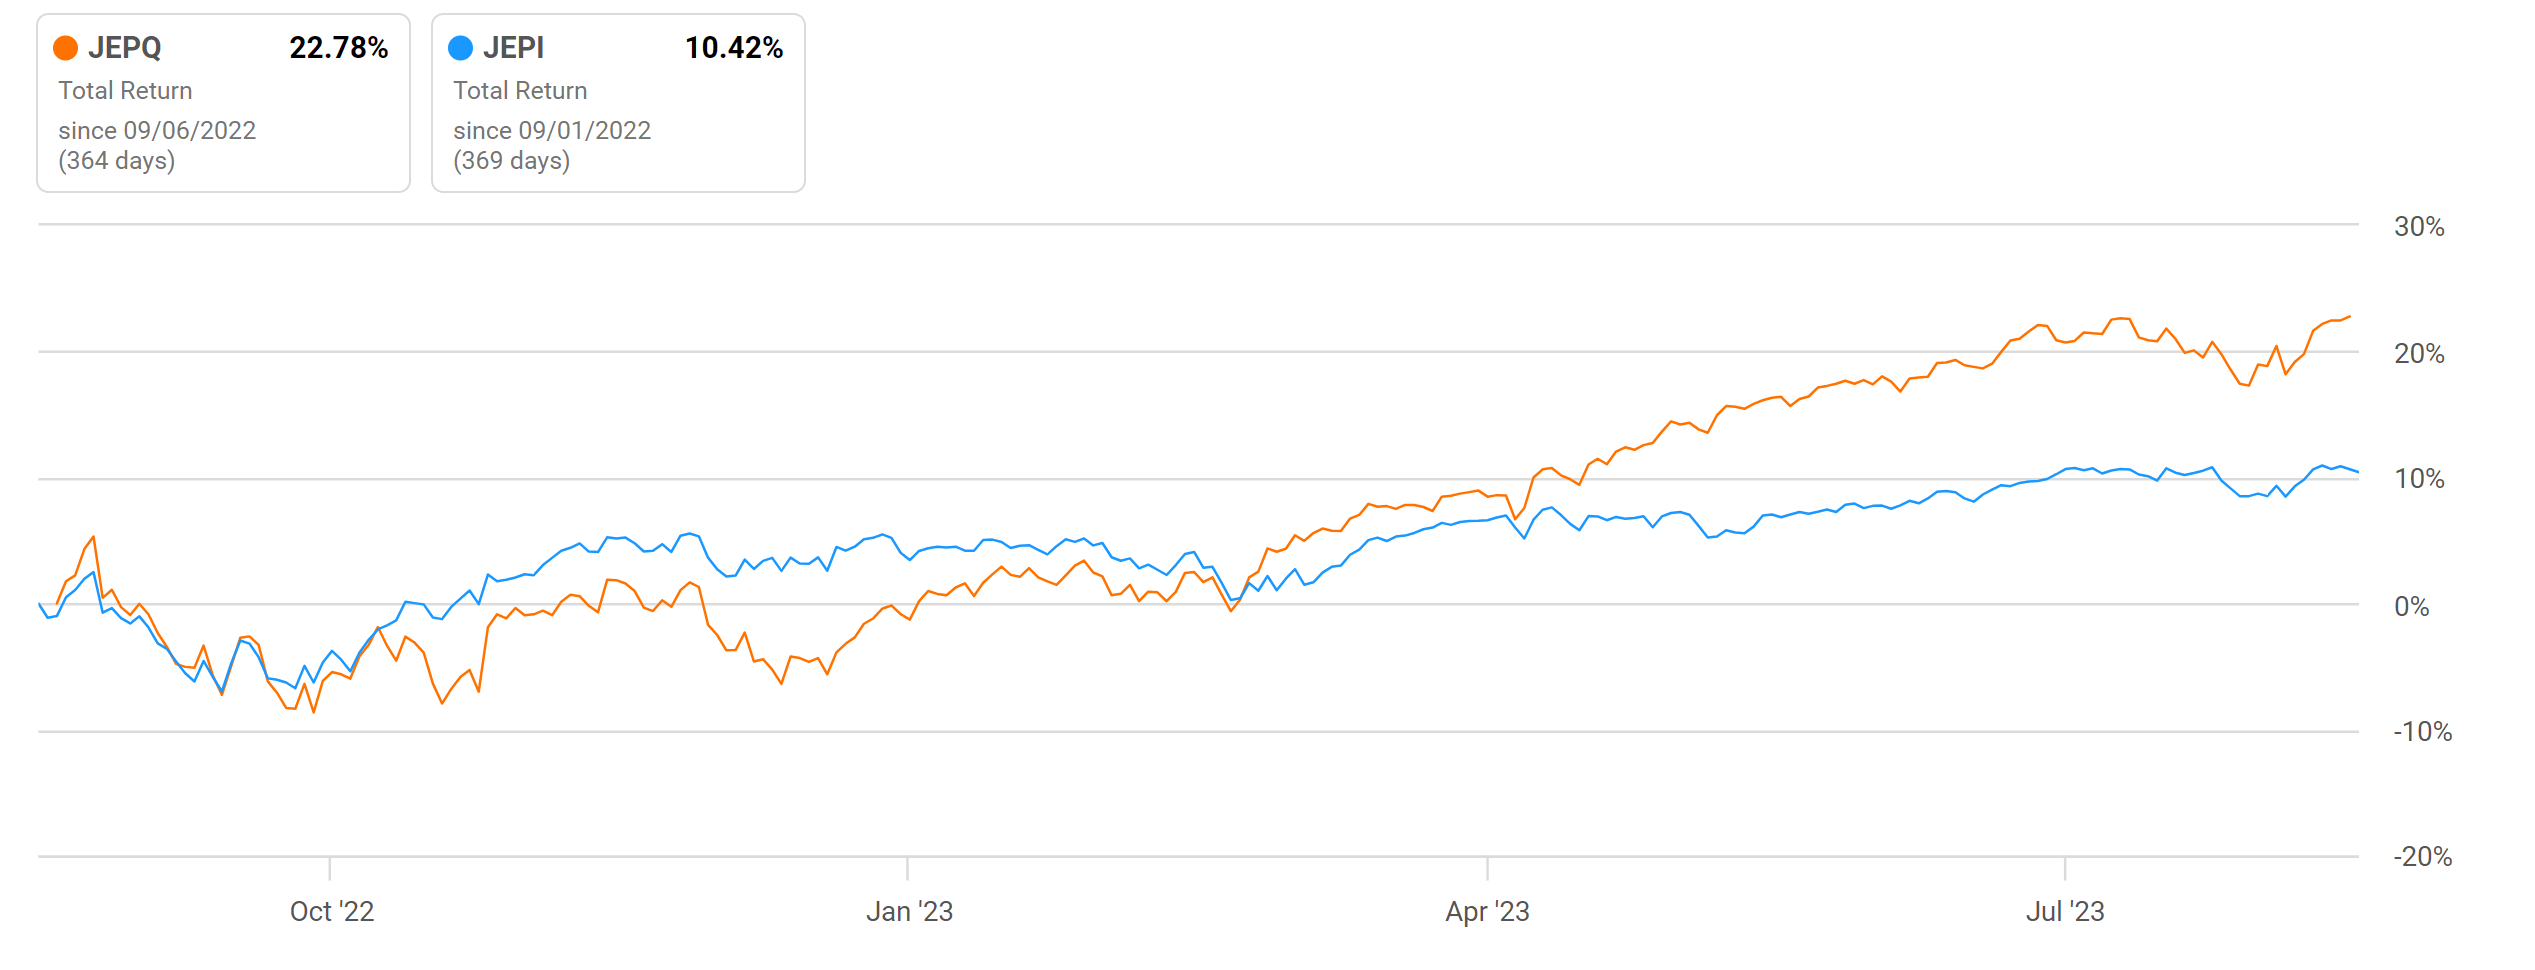
As such, I assume many potential investors are hoping for more data to better contextualize its current valuation and dividend yield. In this article, I will take the best approach that I know to provide more context. And my approach is to form an extrapolation based on a fund with a similar underlying strategy and a longer stretch of historical data. In this case, it is fortunate that we have a very handy candidate: the JPMorgan Equity Premium Income ETF ( JEPI ). As seen, even during the brief period since JEPQ’s inception, its performance has closely tracked that of JEPI most of the time. Although a sizable divergence began to develop around April this year.
In the remainder of this article, I will detail the fundamental similarities between these two funds and also elaborate on the implications. My overall conclusions are twofold. First, the 11.4% dividend yield from JEPQ is not as attractive as on the surface when properly benchmarked. Second, I don’t see the current environment as a good setup for covered-call strategies in general, primarily due to considerations of risk-free rates and the current volatility index.
Source: Seeking Alpha
Similarities between JEPI and JEPQ
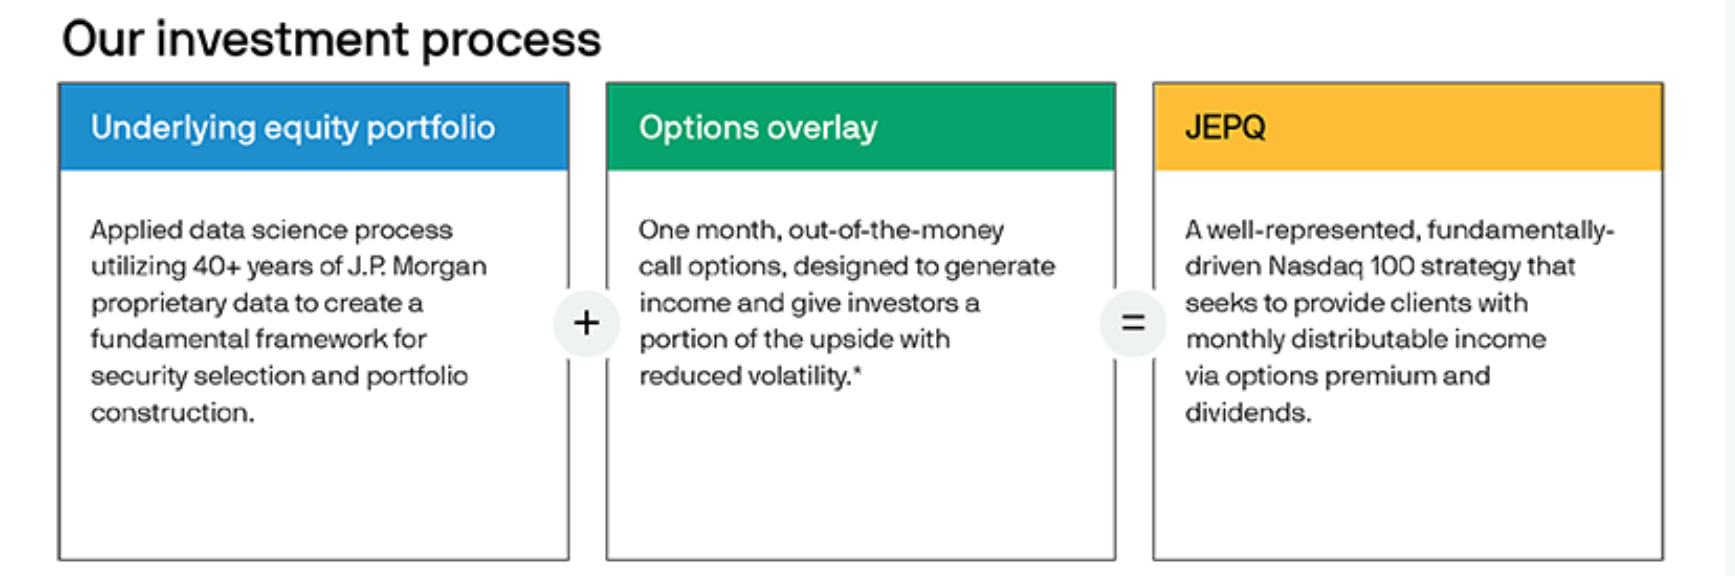
The following materials are directly taken from the funds’ webpage. As you can see from their fund descriptions, at a fundamental level, both funds apply the same strategy. The strategy consists of two steps: A) select stocks with return potential using JPM’s proprietary research, and B) use an option overlay to generate income (and hopefully reduce volatility at the same time). The difference is that JEPQ applies the strategy in the SP500 universe, and JEPI does it in the NASDAQ 100 universe.
JEPI : Defensive equity portfolio employs a time-tested, bottom-up fundamental research process with stock selection based on our proprietary risk-adjusted stock rankings. Disciplined options overlay implements written out-of-the-money S&P 500 Index call options that seek to generate distributable monthly income.
JEPQ : Generates income through a combination of selling options and investing in U.S. large-cap growth stocks, seeking to deliver a monthly income stream from associated option premiums and stock dividends. Seeks to deliver a significant portion of the returns associated with the Nasdaq 100 Index with less volatility.
Source: JEPI and JEPQ Fund Descriptions
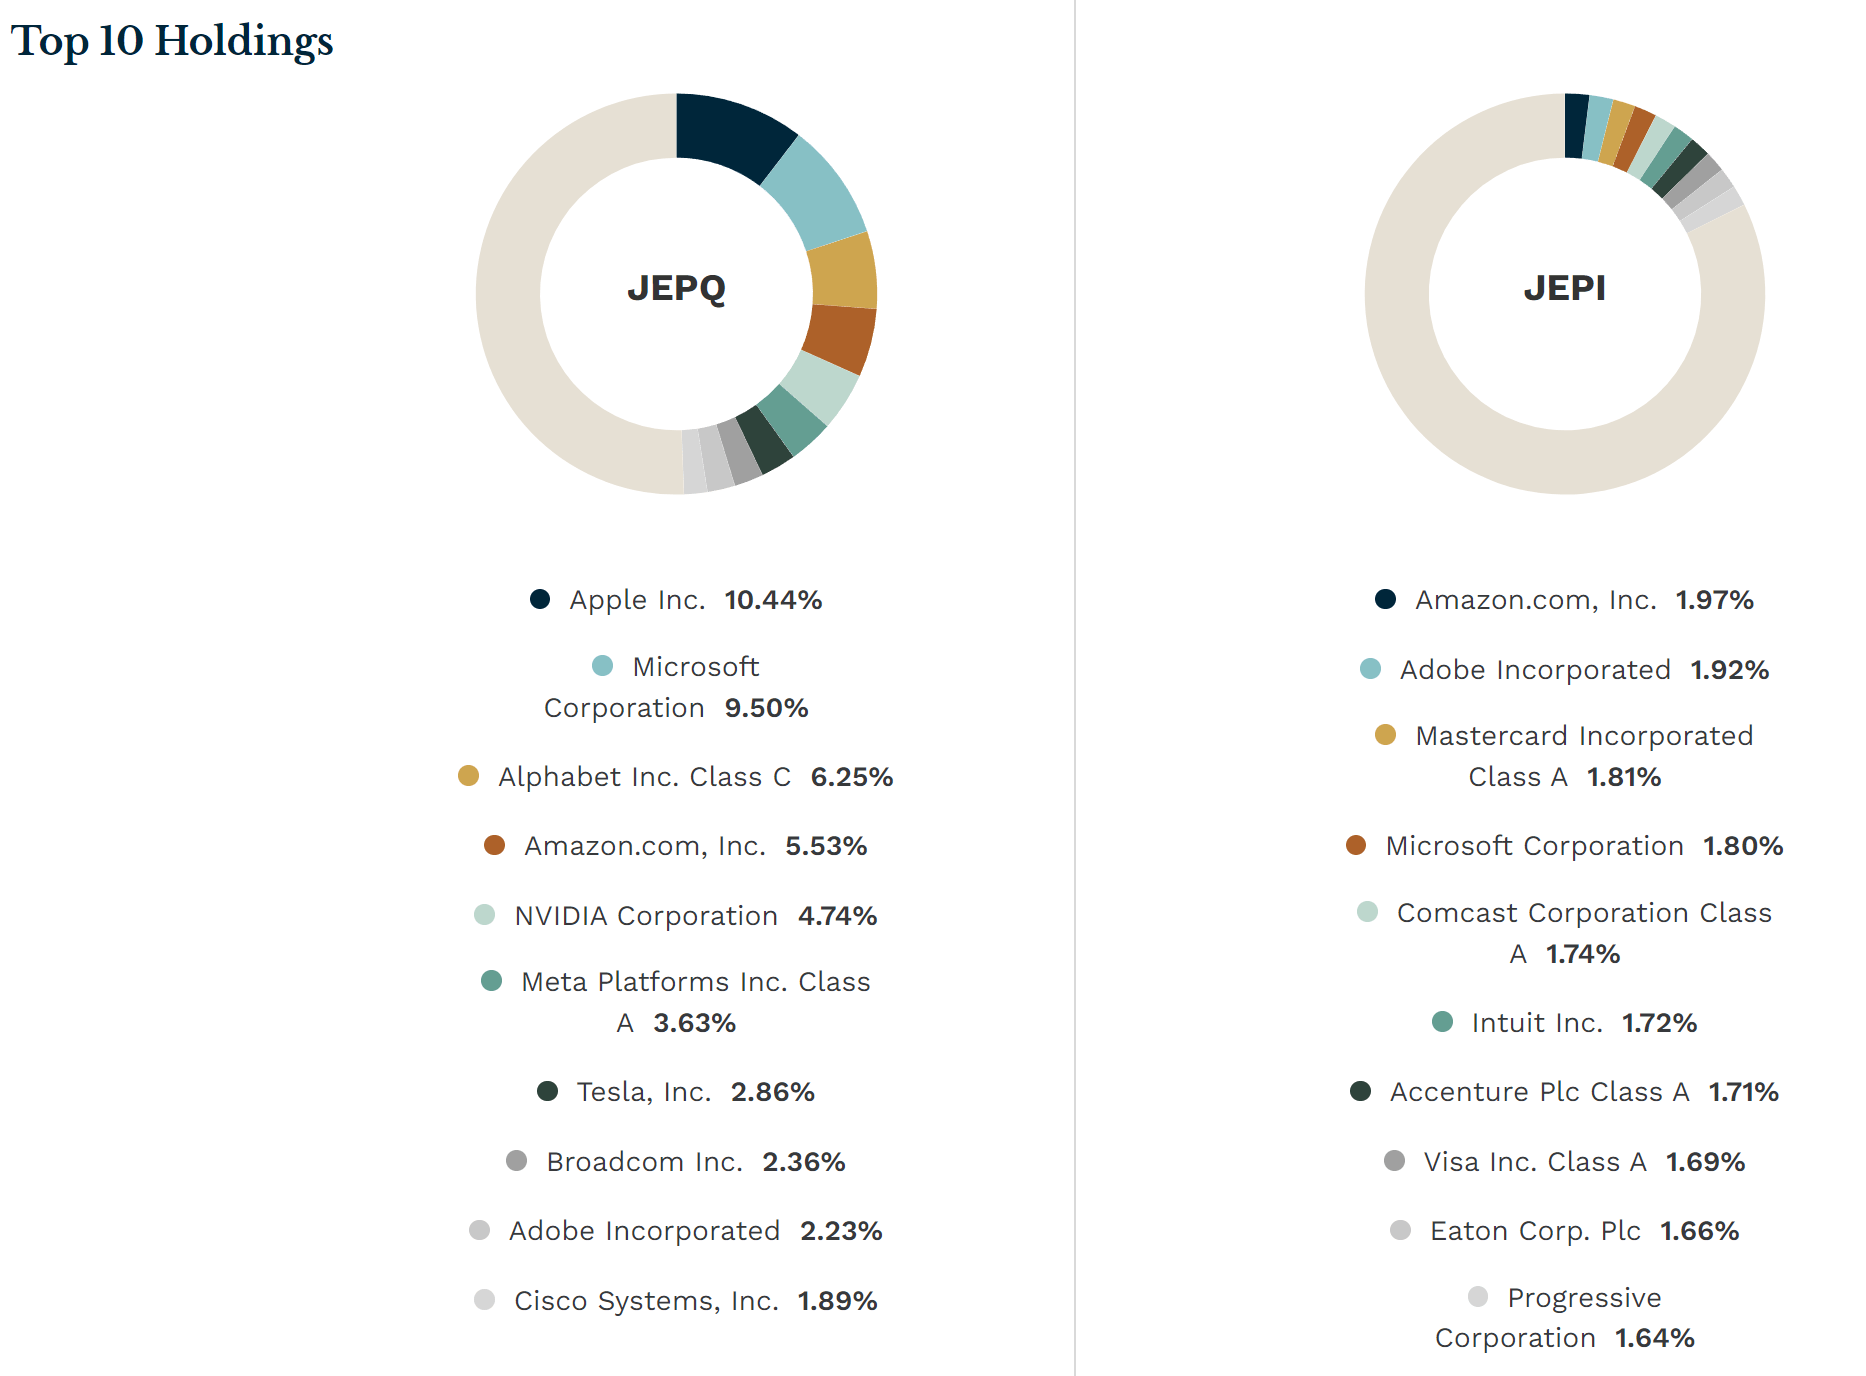
A few factors help to make these two funds even more similar beyond the overall strategy. To start, the SP500 and NASDAQ 100 index have many overlaps. Moreover, under today’s market conditions, both indices are heavily dominated by a few mega-caps such as Microsoft and Apple, further increasing the correlation between these two indices and therefore the options based on them. And finally, I don't know how JPMorgan’s proprietary algorithm picks stocks. But it seems that it tends to pick the same set of stocks for both funds as you can see from the following chart. To wit, just for their top 10 holdings, both funds have quite a few overlaps such as Amazon, Adobe, and Microsoft.
Source: ETF.com
JEPQ’s Historical performance
After establishing the similarities between JEPQ and JEPI (hopefully the above analyses convinced you sufficiently as they did for me), here I take a closer look at JEPI’s past performance to form the basis for projecting JEPQ’s future (and JEPI’s too).
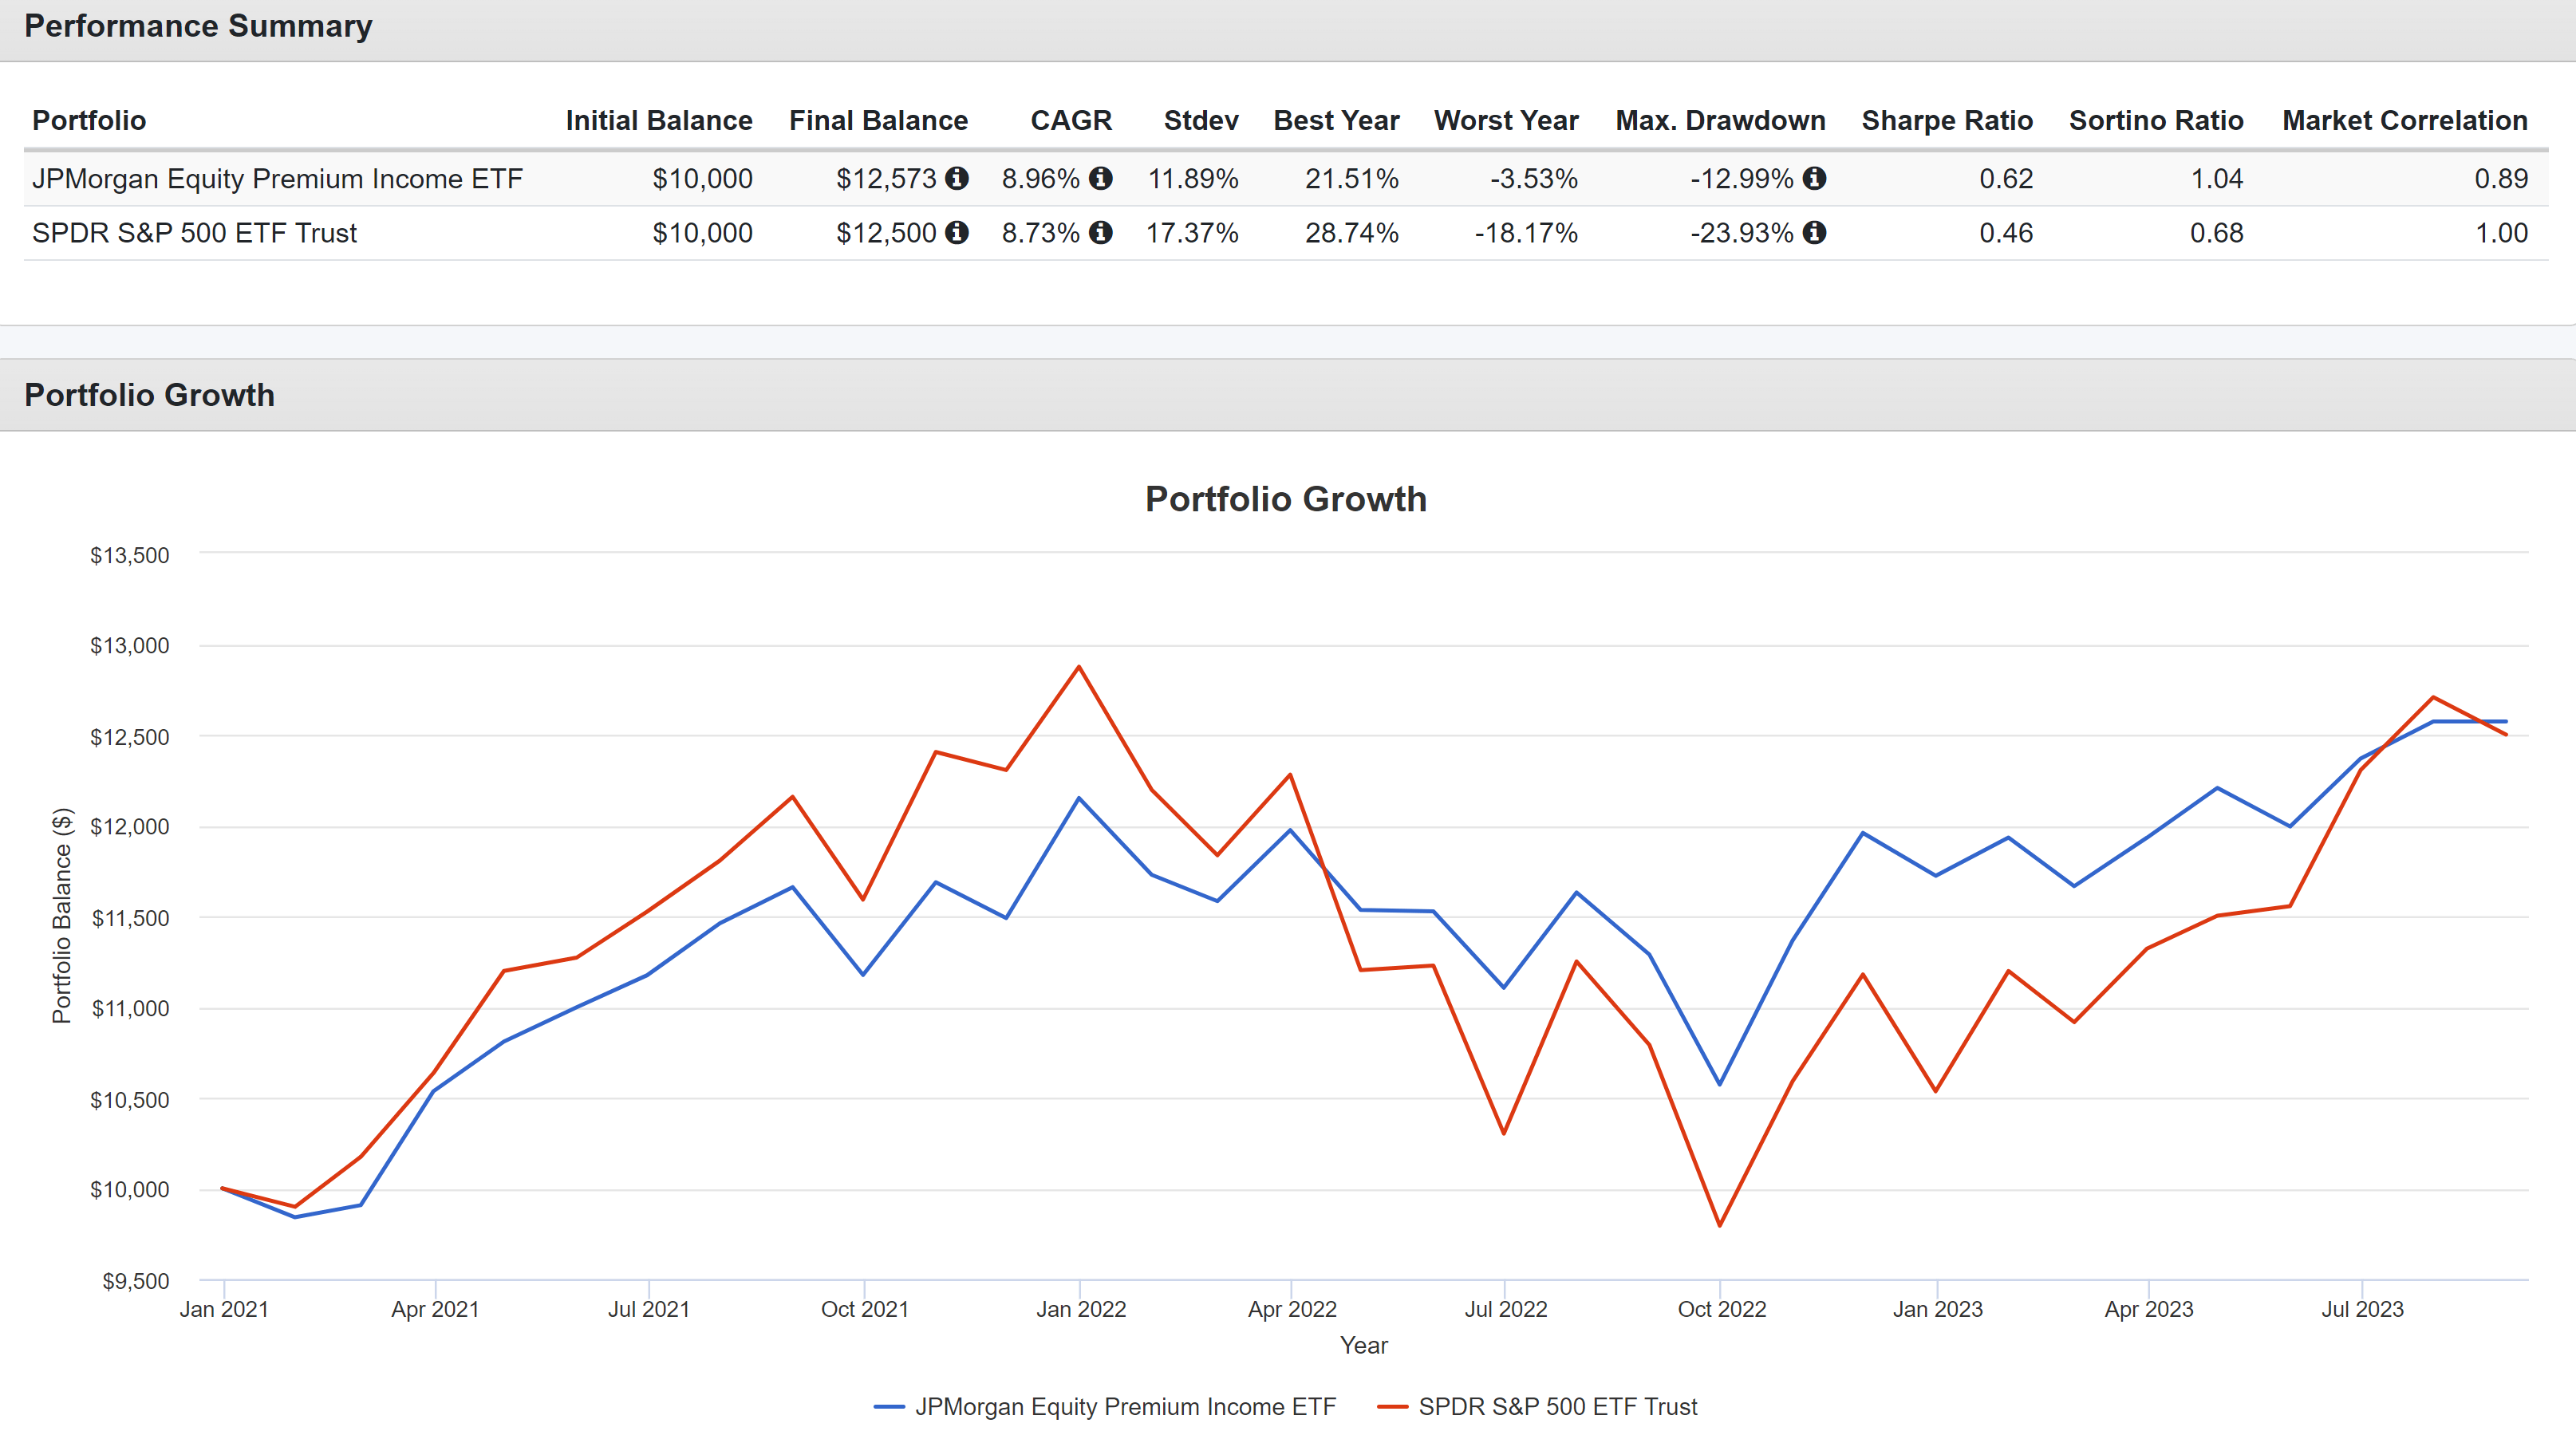
Historical data supports the strategy of JEPI as shown below. As seen, the fund accomplished its goals successfully since its inception about 2 years ago. It delivered about the same total return as the S&P 500 index. Its CAGR during this period was 8.96%, slightly outpacing SP500’s 8.73%. In the meantime, thanks to its option overlay, the fund featured far lower risks in terms of standard deviation, worst drawdowns, and worst-year performance compared to the SP500 index. Especially, its worst year performance was only -3.53%, a fraction of SP500’s -18.2%. The numbers tend to feel less painful in hindsight. So, to fully appreciate the significance, you will have to try recalling (or imagining) the agony you actually experienced when your account lost 18%.
Source: Portfolio Visualizer
Outlook for JEPQ and JEPI
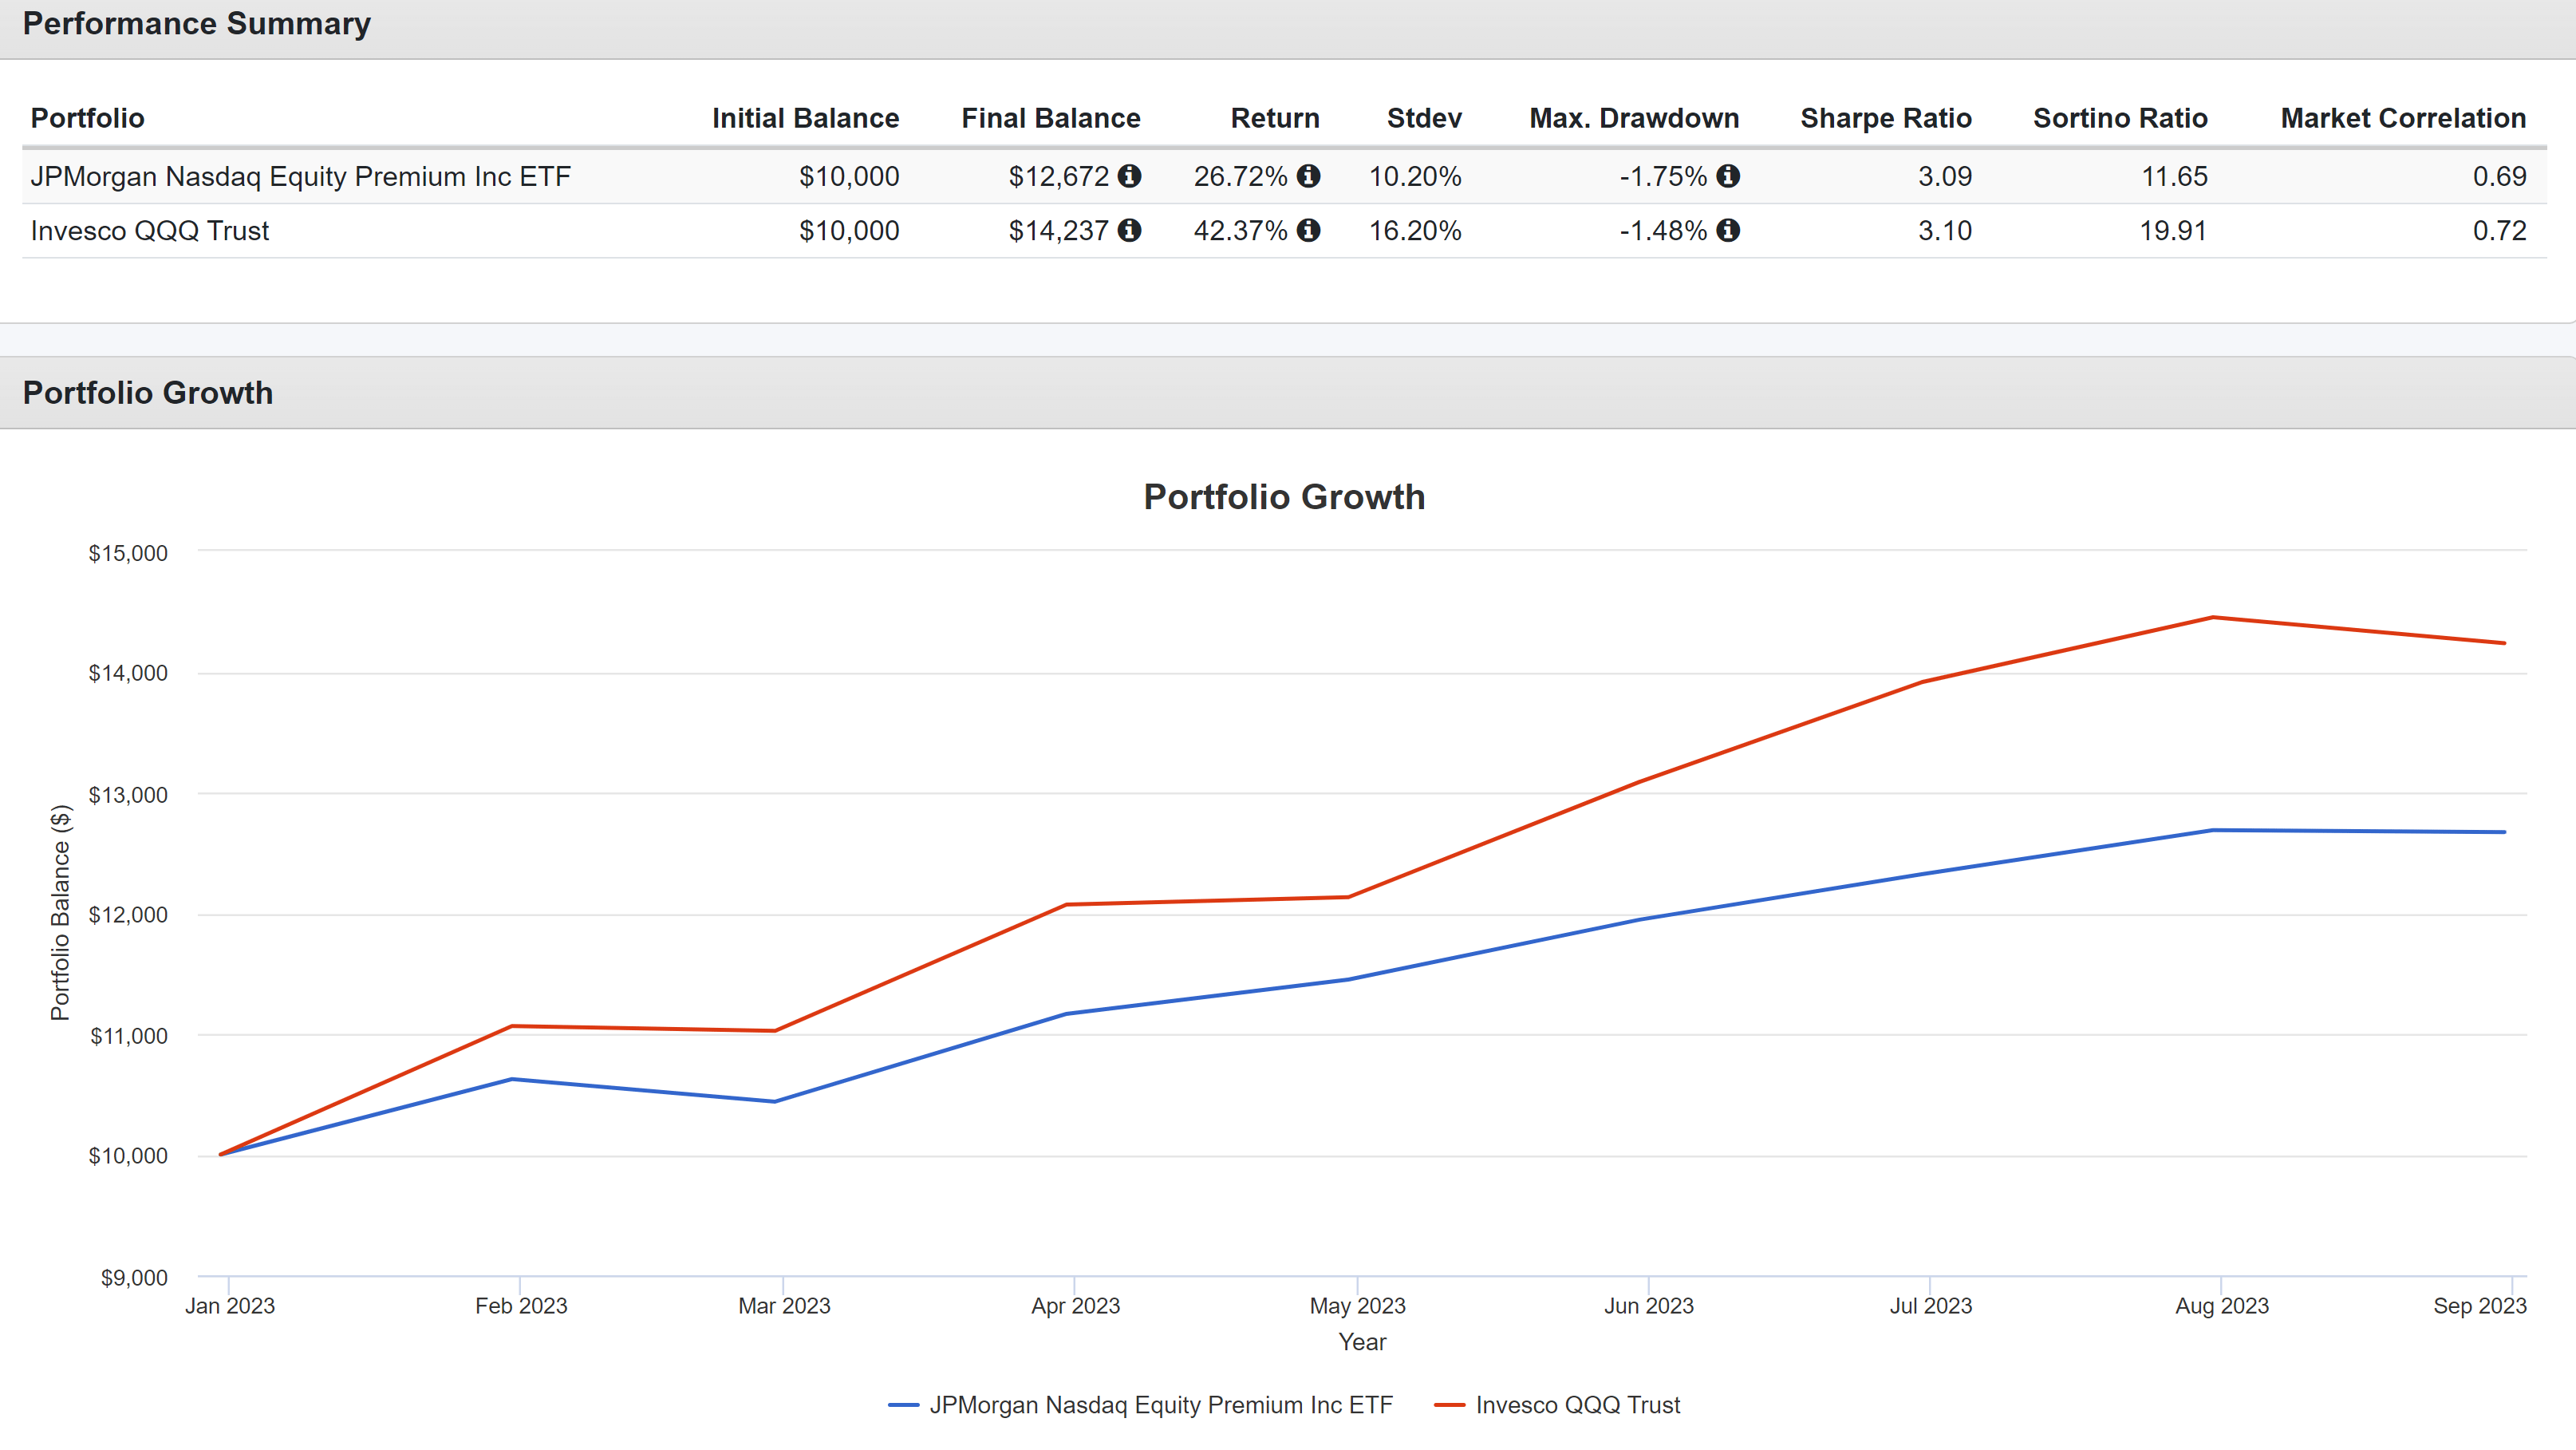
Based on the above data from JEPI, I will form an outlook for JEPQ via extrapolation now. As seen in the chart below, JEPI has unfortunately lagged the underlying NASDAQ index (approximated by QQQ) since its inception. The lag actually is quite substantial even during this short period of time (26% total return vs. 42% total return from QQQ).
I anticipate such lag for total return to persist for JEPQ for two reasons detailed immediately below. And at the same time, for these same reasons, I see unfavorable odds for JEPI’s past performance (that is, when benchmarked against the S&P 500 index) to continue.
Source: Portfolio Visualizer
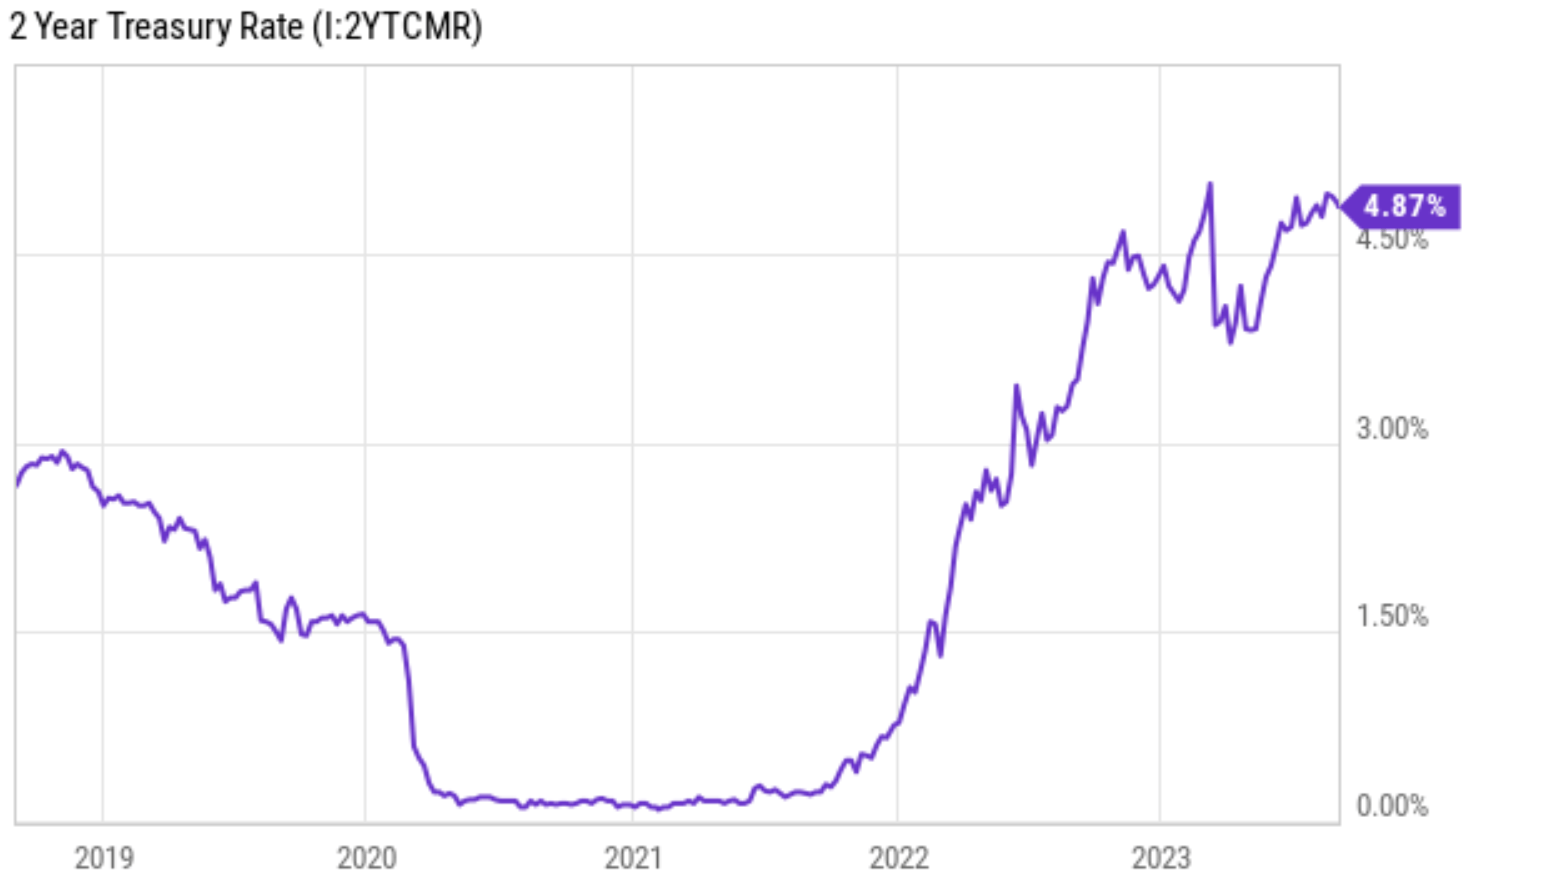
The first reason involves interest rates. In my view, a main contributor to the favorable performance of JEPI in the past 2~3 years is that interest rates are near a historical low during that period (see the chart below). Currently, interest rates are at a relatively high level and can persist. Jerome Powell just reminded the market about the Fed’s hawkish stance very recently at the Jackson Hole symposium. A higher premium negatively impacts covered-call strategies in several ways. First, option premiums will be under pressure. This is because options are priced based on the expected future value of the underlying asset, and higher interest rates make future cash flows less valuable. As a result, I anticipate covered-call funds like JEPI and JEPQ to collect lower premiums for the options they sell, which will reduce their income and total return. Secondly, a higher interest effectively compresses the dividend yields from these funds. As mentioned above, both JEPI and JEPQ generated attractive yields (especially JEPI) on the surface. But benchmarked against risk-free rates, an 11% dividend yield today when risk-free rates are ~5% is much less attractive than a 7% dividend yield 2 years ago when risk-free rates are almost zero.
Source: Seeking Alpha
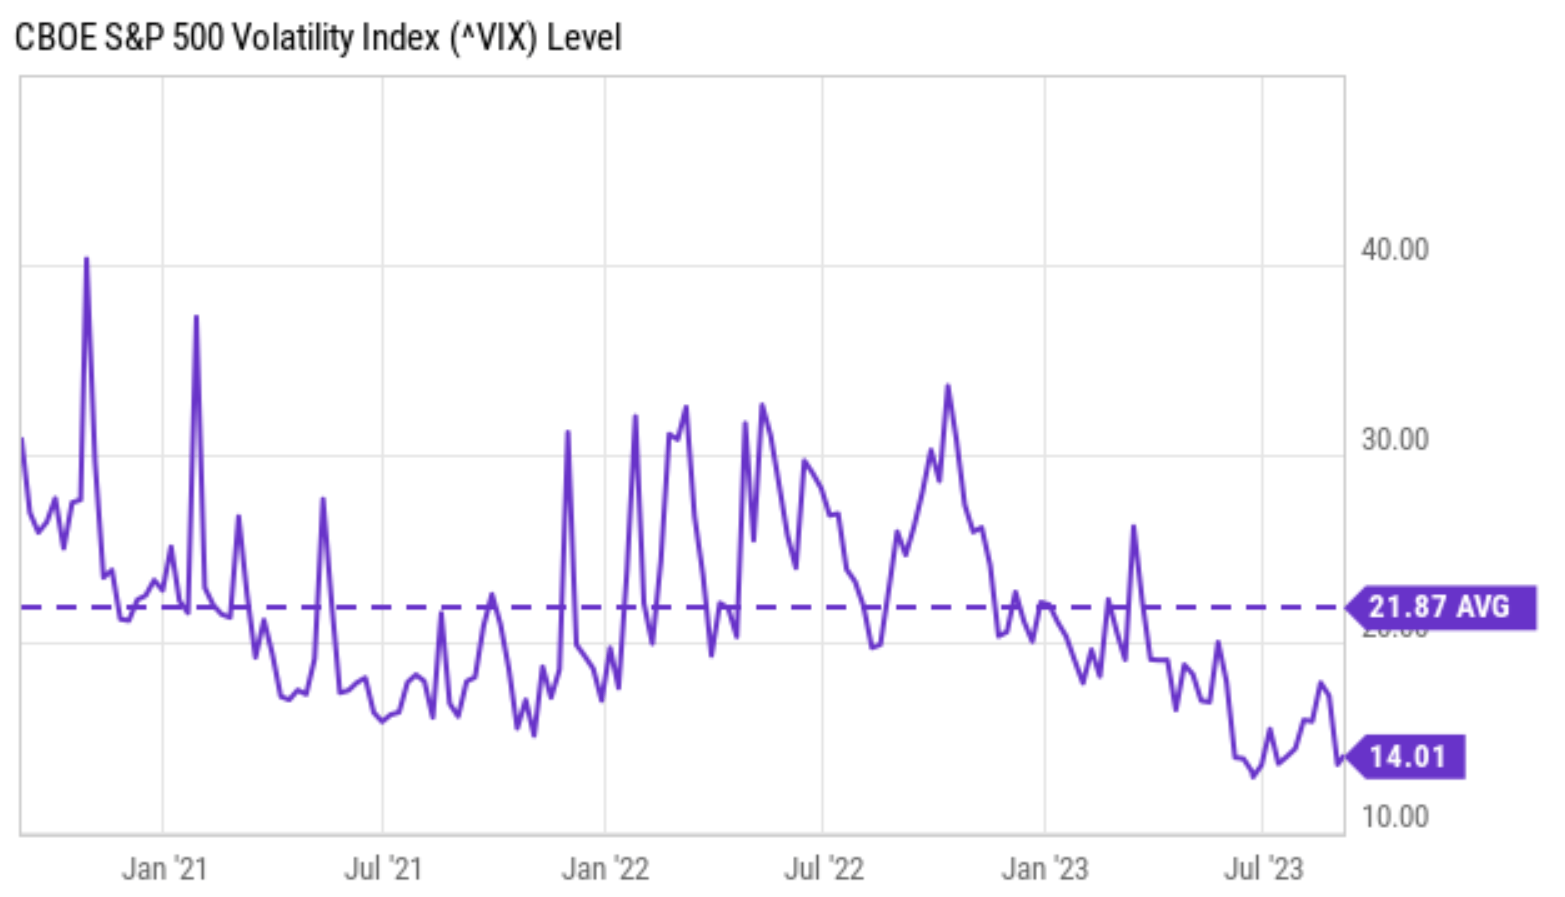
In the meantime, the volatility index (“VIX”) has been above the historical average most of the time during the past 2~3 years, largely due to COVID. As seen in the chart below, VIX stayed above the 30x level for extended periods of time. And currently, the VIX is only about 14x. To provide a broader context, a VIX index of 30x corresponds to about 92% percentile historically, a VIX of 22x (the average in the past 3 years) corresponds to a 73% percentile, and the current 14x level corresponds to a 30% percentile. As aforementioned, JEPQ and JEPI both generate income by selling call options on the underlying assets they hold. The income they generate is directly proportional to implied volatility, which moves in tandem with the VIX index. With the current VIX (which is far below the average in the past 3 years), I expect the option premiums that JEPQ and JEPI can collect will be far lower than they used to be.
Source: Seeking Alpha
Other risks and final thoughts
In addition to the above risks. Funds like JEPQ and JEPI also suffer reduced upside potential. A covered- means they have to sell their underlying assets at a predetermined price (the so-called strike price) no matter how high the market price is at the time of expiration. Hence, the return potential from price appreciation is limited.
To recap, the main risks I see for JEPI and JEPQ are twofold: the elevated interest rates and the quiet volatility index. JEPI investors have enjoyed excellent returns since its inception, especially when adjusted for risks. However, such performance is largely due to record low rates (almost zero for a good portion of the past 3 years) and record high VIX (due to COVID). Now both drivers have run their course and the trends have reversed for both parameters, which explains the lag of JEPI compared to the underlying index the way I see things. Given the macroeconomic conditions, I do not anticipate either parameter to reverse course again anytime soon. As such, I see unfavorable odds for either JEPQ or JEPI to outperform their underlying indices.
For further details see:
JEPQ: Lessons From JEPI