JEPI - JEPQ's 10%+ Yield: Not As High As It Seems
2023-12-13 23:16:56 ET
Summary
- JPMorgan Nasdaq Equity Premium Income ETF currently offers a dividend yield of 10.4% on a TTM basis.
- It is not only high in absolute terms but also higher than its sister fund JEPI and its own historical average.
- The accuracy of JEPQ's historical average yield (and JEPI's too) is questionable due to limited historical data.
- Its current yield is not as attractive when benchmarked by risk-free rates.
JEPQ's 10%+ yield in focus
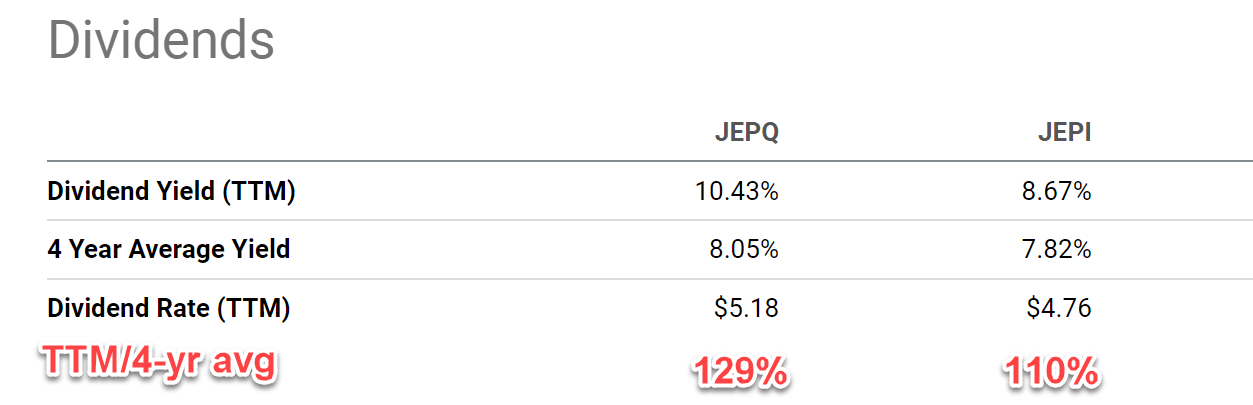
The JPMorgan Nasdaq Equity Premium Income ETF ( JEPQ ) is a recent addition to the JPMorgan ETF family. It has gained popularity relatively quickly - for many good reasons. It's primarily oriented towards income-seeking investors and as such, I will focus on its dividend here. As seen from the chart below, the fund currently offers a $5.18 dividend payout, translating into a 10.4% dividend yield on a TTM basis. To add further lure, the payouts are made monthly.
A 10%+ yield is toward the higher end of the yield spectrum among the usual options available to most investors (such as dividend stocks, treasury bonds, corporate bonds, et al). Even compared to similar funds and its own historical data, a 10%+ yield is still very high as seen in the chart below.
For example, its sister fund, the JPMorgan Equity Premium Income ETF (JEPI), is currently yielding "only" about 8.7%. Moreover, JEPQ's 4-year average yield is reported to be 8.05%. As a result, its current yield is a whopping 29% higher than its historical average, implying a large valuation discount. JEPI's current yield is also higher than its four-year average but to a lesser extent (about 10%). These data could create the impression that JEPI is trading at a large valuation discount both in absolute and relative terms.
Against this background, the thesis of this article is to caution potential investors of the risks behind such yields. More specifically, the remainder of the article will detail the following two risks:
- I will argue that JEPQ's average yields are inaccurate due to its limited historical data. As such, the evaluation based on the reported historical averages underestimates the risk premium.
- I will then argue that the current yield is not as attractive as it seems on the surface when benchmarked against risk-free rates.
JEPQ: basic information
Before diving in, a quick introduction to the fund itself in case there are readers new to it. I won't cover all the basics but will only point out a few features that are directly relevant to the analysis I will be presenting in this article.
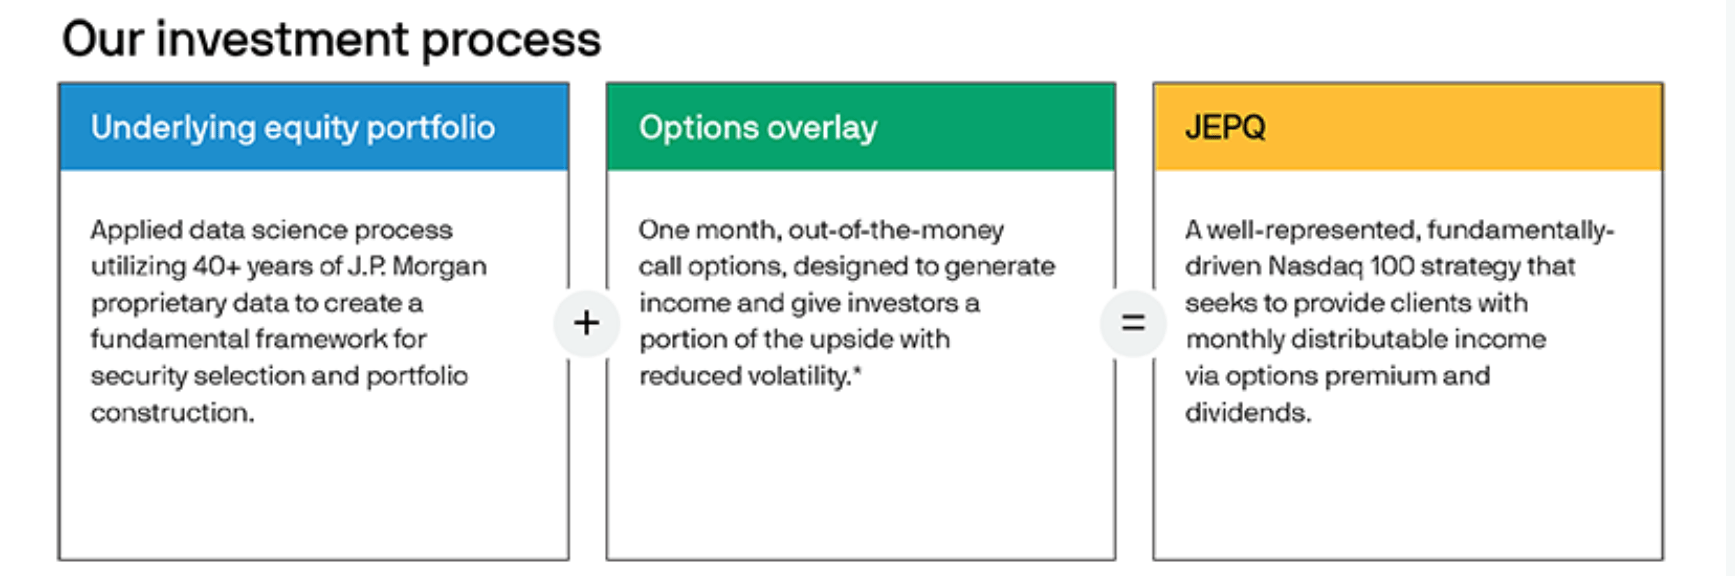
JEPQ is an actively managed fund that uses a covered-call option overlay. The strategy involves selecting stocks with a proprietary algorithm among the NASDAQ 100 universe, and then adding an option overlay to magnify the income. More specifics are provided in the following quote and chart, both taken from its fund description .
JEPQ : Generates income through a combination of selling options and investing in U.S. large-cap growth stocks, seeking to deliver a monthly income stream from associated option premiums and stock dividends. Seeks to deliver a significant portion of the returns associated with the Nasdaq 100 Index with less volatility.
JEPI applies a very similar strategy to the SP500 universe (which overlaps substantially with the NASDAQ 100 index), a key consideration for my choice of JEPI as a comparison in this analysis.
Average yield inaccurate due to limited historical data
The first risk lurking behind the 10%+ yield is that its historical average yield underestimates the risk premium in my view.
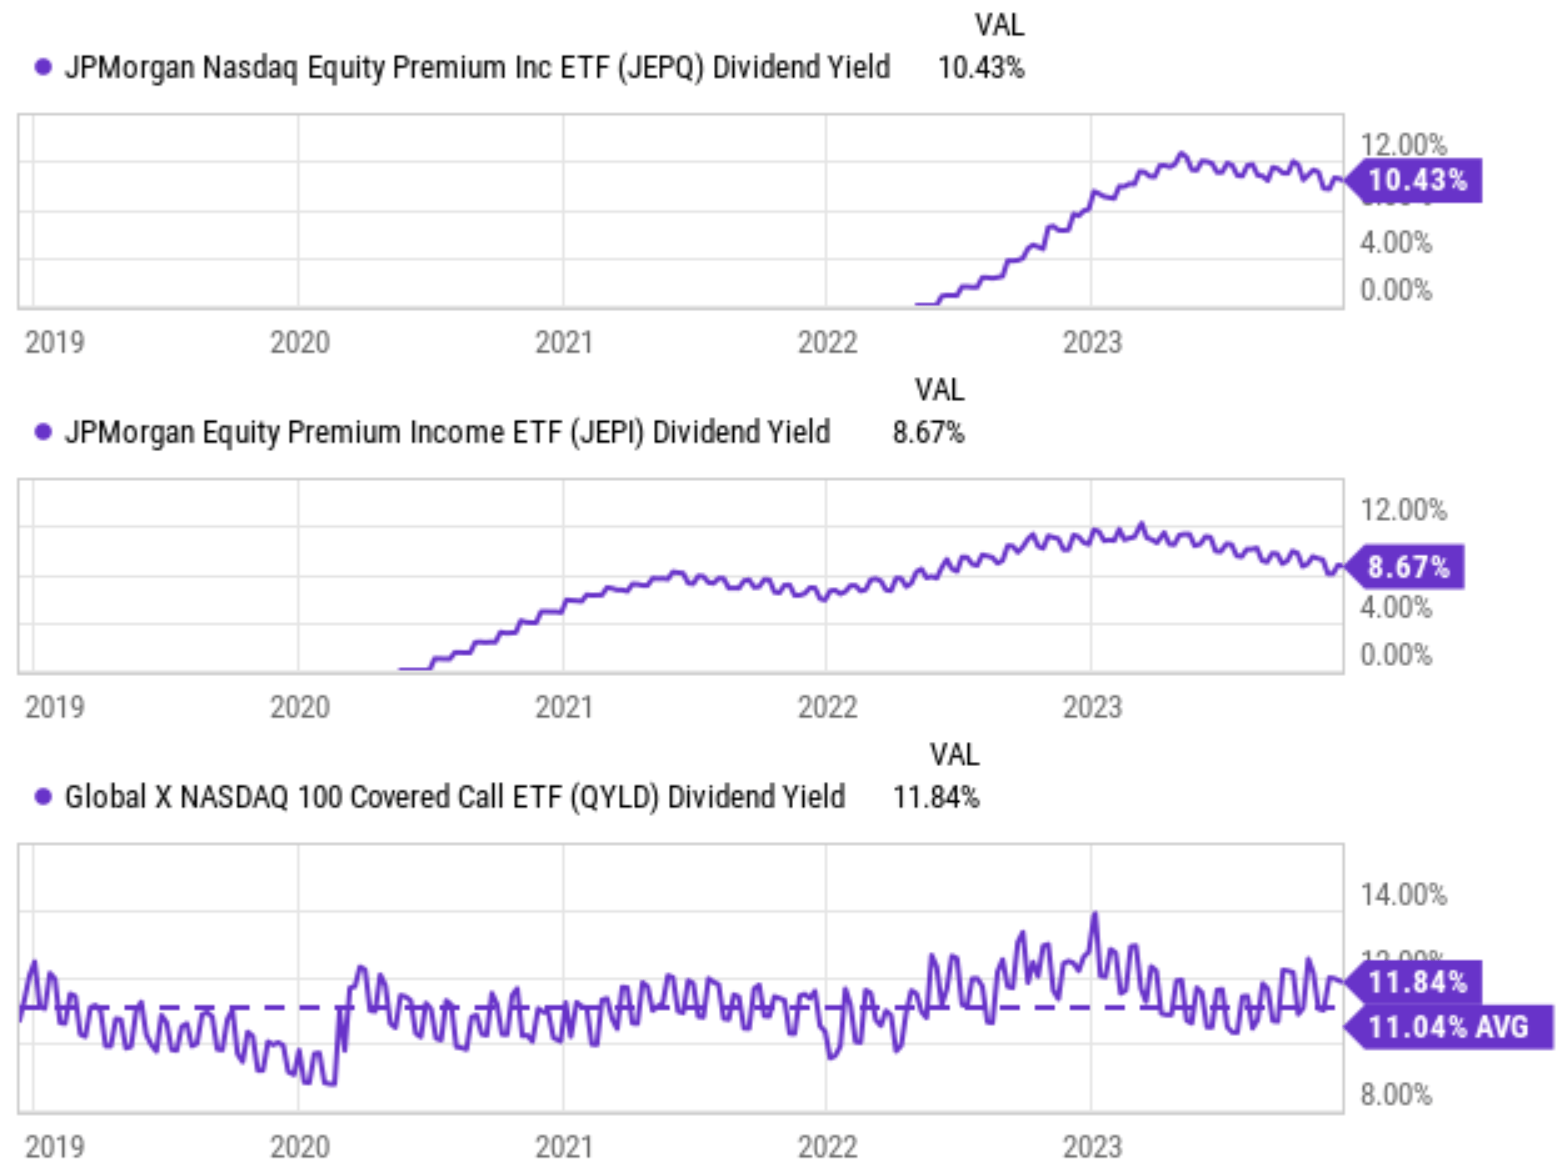
JEPI was only launched recently in May 2022. As a result, it has a very limited dividend history as you can see from the top panel of the following chart. Furthermore, almost half of this period since its launch was a ramp-up period for its dividend payments as seen. As a result, the average yield reported by most websites is not that meaningful. Even the historical data of its sister fund JPEI is still too limited in my view and therefore creates similar biases as seen in the mid panel shown below.
To get a more representative ESTIMATE of its long-term average yield, let's take a look at Global X NASDAQ 100 Covered Call ETF (QYLD). QYLD has a much longer history as seen in the bottom panel of the chart, and it is also a cover-call strategy based on the NASDAQ 100 index as the name suggests. As seen, QYLD's average dividend yields in the past 5 years are around 11%, higher than both JEPQ and JEPI's by a good margin.
Before I leave this section, I want to emphasize the keyword here is "estimate". The use of QYLD's data to extrapolate JEPQ's data involves several uncertainties as to be elaborated in the last section.
Current yield not as attractive when benchmarked against risk-free rates
Moving onto the second key risk hiding behind the 10%+ yield. As aforementioned, this risk involves benchmarking JEPQ's yield against risk-free rates - the gravity for all assets valuation.
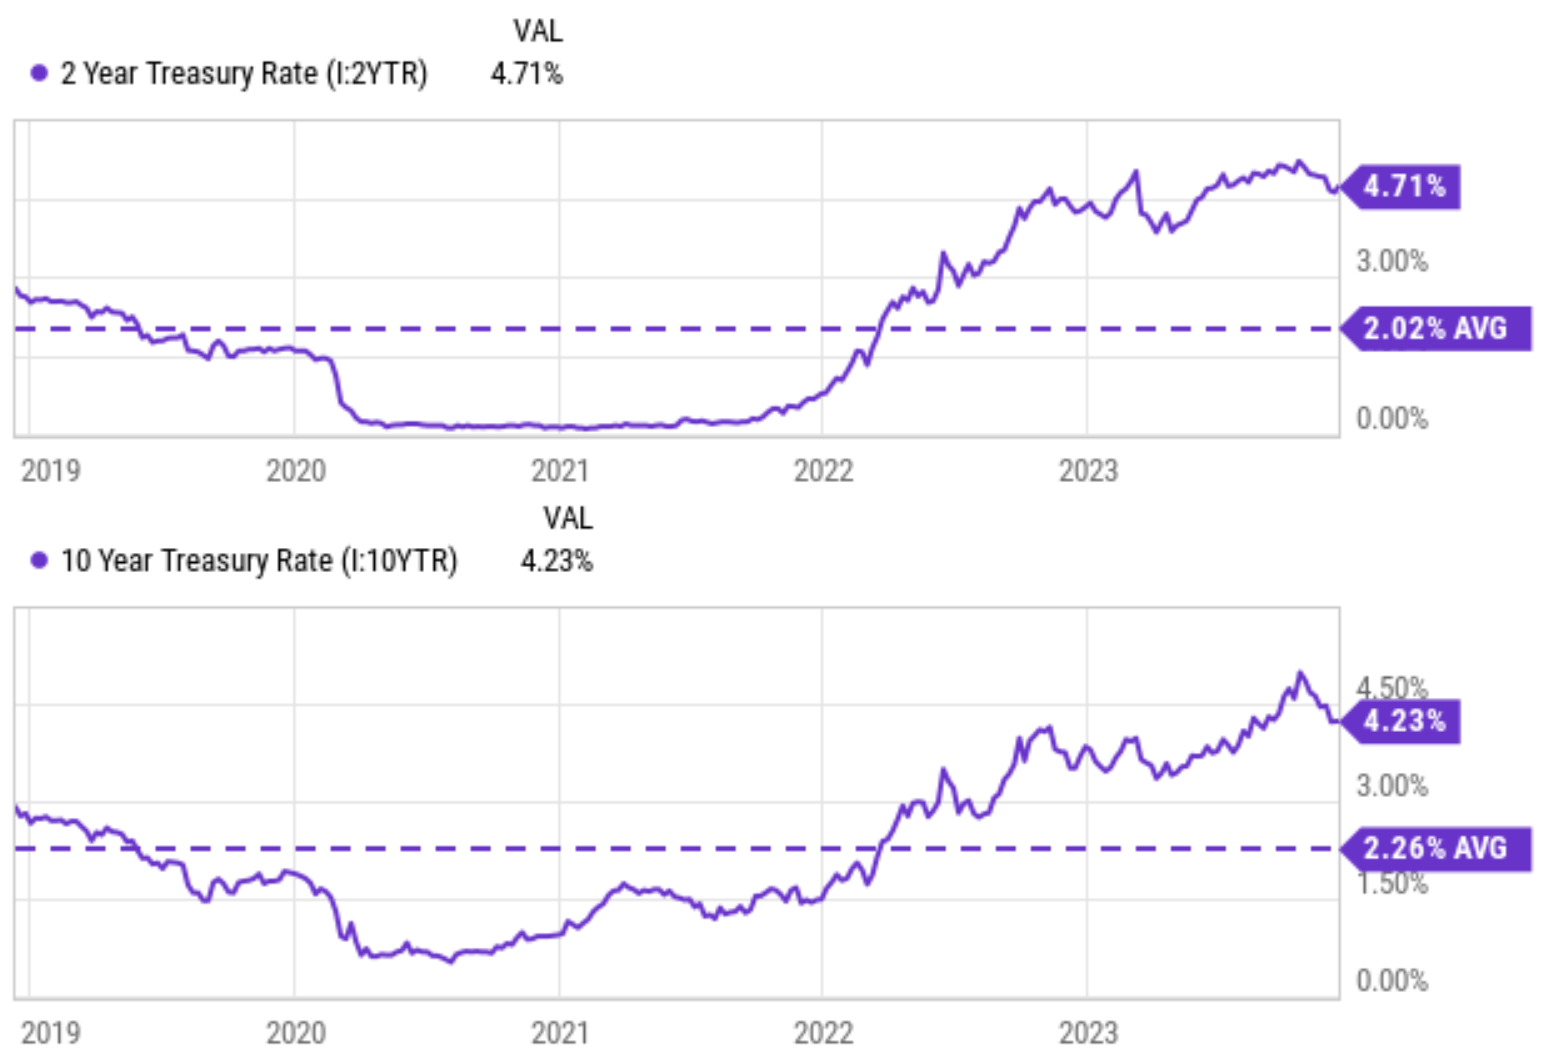
In the past ~5 years or so, risk-free interest rates - both long-term and short-term - have undergone quite dramatic changes. Take the 2-year treasury rates as an example. The average interest rate for 2-year Treasury bonds in the United States was about 3.0% 5 years ago. It then decreased to almost 0% during the COVID pandemic and now it has increased back to 4.71%. On average, the rate for 2-year treasury bonds was 2.02% in the past 5 years.
Two key observations from these data:
- The current risk-free rates are much higher than the 5-year average. A higher risk-free interest rate automatically compresses the true value of the dividends from JEPQ (or any other instrument).
- More specially, JEPQ's historical average yield was around 8% as reported. This was about 6% above the average 2-year treasury rates in the past 5 years. Its current yield of 10.4%, although higher in absolute terms, actually offers a lower spread above the current 2-year treasury rates. The yield spread is about 5.7% (10.4% minus 4.7%).
Other risks and final thoughts
There are many risks generic to covered-call funds like JEPQ (such as reduced upside potential and sensitivity to the volatility index). These risks have been detailed in my earlier articles (and also other SA articles) and I won't further elaborate here. Instead, I will focus on a risk that is specific to the approach used in this article.
If you recall, I used QYLD's past yield to estimate what JEPQ's average yield should be. Such an estimate has a few uncertainties, which could represent upside risks. QYLD is based on the entire NASDAQ 100 index while JEPQ actively selects stocks from the index. QYLD also uses a different percentage of the underlying to cover the calls. JEPQ might be able to create extra alpha and have a different average yield as a result. But I don't these factors change the essence of my key point, which is that JEPQ's historical data is too limited so its reported past average yield is inaccurate and underestimates the risk premium.
To be perfectly clear, I am not arguing that JEPQ is a bad fund. It serves its purpose beautifully (which is primarily to deliver current income). The goal of this article is to caution investors about the risks behind JEPQ's dividend yields. And to recap, the gist is that its current dividend yield is not as attractive as it seems when A) the inaccuracy of its historical average yield is considered, or B) its yield is benchmarked against risk-free interest rates.
For further details see:
JEPQ's 10%+ Yield: Not As High As It Seems