JHI - JHI: A Classic Example Of A Return Of Principal Fund
Summary
- The JHI fund focuses on investments in junk bonds to generate a high yield.
- It has a current yield of 9.3%.
- However, it has a mediocre 10Yr average annual return of 3.6%.
- The JHI is paying out more than it earns in the long run, with a shrinking NAV and declining distribution over the years.
- I would look elsewhere for junk bond exposure.
The John Hancock Investors Trust ( JHI ) is a junk bond-focused closed-end fund ("CEF") that pays a high distribution yield of 9.3%. However, it has all the hallmarks of a return of principal fund, with a shrinking NAV and declining distributions over time. Compared to peer funds, it has lower returns and higher volatility. I would avoid this fund.
Fund Overview
The John Hancock Investors Trust ( JHI ) is a closed-end fund focused on generating current income for distribution to shareholders. The fund primarily invests in a portfolio of U.S. and international debt securities, some of which may carry equity features. The JHI fund may invest up to 70% of net assets in non-investment grade ("junk") bonds, as well as preferred securities and common stock through exercise of conversion rights up to 20% of the portfolio holdings. Up to 50% of the fund's assets may be invested in private placement of restricted securities.
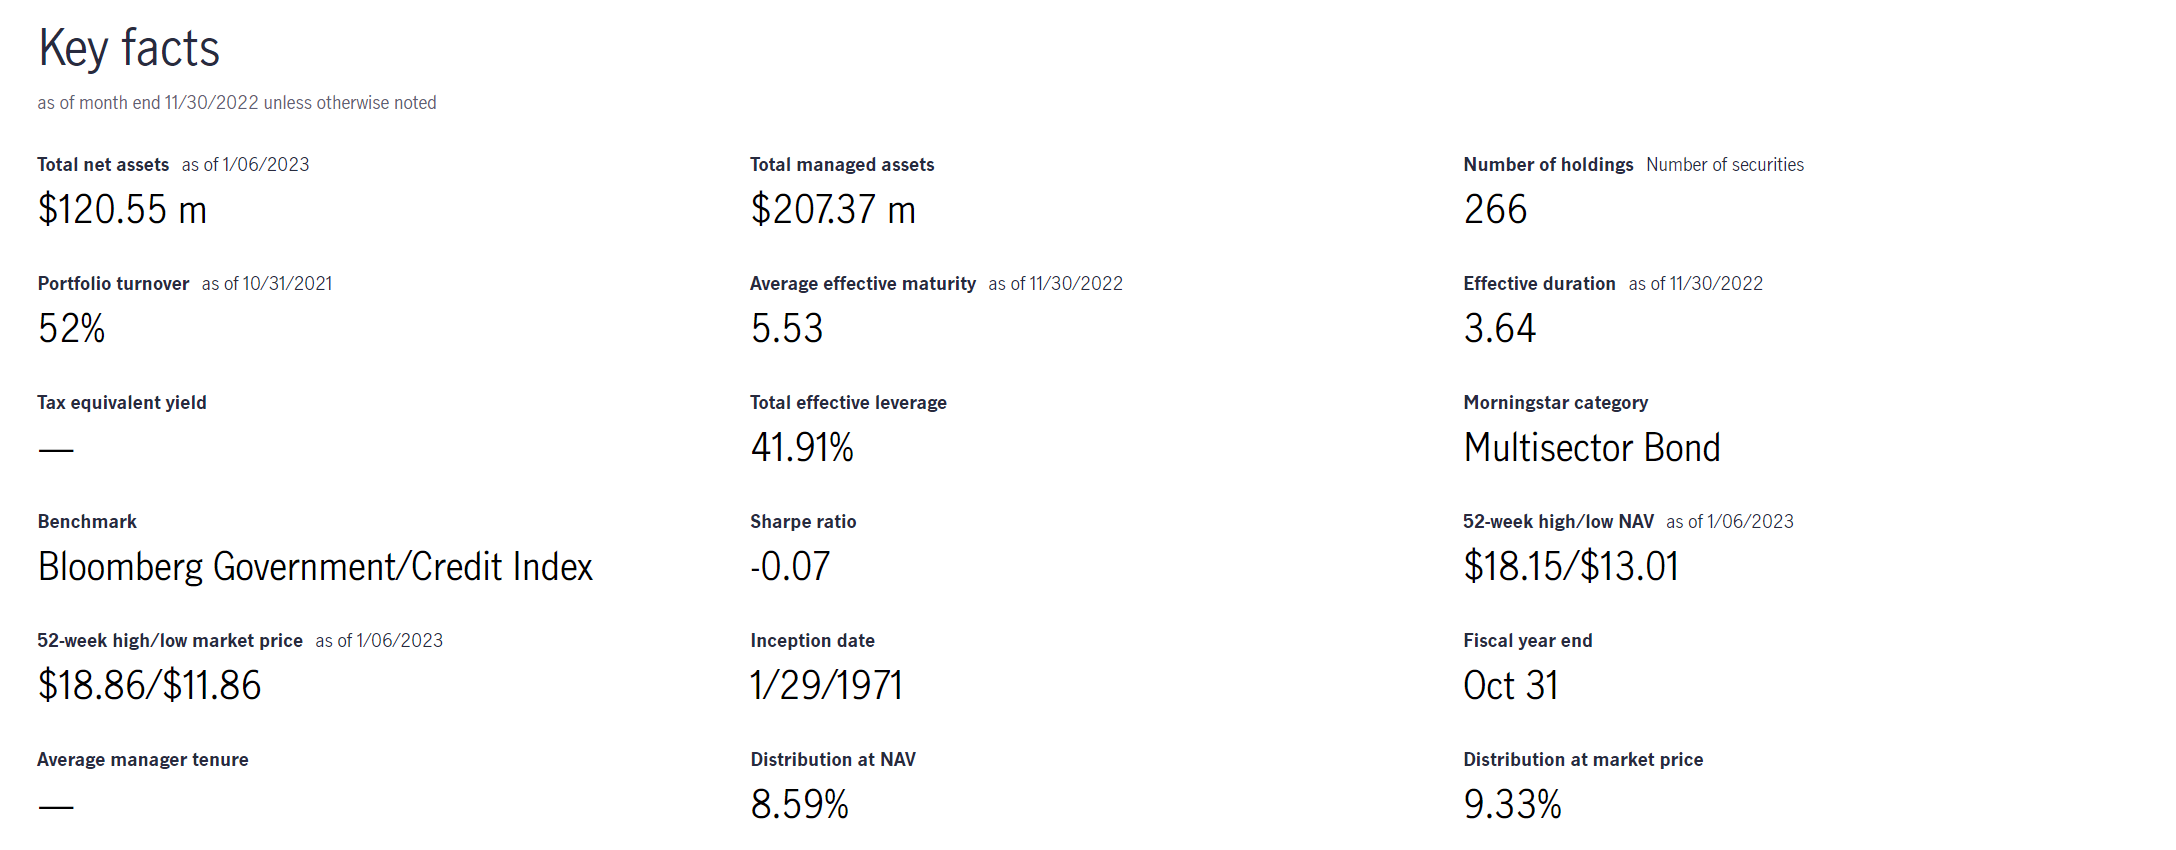
The JHI fund is fairly small, with only $120 million in net assets. It is also quite leveraged, with effective leverage of 41.9% (Figure 1). The fund charges a 2.35% expense ratio after accounting for a reduction in certain expenses.
Figure 1 - JHI fund characteristics (jhinvestments.com)
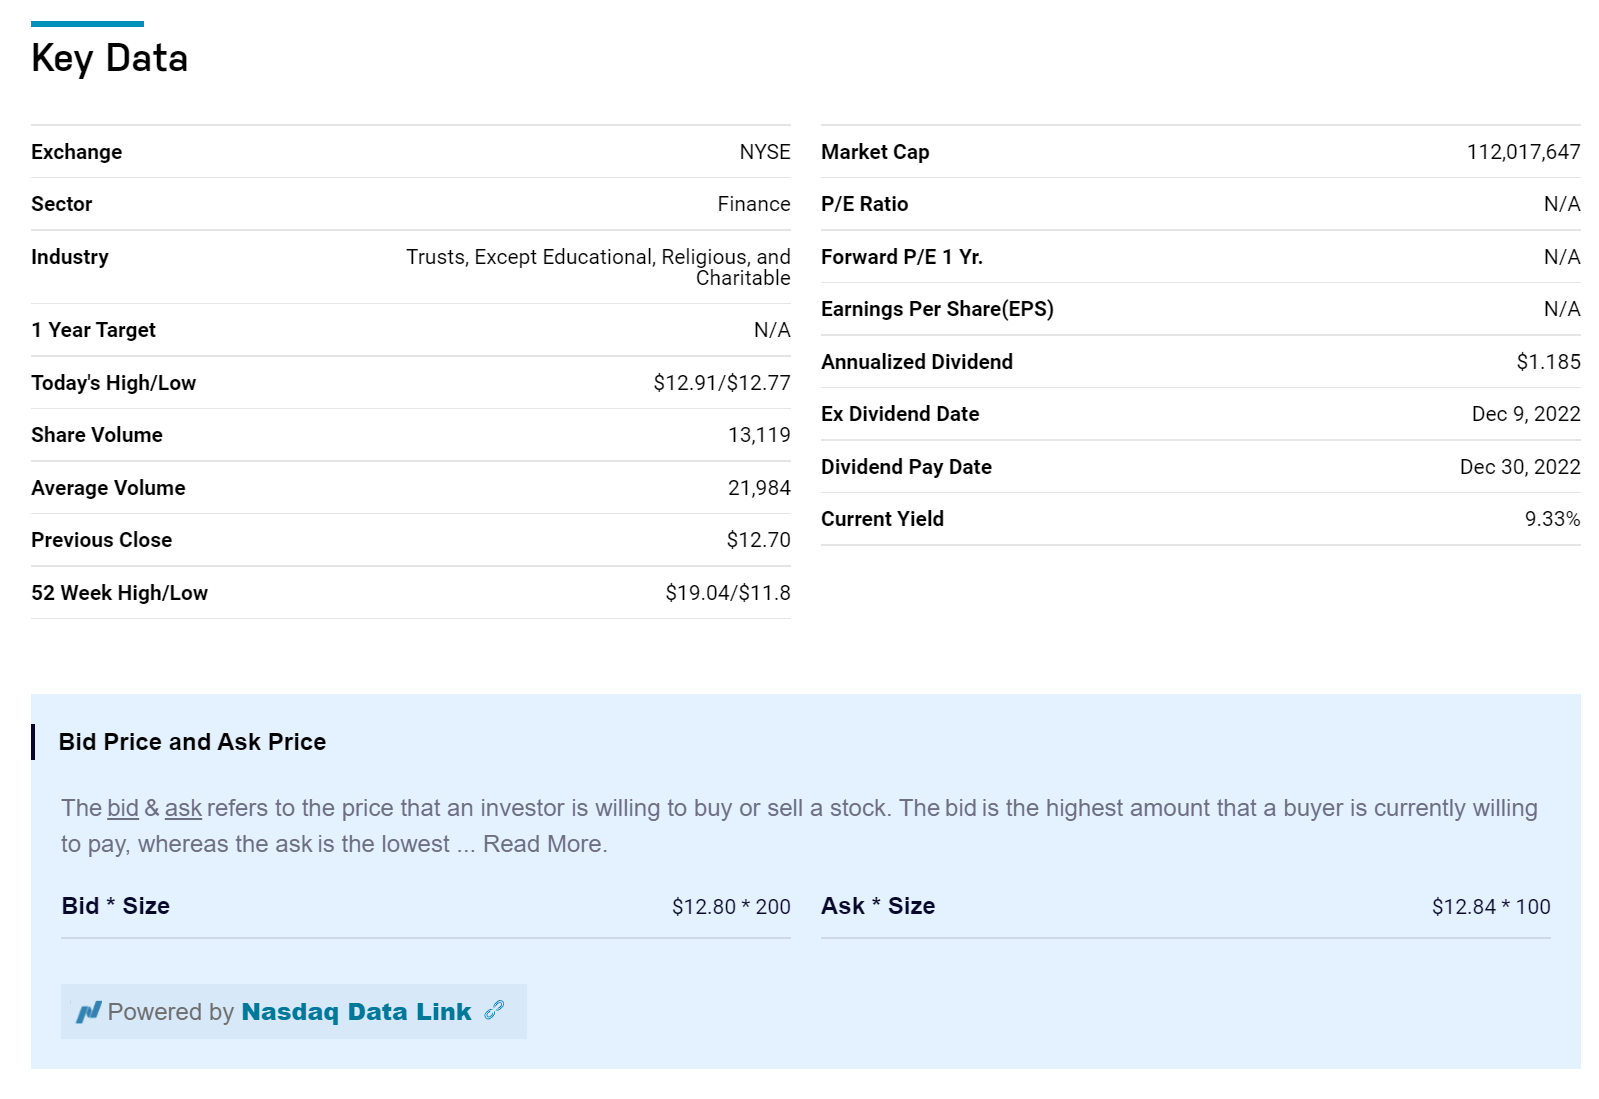
Investors should be careful with smaller funds, as its trading liquidity will be lower. The JHI fund has average trading volume of ~22,000 shares, or only ~$280,000 (Figure 2).
Figure 2 - JHI has low liquidity (nasdaq.com)
Portfolio Holdings
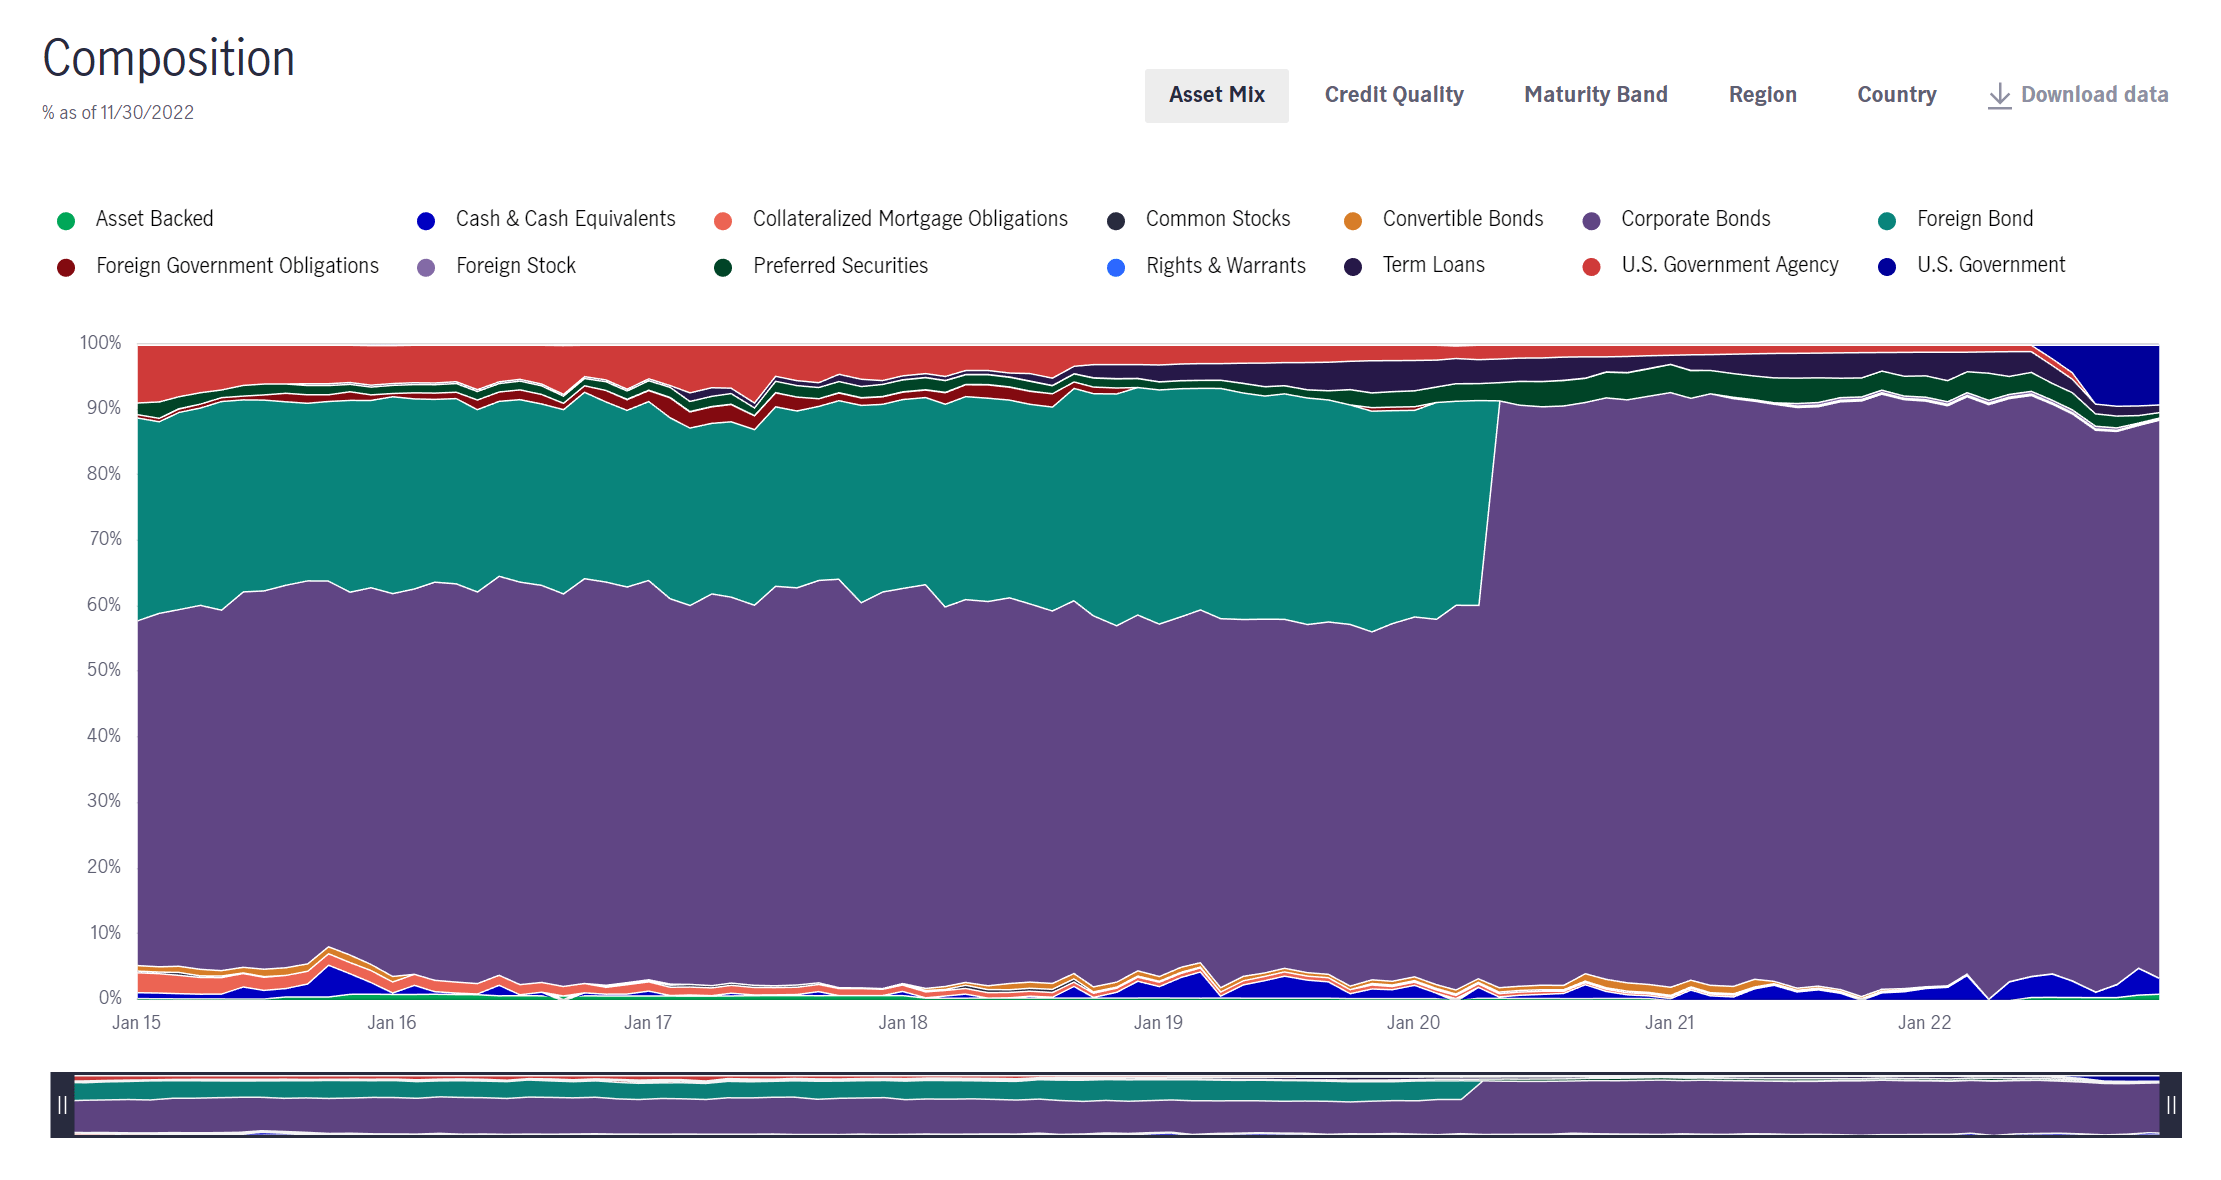
The JHI fund holds 266 positions in its portfolio with an effective duration of 3.6 years. As of November 30, 2022, 85% of the fund was invested in corporate bonds, and 9% was in U.S. treasuries. Historically, the fund was about 1/3 invested in foreign bonds, but that exposure was switched corporate bonds in early 2020 (Figure 3).
Figure 3 - JHI historical asset allocation (jhinvestments.com)
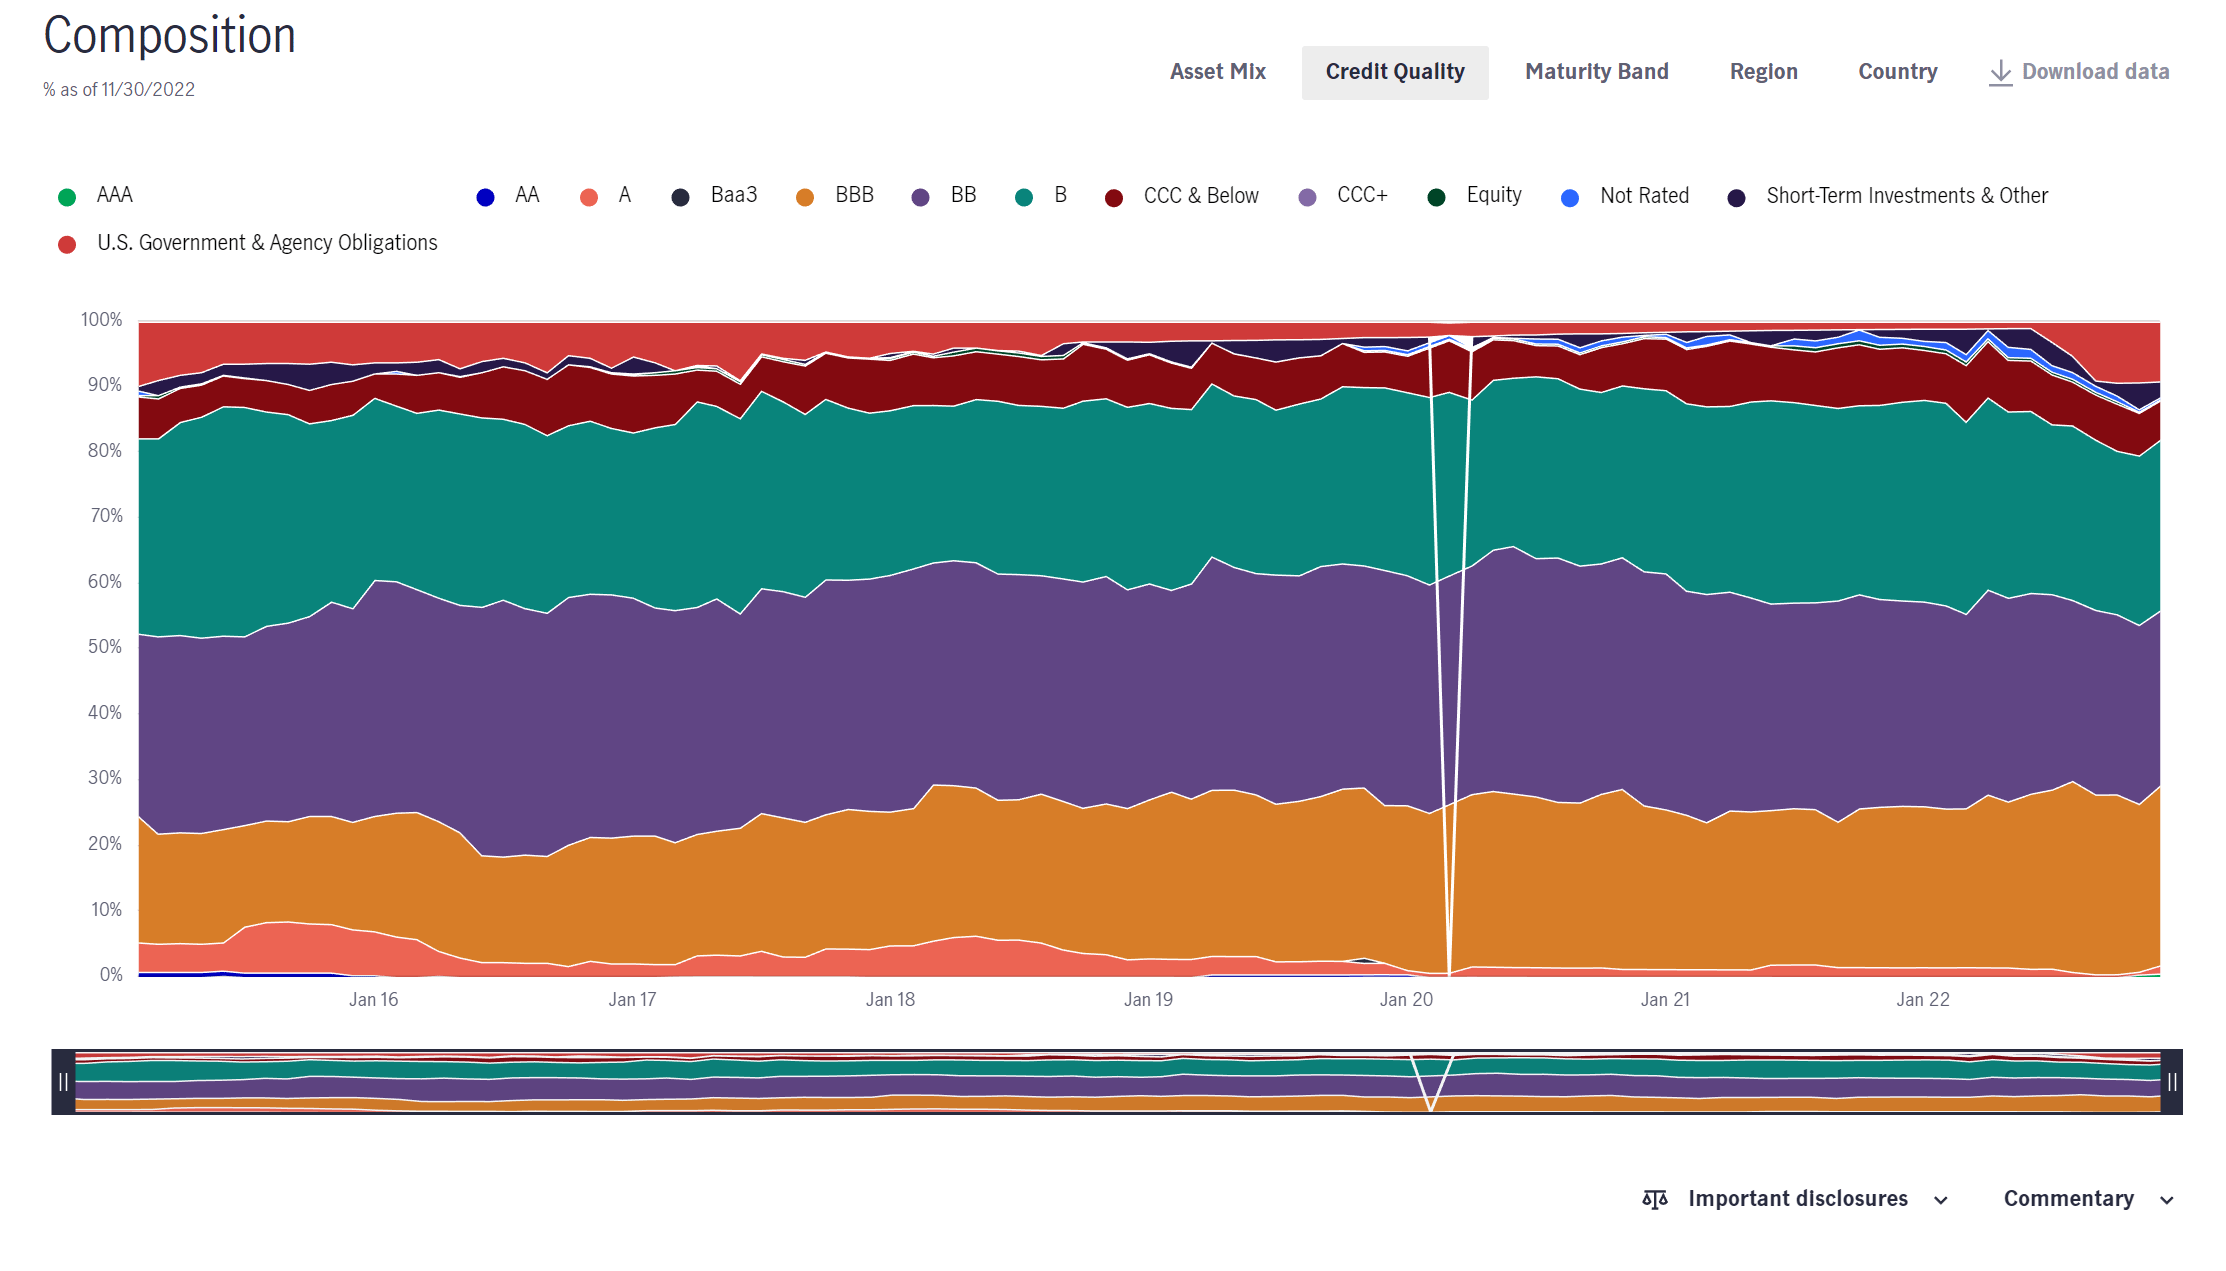
Figure 4 shows the JHI fund's latest credit quality allocation. 29% of the portfolio is investment grade (BBB or better), 9% is U.S. treasuries, and 59% is non-investment grade or unrated.
Figure 4 - JHI credit quality (jhinvestments.com)
Returns
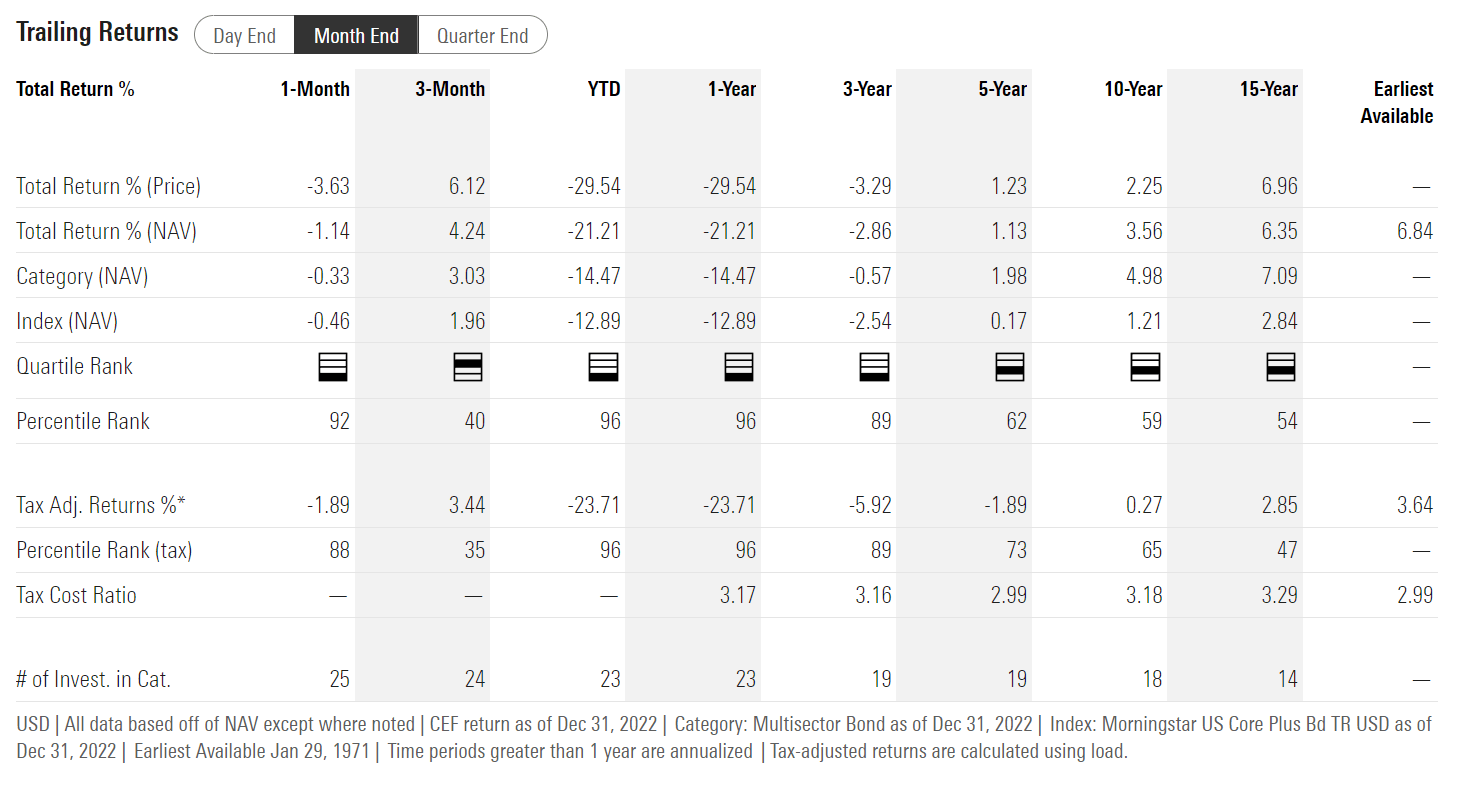
Figure 5 shows the JHI fund's historical returns. 2022 was a bad year, with the fund returning -21.2%. This dragged down the medium-term return figures, with 3Yr and 5Yr average annual returns of -2.9% and 1.1% respectively. Longer term 10Yr and 15Yr returns are modest at 3.6% and 6.4%.
Figure 5 - JHI historical returns (morningstar.com)
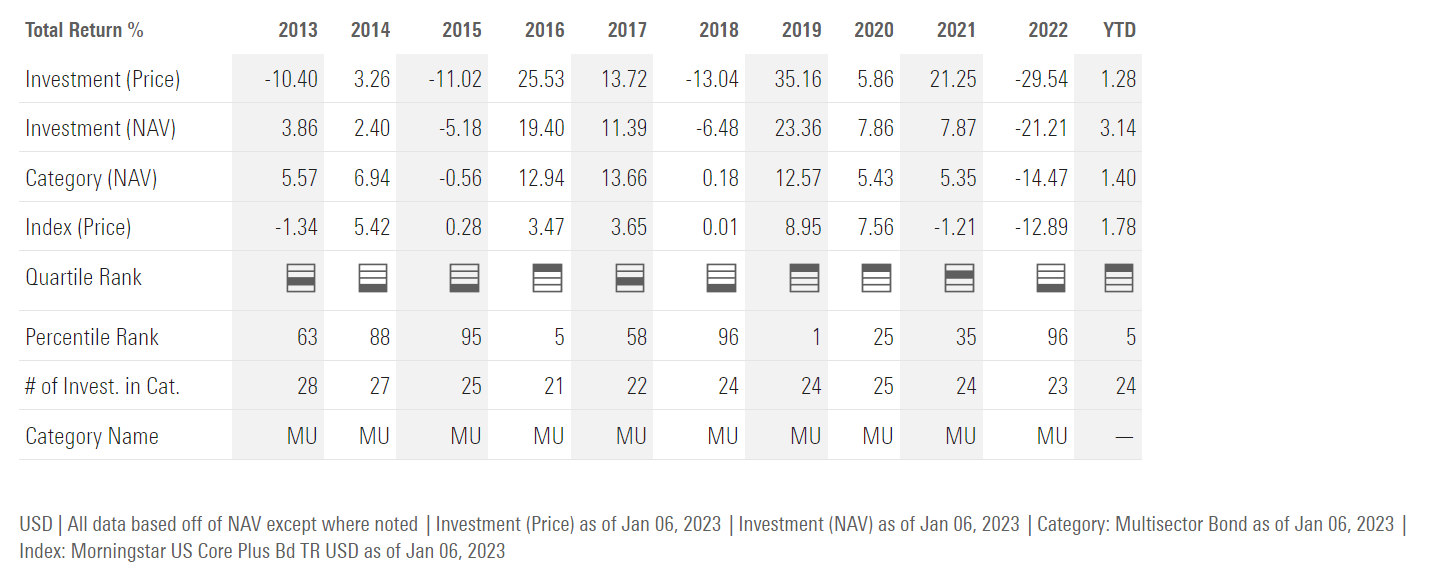
On an annual basis, we see JHI's returns have been quite volatile, from 23.4% in 2019 to -21.2% in 2022 (Figure 6).
Figure 6 - JHI annual returns (morningstar.com)
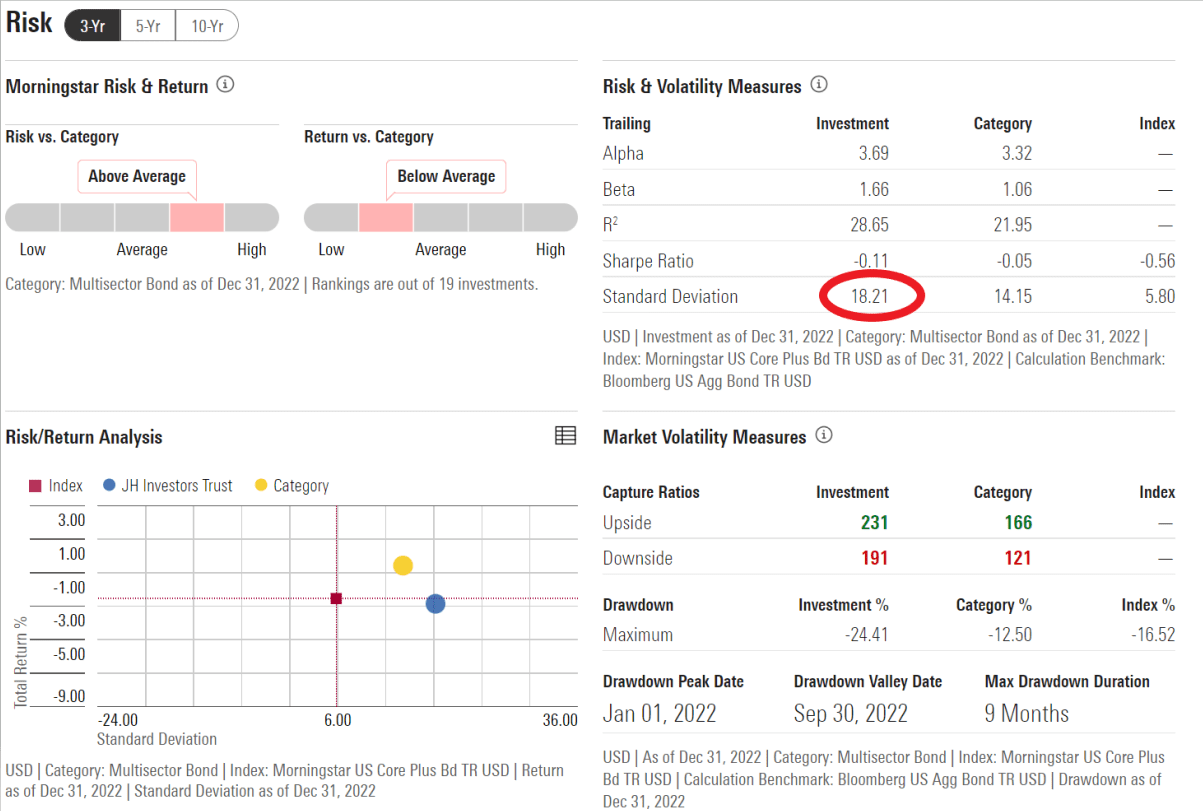
In fact, JHI's 3Yr volatility of 18.2% is quite elevated for a fixed-income fund. Compared to the Multisector Bond category in Morningstar, JHI has higher volatility and lower average returns (Figure 7).
Figure 7 - JHI has higher volatility and lower returns than peers (morningstar.com)
Distribution & Yield
The JHI fund pays a quarterly distribution that amounted to $1.18 in the trailing 12 months. This equates to a current yield of 9.3% of market price or 8.6% of NAV.
Investors should note that JHI's distribution has been slightly higher than its net investment income ("NII") in the past 5 fiscal years. The difference would have been funded by capital gains (if any) and / or return of capital (Figure 8).
Figure 8 - JHI financial summary (JHI 2022 annual report)
Return Of Principal Fund
Given JHI's high distribution rate (9.3% current yield) but mediocre total returns (10Yr average annual returns of 3.6%), I am concerned the JHI fund shows all the hallmarks of a 'return of principal' fund, where it does not earn its distribution.
Note this is different from 'return of capital' ("ROC"), which is a tax accounting concept. The following quote is from an Eaton Vance whitepaper titled ' Return of Capital Demystified ' that unfortunately is no longer available after I recently pointed out that the Eaton Vance Short Duration Diversified Income Fund ( EVG ) exhibited 'return of principal' characteristics:
The best measure of whether a fund has earned its distributions is the change in its NAV net of distributions. Regardless of how distributions are characterized, if a fund's NAV increases, the fund earned its distribution. If not, the fund did not earn its distribution - the economic concept of return of principal
We can see the issue more clearly by looking at JHI's NAV and distribution over time. Since the early 2000s, JHI's NAV has declined from a peak of $22.37 in June 2003 to $13.79 currently(Figure 9).
Figure 9 - JHI historical NAV (morningstar.com)
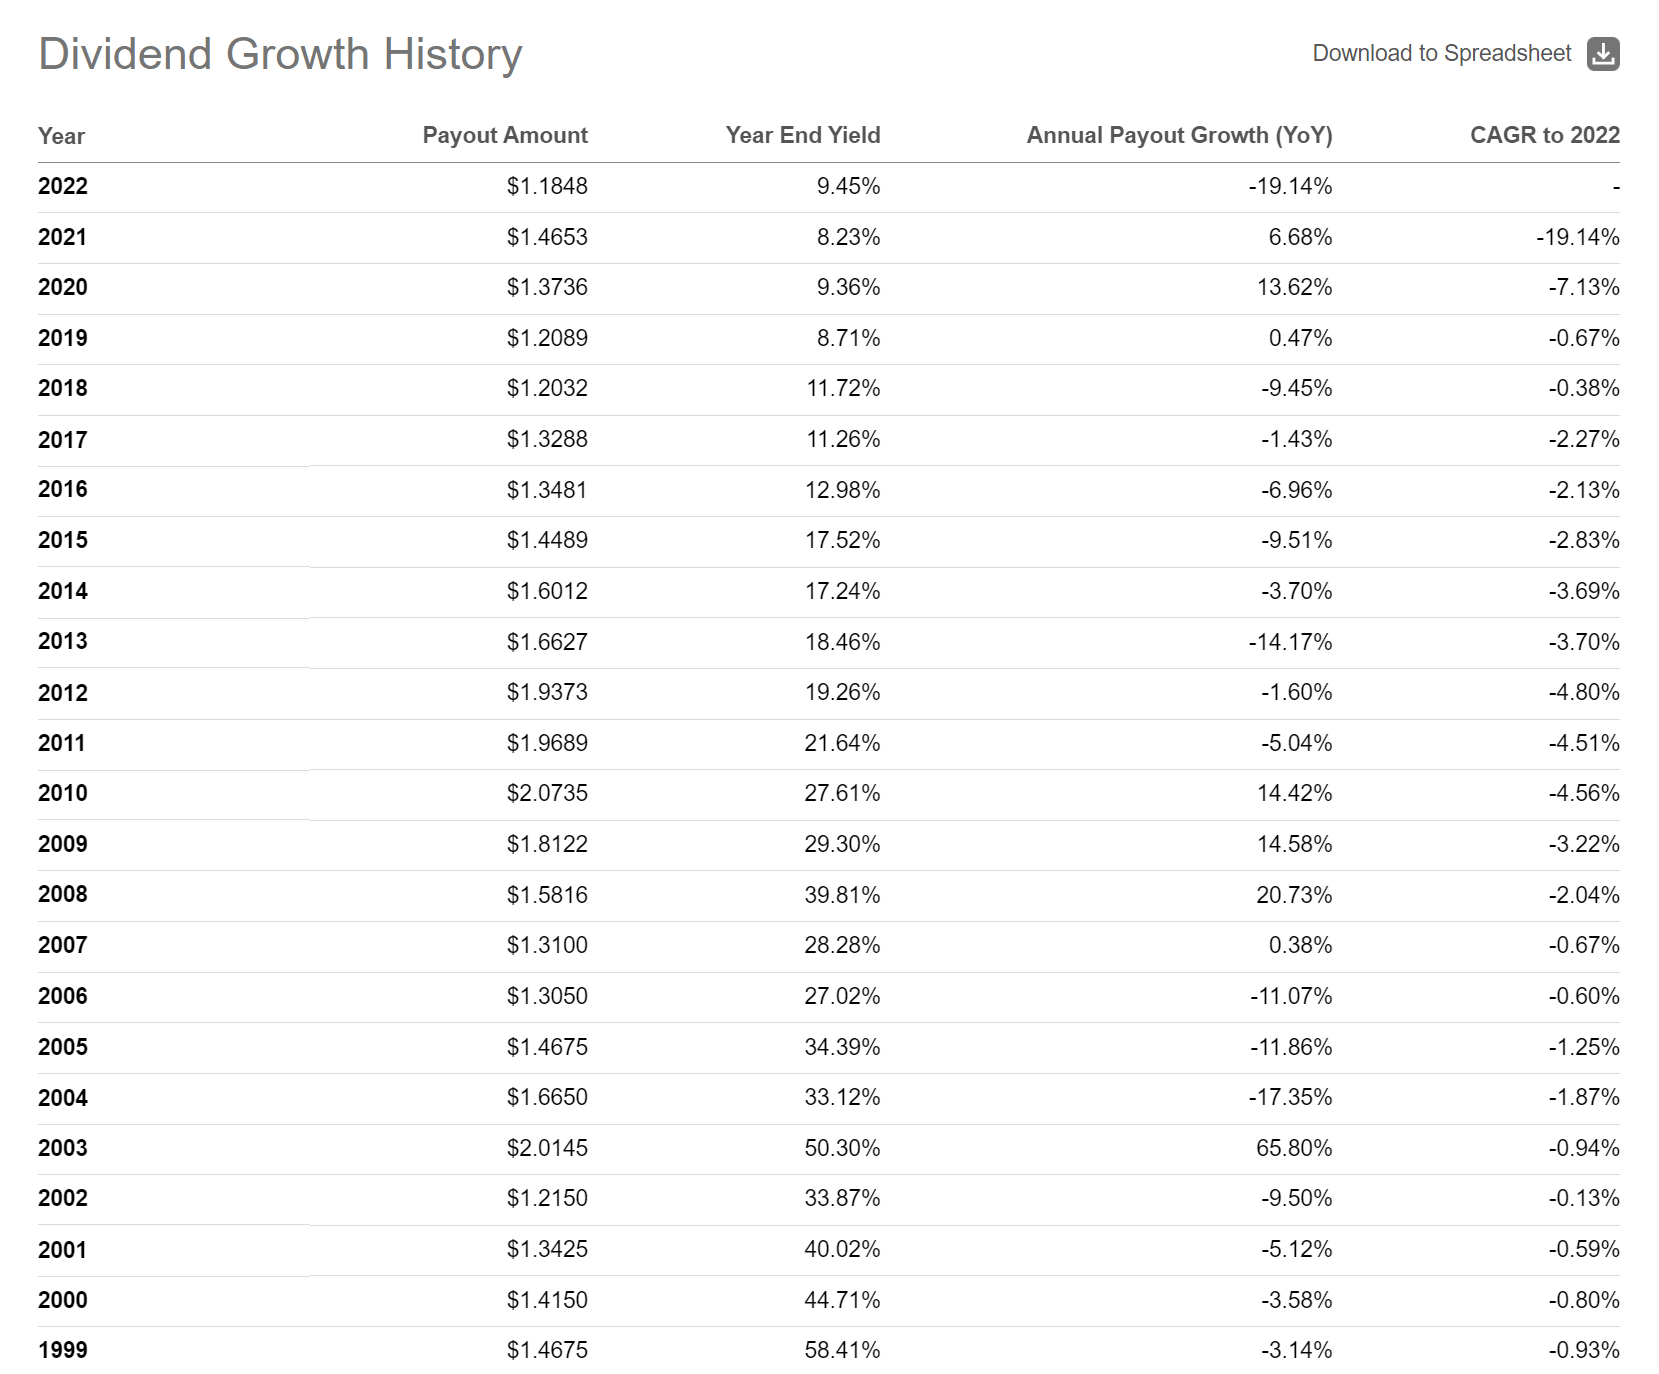
Similarly, the fund's annual distribution has shrunk from $2.01 in 2003 to $1.18 in 2022 (Figure 10). Long term investors would have seen both their principal and distribution shrink over the past 2 decades.
Figure 10 - JHI historical distributions (Seeking Alpha)
JHI vs. Junk Bond CEFs
Another way I like to analyze funds is to compare them to peer funds pursuing similar strategies (Figure 11). Comparing the JHI fund to its peer group of junk bond-focused CEFs, I find that the JHI has the worst annualized historical performance across all timeframes, as well as the worst risk metrics (highest volatility, lowest Sharpe Ratio). It is also expensive, with the 2nd highest expense ratio. Its only redeeming factor is its distribution yield, which is middle of the pack.
Figure 11 - JHI scores poorly against peer junk bond-focused CEFs (Author created with returns and risk data from Morningstar and fund details and distributions from Seeking Alpha)
Overall, I think investors looking for a junk bond-focused CEF would be better served to look at the PGIM High Yield Bond Fund ( ISD ) or the BlackRock Limited Duration Income Trust ( BLW ). I covered the two funds here and here .
Conclusion
In summary, the John Hancock Investors Trust is a junk bond-focused CEF that pays a high distribution yield of 9.3%. However, it has all the hallmarks of a return of principal fund, with shrinking NAV and distributions over time. Compared to peer funds, it has lower returns and higher volatility. I would avoid this fund.
For further details see:
JHI: A Classic Example Of A Return Of Principal Fund