JNUG - JNUG Could Explode If Gold Follows Through On The Upside
Summary
- Gold has been trending higher since the September 2022 low.
- The long-term bull market in gold is twenty-four years old.
- Gold mining shares tend to leverage percentage moves in the metal - Junior miners can provide even more gearing.
- GDXJ’s price action from March 2020 to August 2020 is an example of an explosive move in gold, gold mining shares, and junior gold mining shares.
- JNUG is a leveraged diversified junior gold mining ETF that turbocharges the GDXJ ETF - JNUG requires a price and time risk-reward dynamic, as timing is everything when using leverage.
Gold reached a nominal record high in March 2022, when the price rose to $2,072 per ounce. Bull markets rarely move in straight lines, and the rally ran out of upside steam, leading to a decline to $1,613 six months later in September 2022, a 22.2% correction. Meanwhile, the considerable reduction did little to negate the long-term bull market that began at $252.50 in 1999 when the Bank of England sold half the U.K.'s gold reserves via a public auction.
Few, if any, central banks or governments followed the U.K.'s lead, even though London is the international gold market's hub. According to the World Gold Council , annual gold demand increased by 18% in 2022 to 4,741 metric tons, excluding over-the-counter trading. The rise was the highest since 2011, fueled by Q4 demand of 1,337 tons. Meanwhile, the most significant factor was the 1,136 tons purchased by central banks, a fifty-five-year high for official sector demand.
Gold's bull market may be almost a quarter-of-a-century old, but it remains intact. In early 2023, gold has been trending higher, and another higher high could be on the horizon. With inflation at the highest level since the 1980s, the U.S. national debt at $31.5 trillion and growing, and the bifurcation between the world's nuclear powers with the " Doomsday Clock " recently moved to 90 seconds to midnight, the case for higher gold prices is compelling. When technical and fundamental factors fall in line, the results can be explosive, and gold has support from both in early 2023.
The Direxion Daily Junior Gold Miners Bull 2x Shares product ( JNUG ) is a short-term trading tool that turbocharges the VanEck Junior Gold Miners ETF ( GDXJ ). If gold is preparing for an explosive move higher, JNUG would likely outperform the percentage gains in the metal, GDX senior gold mining ETF, and GDXJ. However, JNUG is only appropriate for short-term positions as its leverage comes with time decay risk.
A bullish trend in gold over the past months
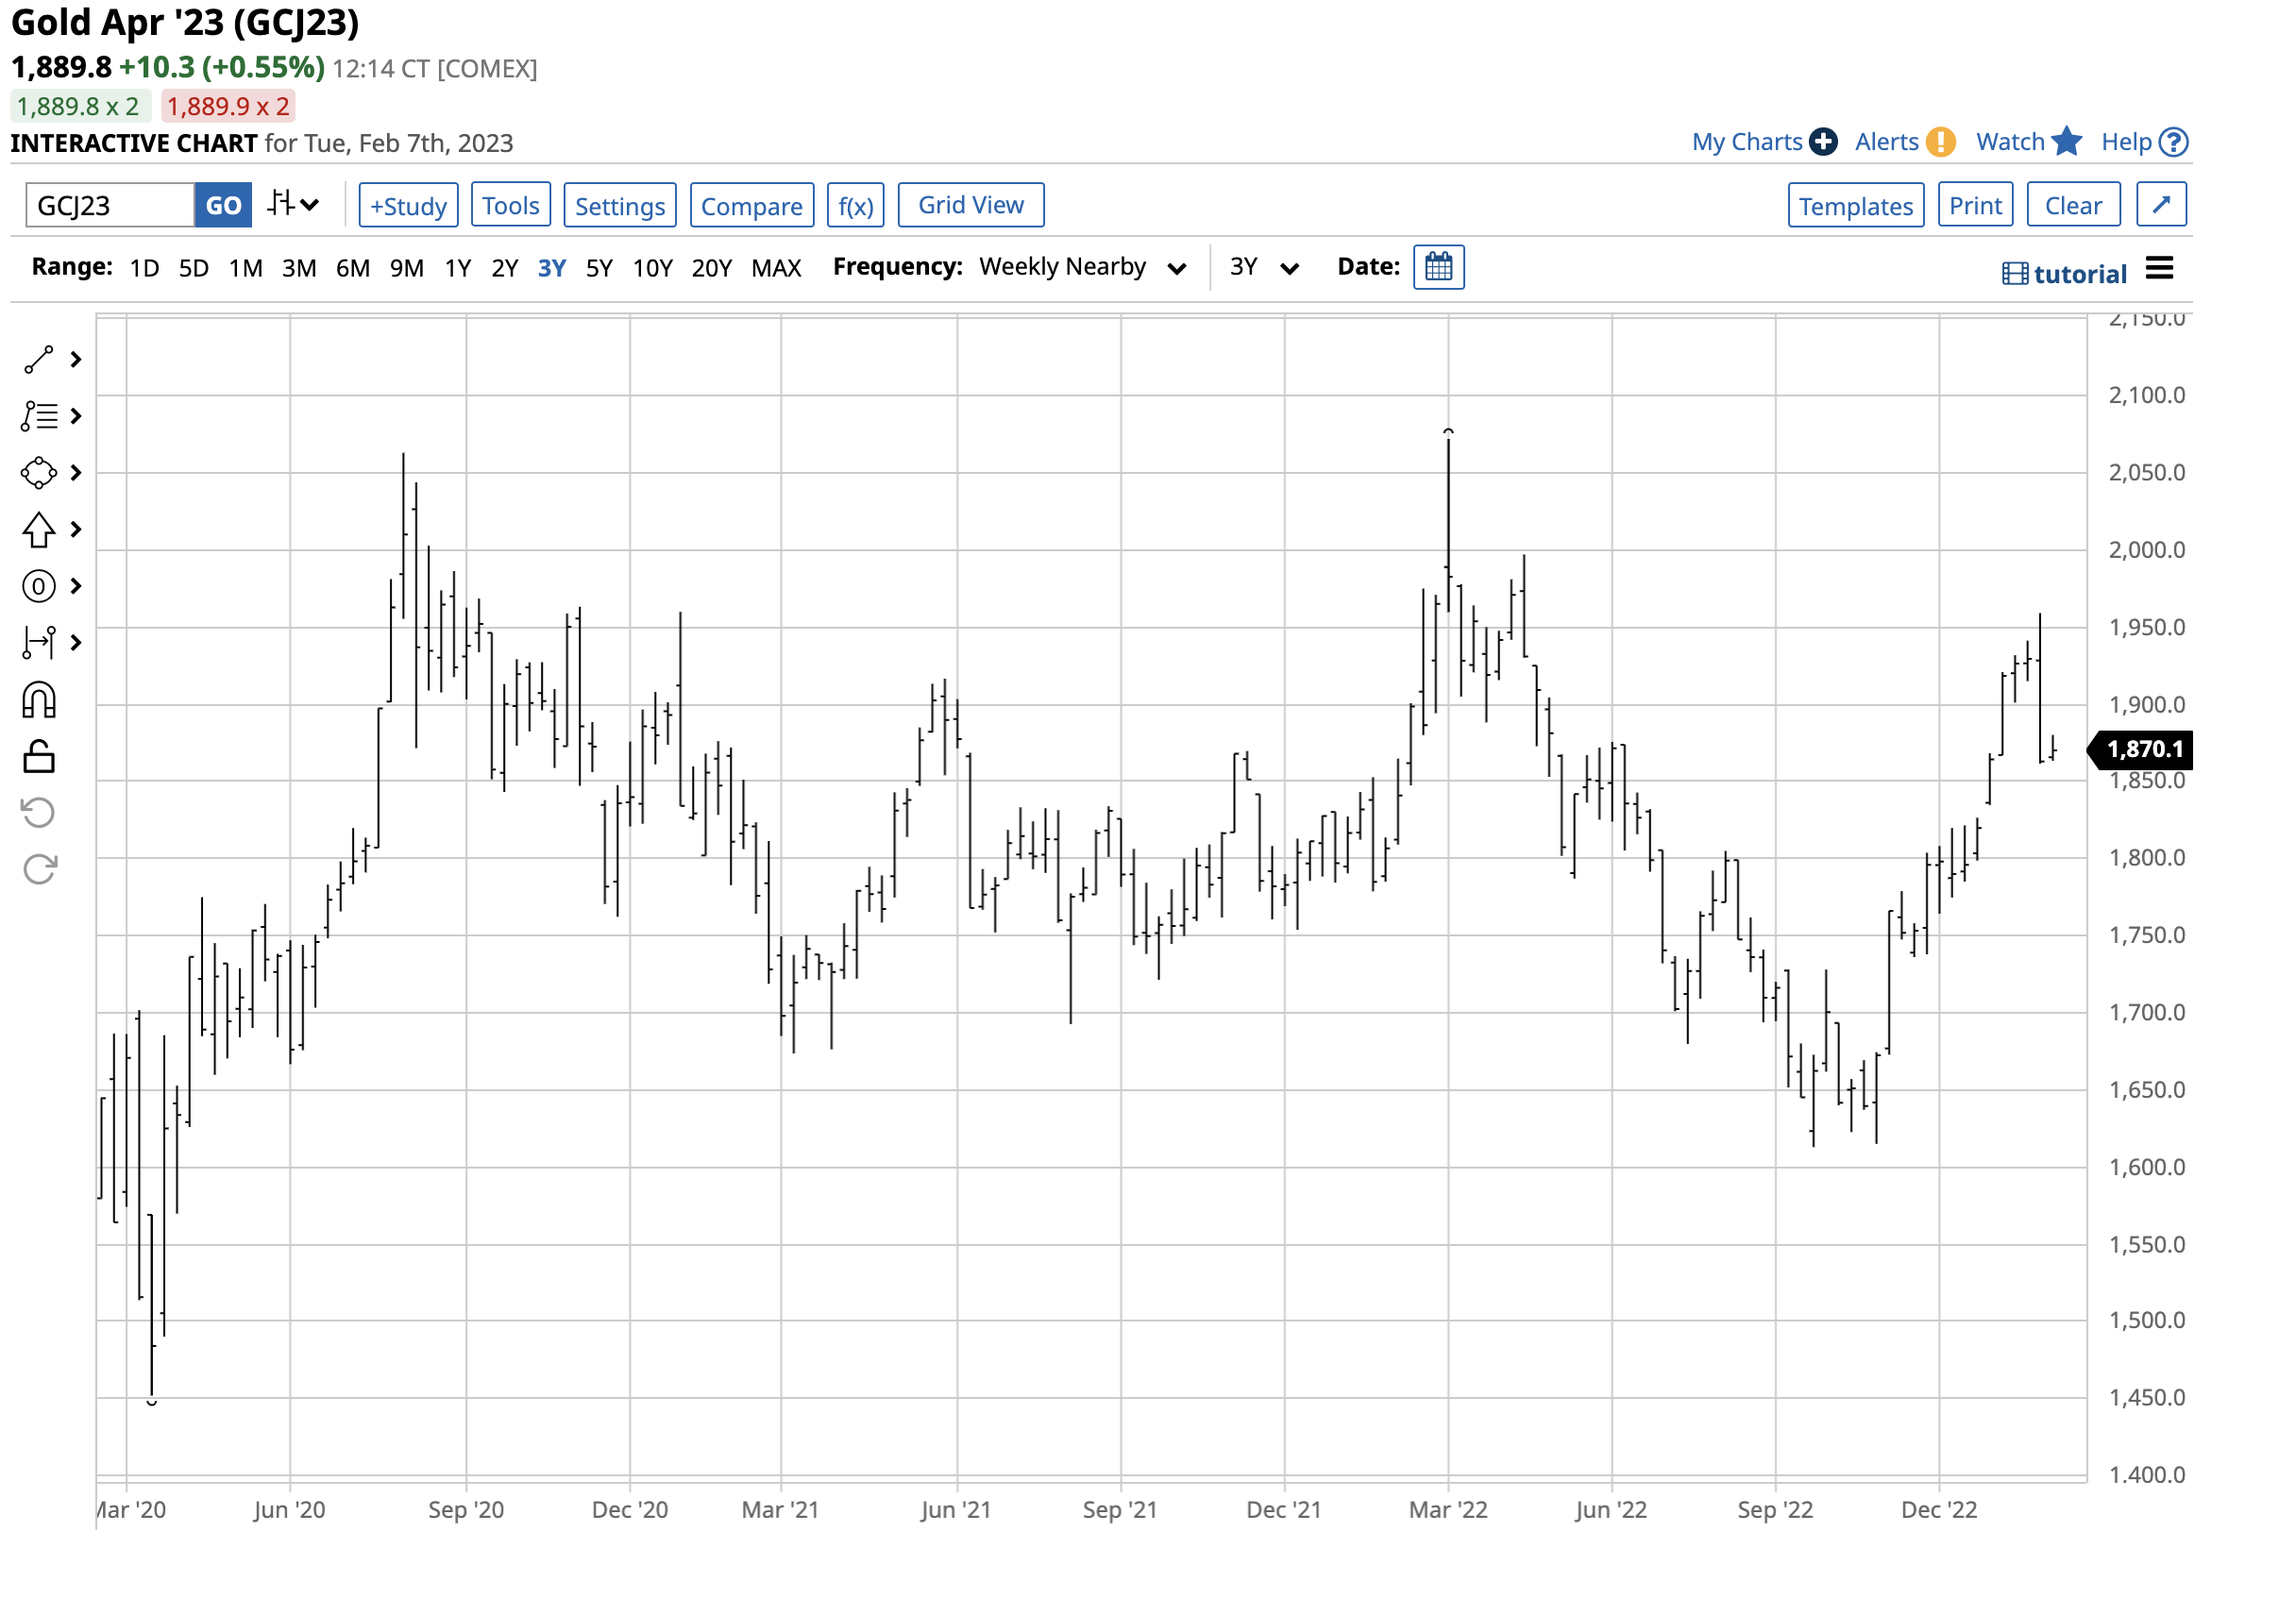
Nearby COMEX gold futures reached a low of $1,613 in late September 2022. The low in gold coincided with the two-decade high in the dollar index and came as the U.S. 30-Year Treasury bond futures were on the way to the lowest level since February 2011. A strong dollar and rising interest rates tend to weigh on gold prices as higher rates increase the cost of carrying long gold positions. Gold contango, or its forward premium, tends to increase with interest rates, making it more expensive to hold long positions. It encourages producers to hedge their output by selling for future delivery at higher prices.
A rising dollar causes gold to appreciate in other currency terms. The dollar reached its high in September 2022, the bonds their low in October 2022, and gold found a bottom after declining 22.2%.
Chart of April COMEX Gold Futures (Barchart)
The chart highlights gold's recovery that took the nearby futures price 20.96% higher to $1,951.10 on February 2. The active month April contract appreciated 19.88%, moving from $1,647.70 to $1,975.20.
Bull markets rarely move in straight lines, and gold ran out of upside steam in early February. The U.S. Fed hiked the short-term Fed Funds Rate by 25 basis points at the February FOMC meeting, and the Bank of England and European Central Bank followed with 50-point interest rate increases, which likely pushed gold lower. April futures were trading at the $1,890 level on February 7, with the continuous contract at $1,870, 4.3%, and 4.2% corrections from the most recent highs.
A long-term bullish trend
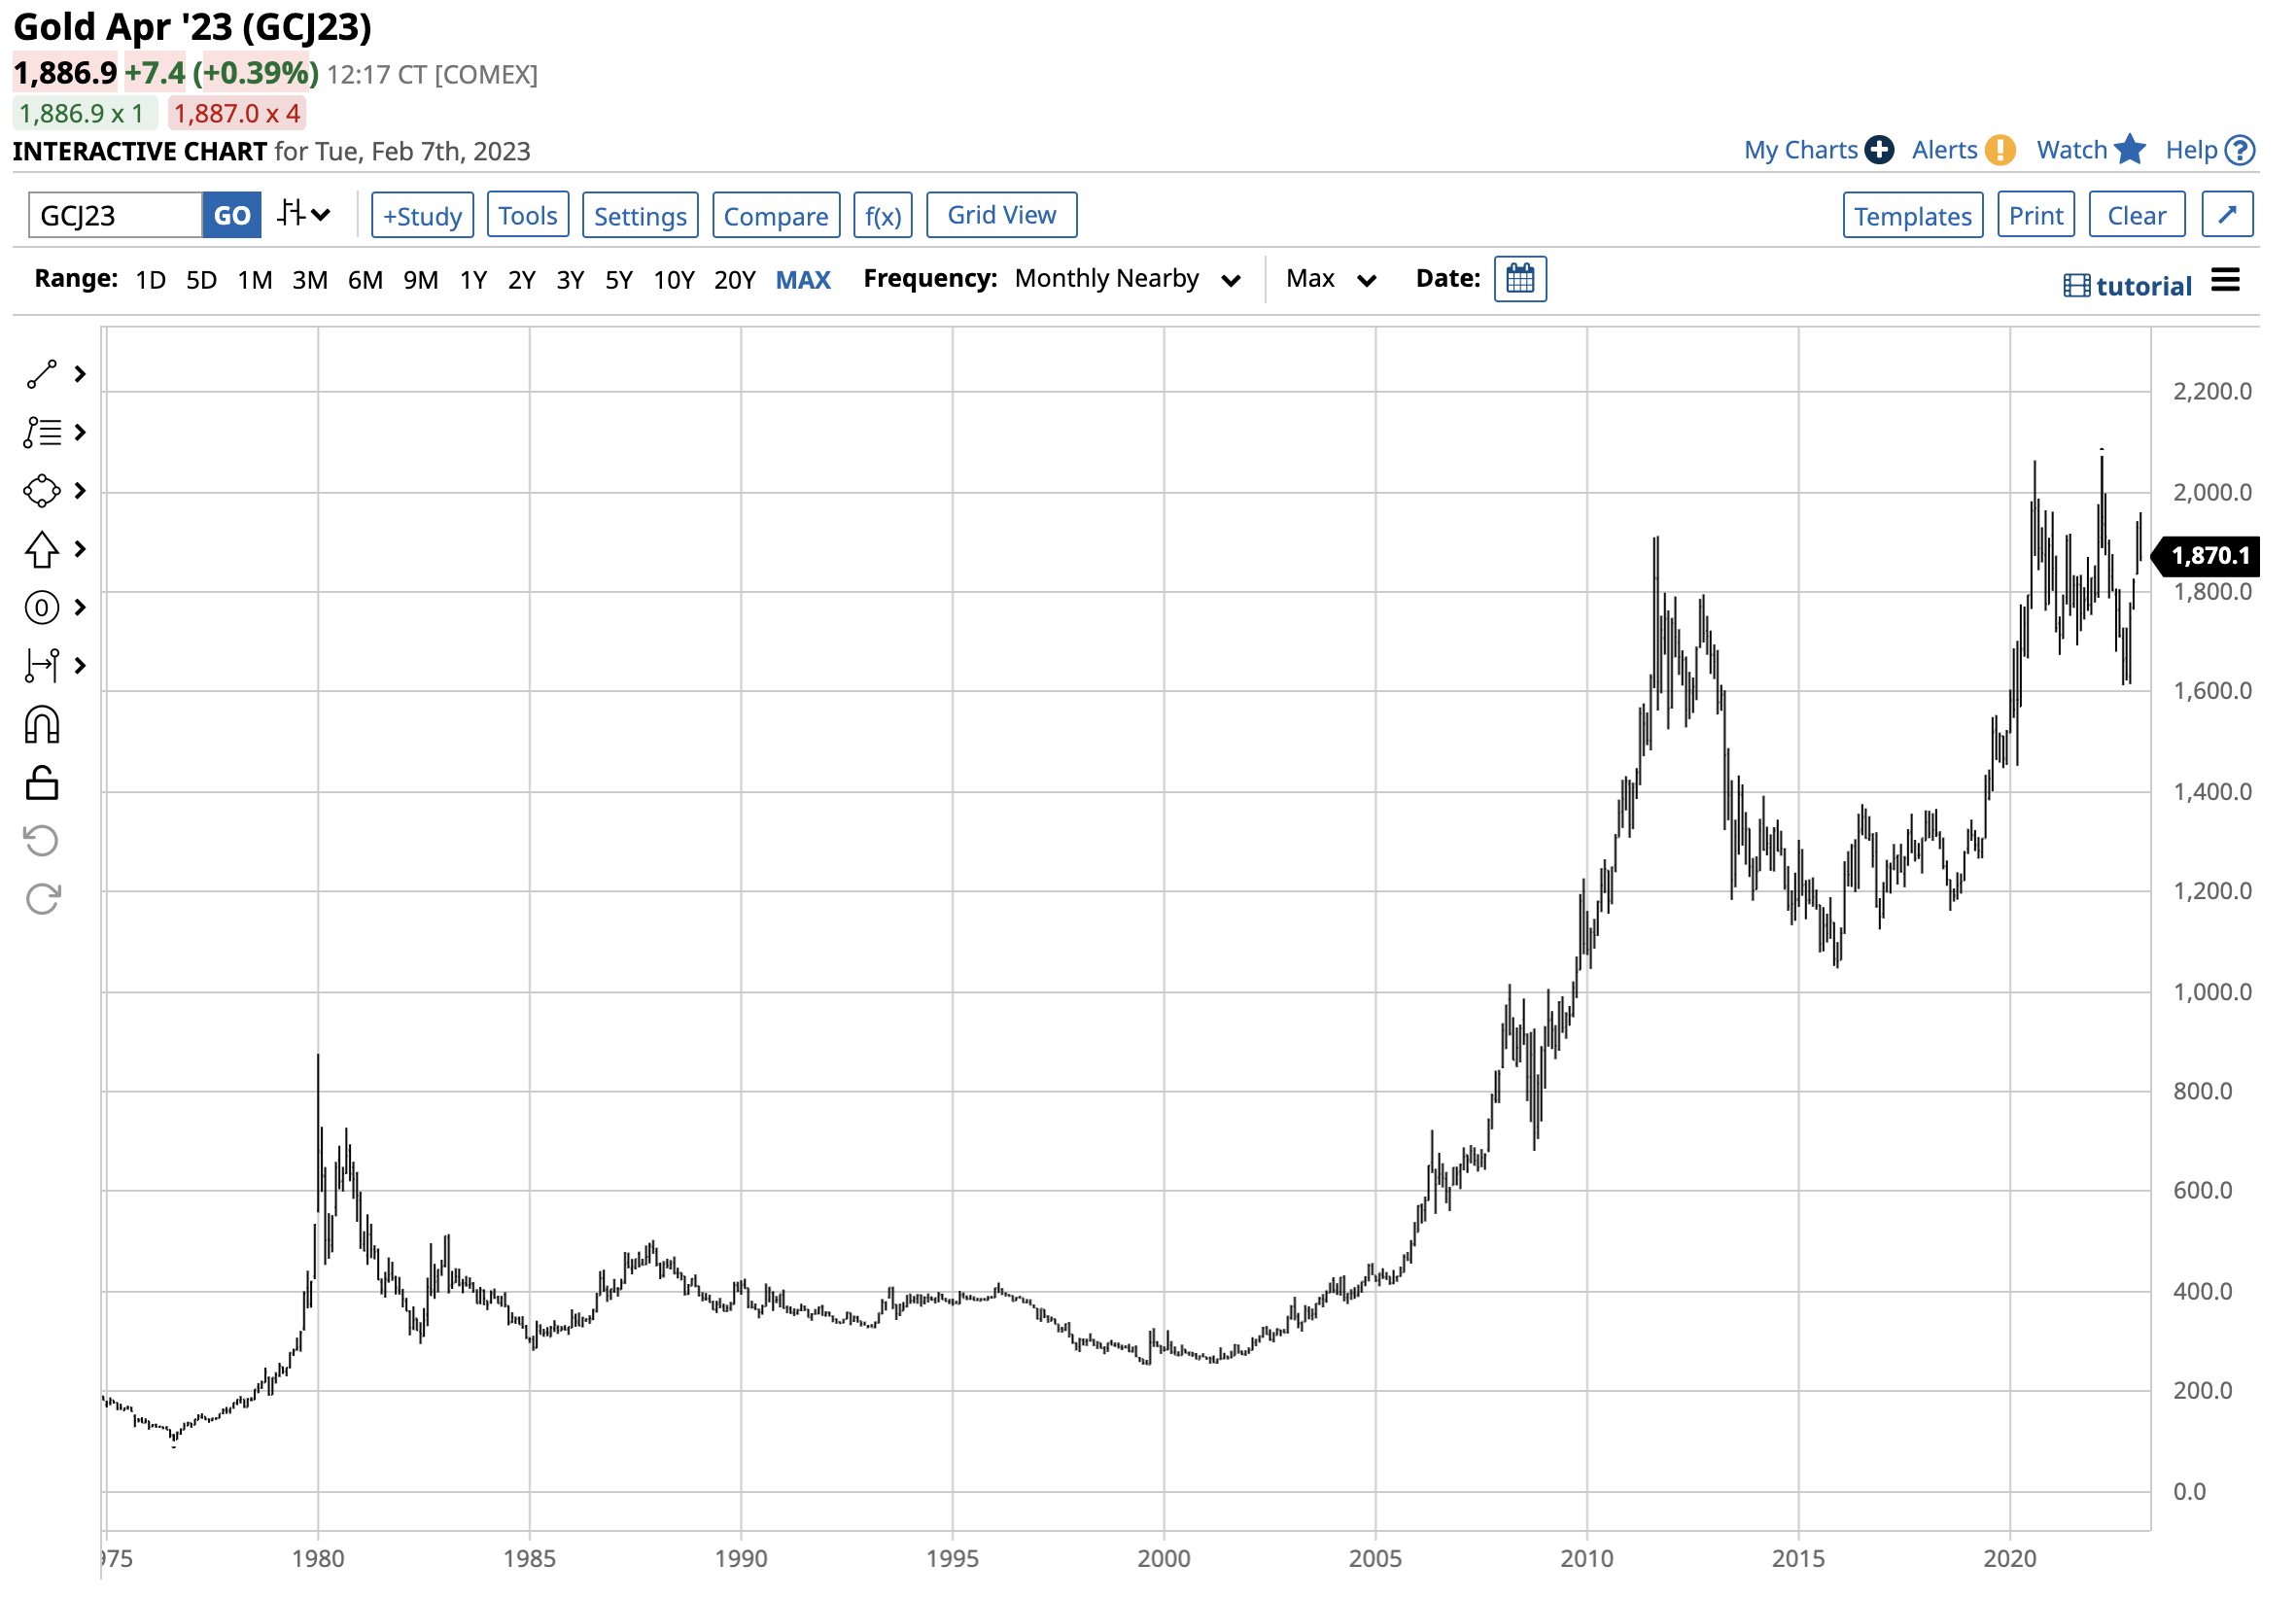
Gold may have run out of upside steam below the $2,000 level in early February, but the latest correction and the decline from the March 2022 high to the September 2022 low did nothing to threaten the precious metal's long-term bullish trend.
Long-Term COMEX Gold Futures Chart (Barchart)
The chart dating back to the mid-1970s shows the pattern of higher lows and higher highs since 1999 when gold's price reached rock bottom at $252.50 per ounce. Critical technical support for the long-term bull market stands at the August 2018 $1,161.40 low and the December 2015 $1,046.20 bottom. Gold has not ventured below $1,000 per ounce in nearly a decade and a half since October 2009, and the bull market is approaching a quarter of a century in 2023.
Gold mining shares
Gold mining companies invest substantial capital in extracting the metal from the earth's crust to sell it at prices above the total production costs. Therefore, a rising gold price tends to cause mining shares to outperform the metal on a percentage basis on the upside and underperform when the gold price declines.
Junior gold mining companies explore for gold and tend to experience even more price variance than the senior gold-producing shares.
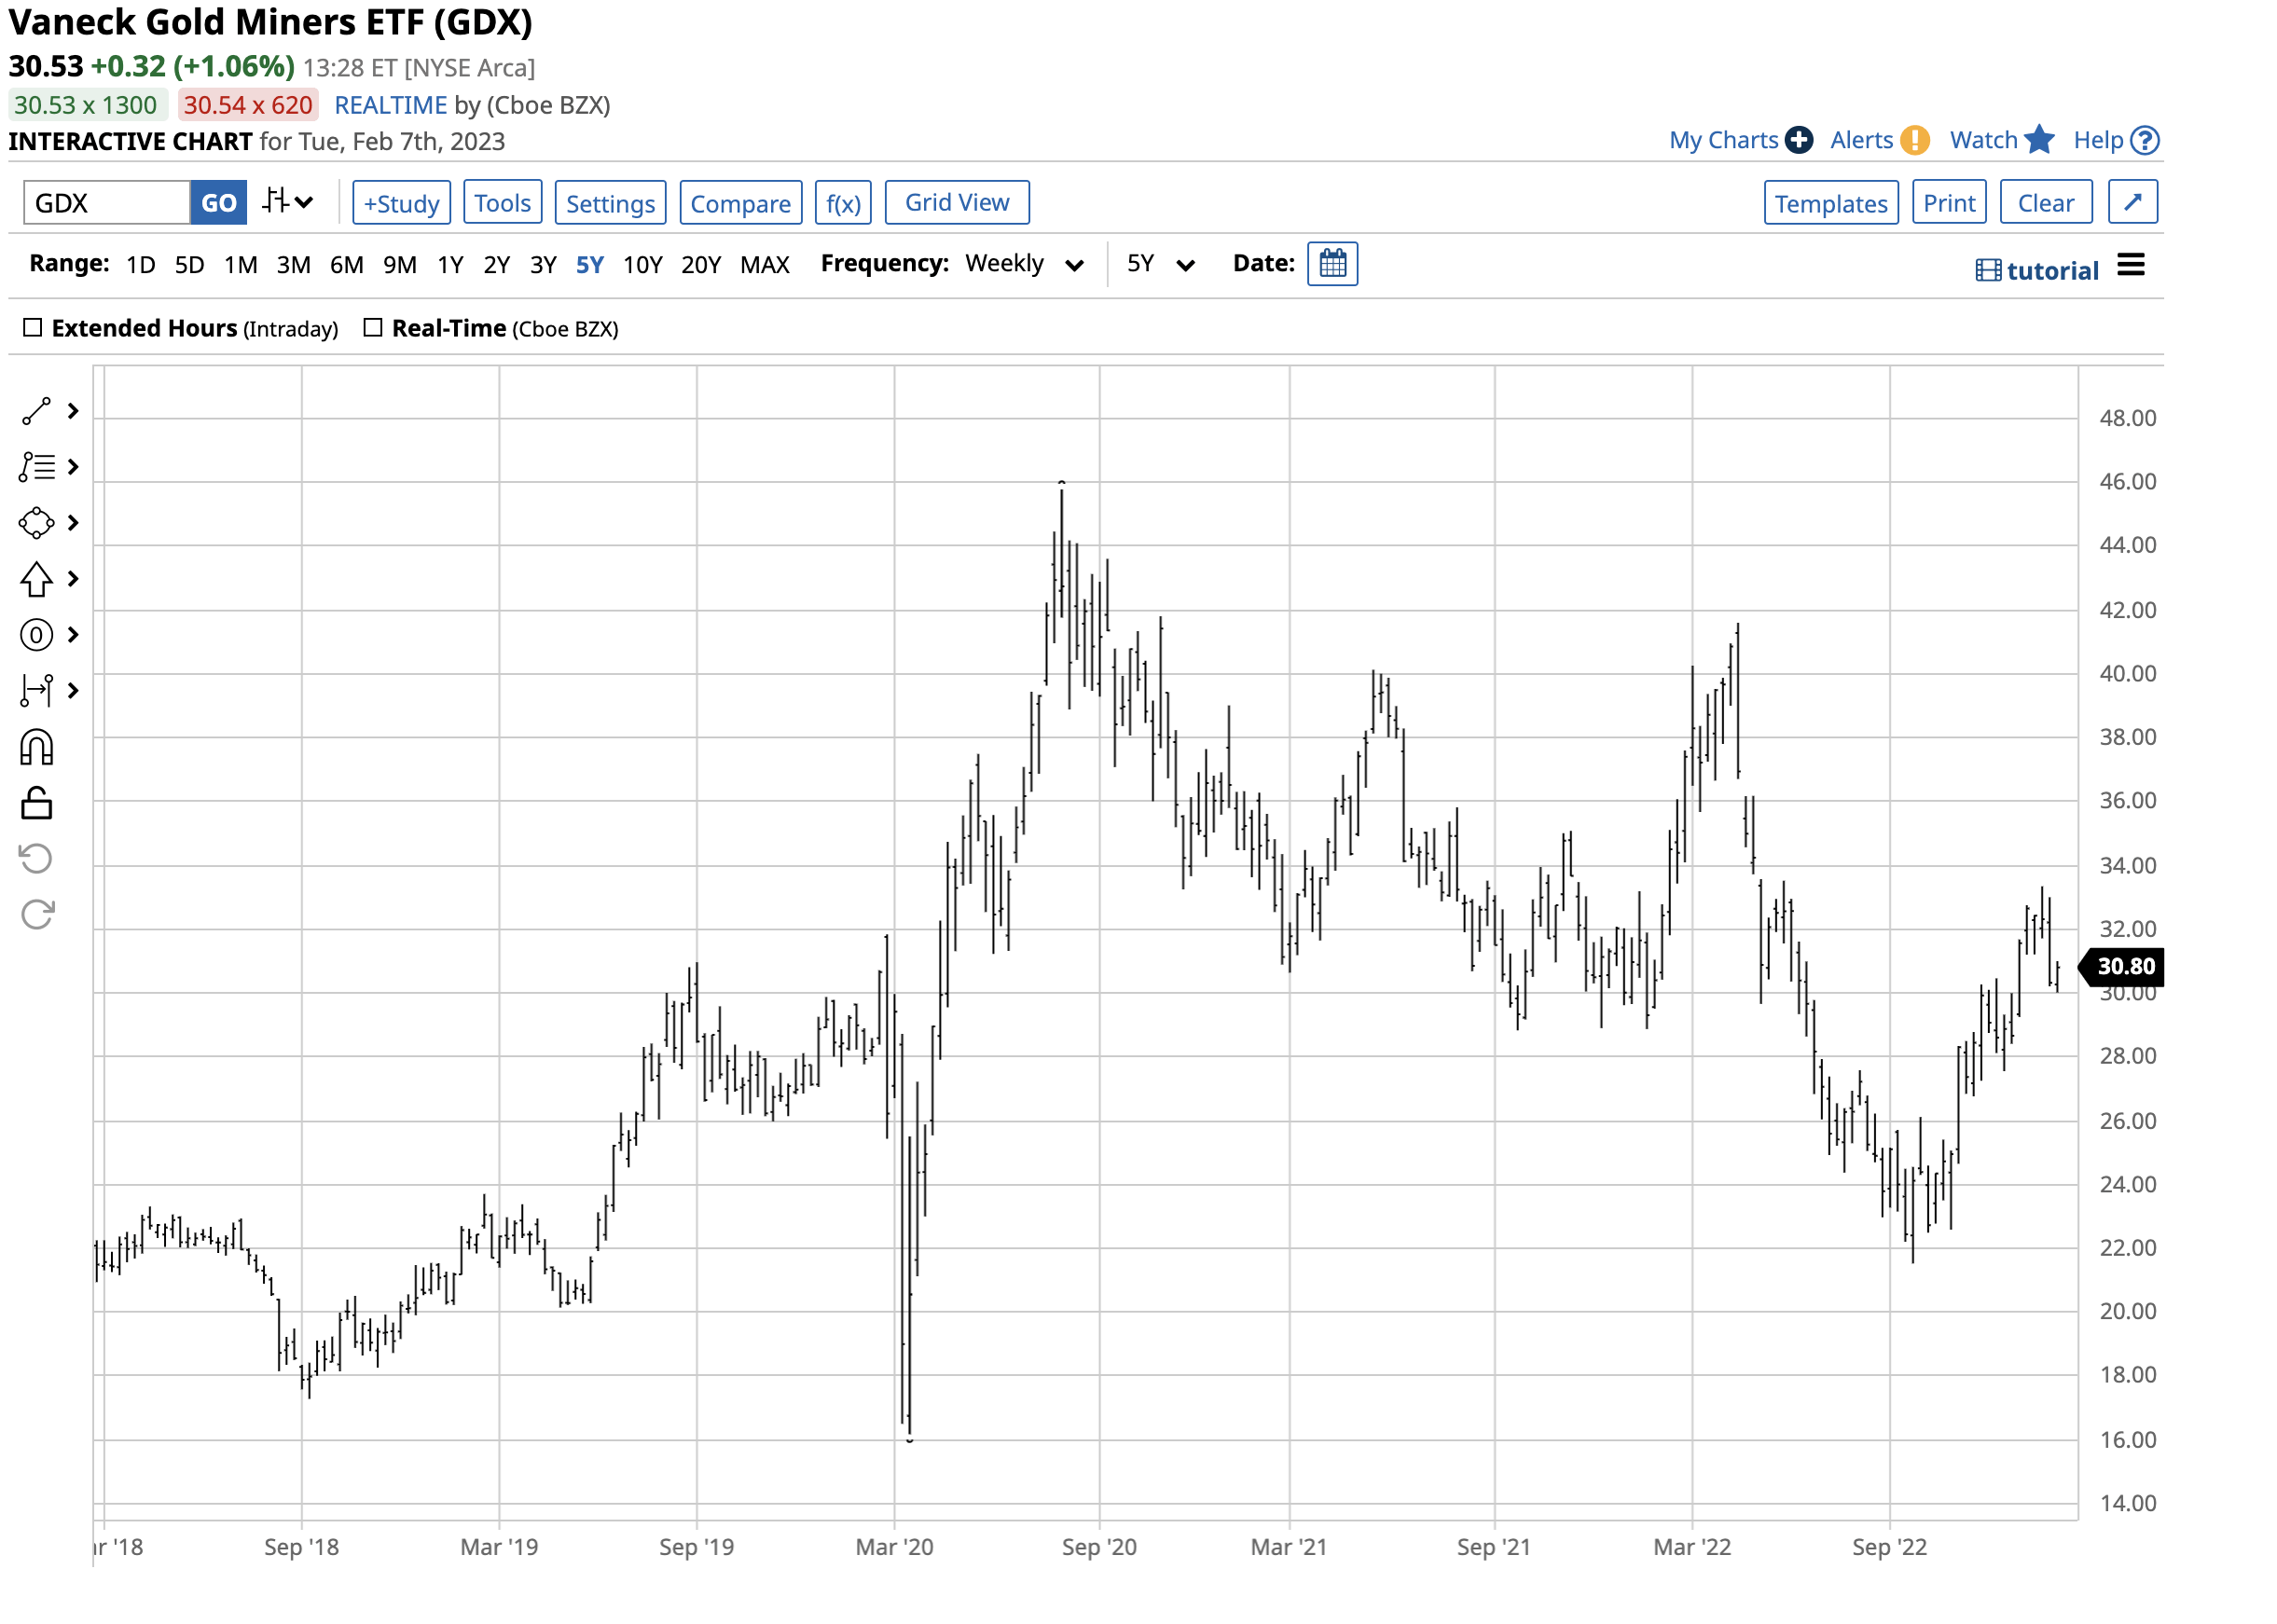
The most dramatic example of the producer's and exploration company's leverage came in 2020 as the global pandemic gripped markets across all asset classes, and a substantial rally followed the lows. Nearby COMEX gold futures fell to $1,452.10 in March 2020 and rose to $2,063 per ounce five months later in August 2020, a 42.07% increase.
Chart of the GDX Senior Gold Mining Share ETF Product (Barchart)
Over the same period, GDX, an ETF that owns shares of the leading senior gold mining companies, rallied from $16.18 to $45.78 per share or 182.9%, far outperforming gold on a percentage basis.
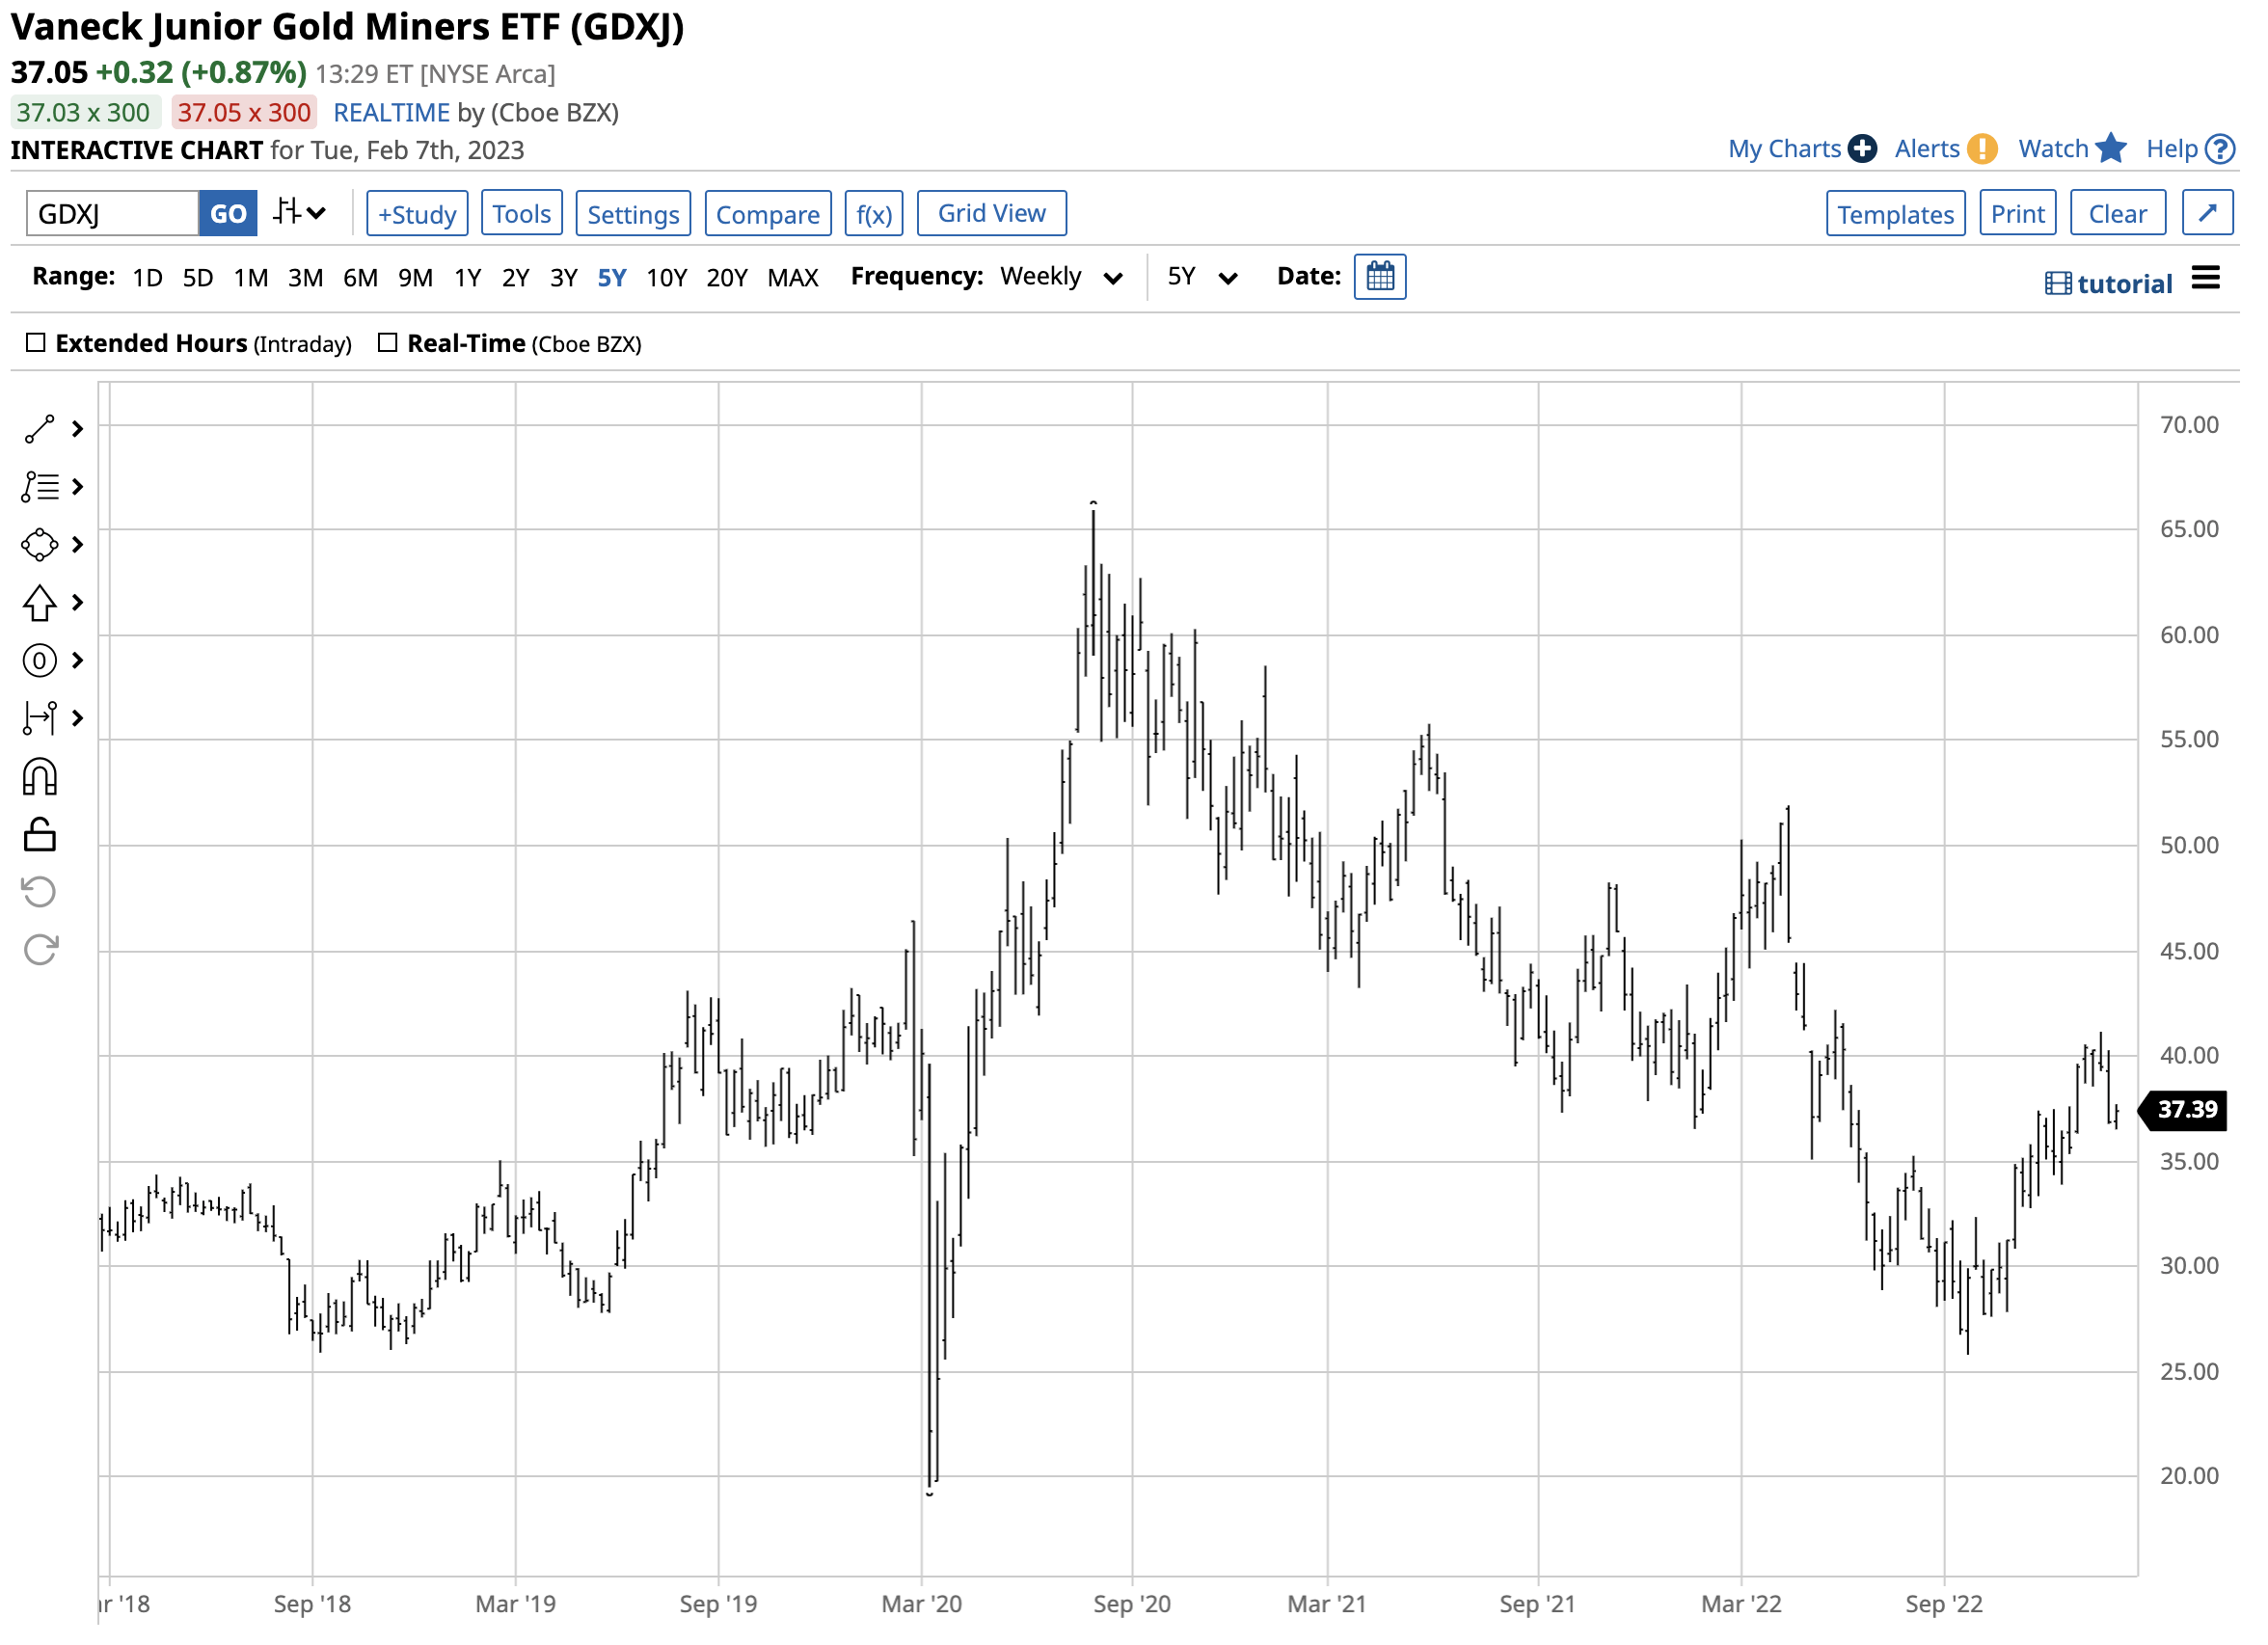
Chart of the GDXJ Junior Gold Mining Share ETF Product (Barchart)
GDXJ, the ETF that owns a portfolio of the leading junior gold mining companies, did even better from the 2020 low to the year's high, rising from $19.52 to $65.95 per share or 237.9%.
Historical price action highlights miner share's leverage
For two reasons, the junior gold mining shares outperformed gold and the senior gold mining shares during the 2020 rally. First, the juniors attracted lots of speculative interest as gold rallied, and a flock of buyers descended on the gold market seeking exposure. Second, the juniors tend to explore for new gold deposits that become highly attractive to senior mining companies as the gold price appreciates. Gold discoveries command significant premiums paid by senior miners to the juniors during bull markets.
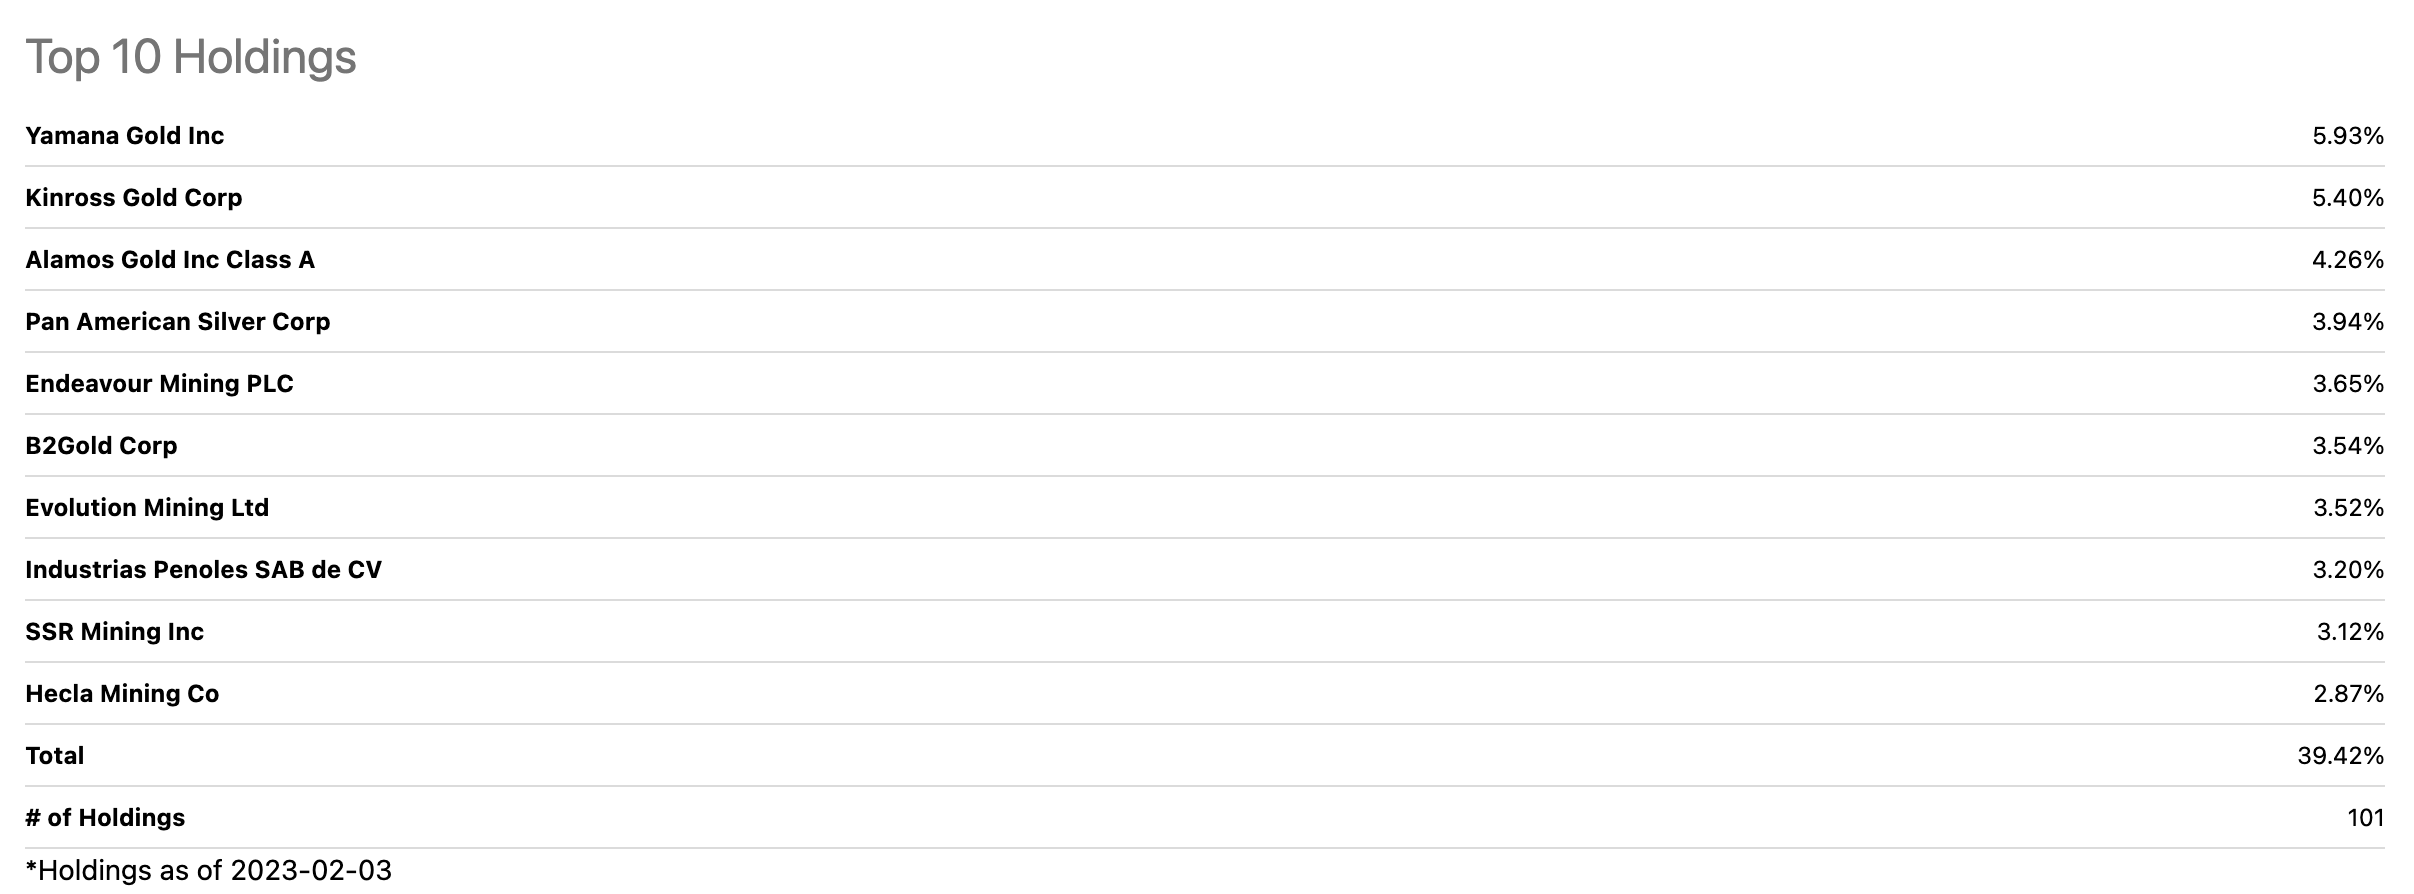
The most recent top holdings of the GDXJ ETF include:
Top Holdings of the GDXJ ETF (Seeking Alpha)
GDXJ is a highly liquid ETF. At around $37 per share on February 7, GDXJ had over $3.86 billion in assets under management. The junior gold mining ETF trades an average of more than 5.33 million shares daily and charges a 0.52% management fee. The $0.18 blended dividend translates to a 0.49% yield, nearly covering the management fee.
JNUG is a leveraged diversified junior gold mining ETF
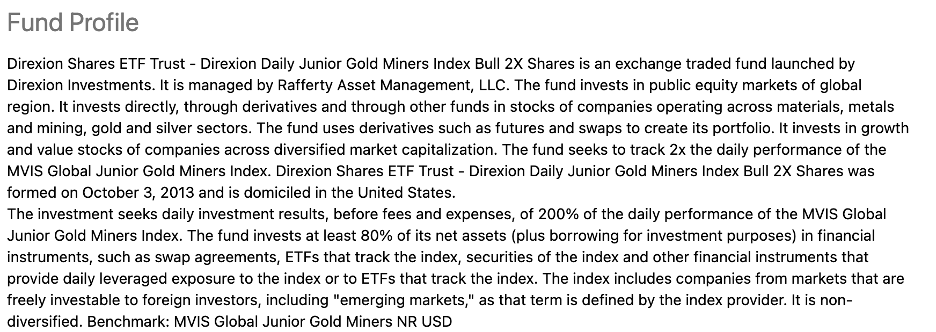
Based on the price action in 2020 and subsequent price rallies and corrections, GDX and GDXJ tend to outperform gold on the upside and underperform when gold declines, and GDXJ tends to be more volatile than GDX. For those looking to turbocharge GDXJ performance, the Direxion Daily Junior Gold Miners Index 2X Shares, JNUG, is a short-term trading product that can enhance returns when timing the gold market and mining shares' performance. JNUG's fund profile states:
Fund Profile for the JNUG Product (Seeking Alpha)
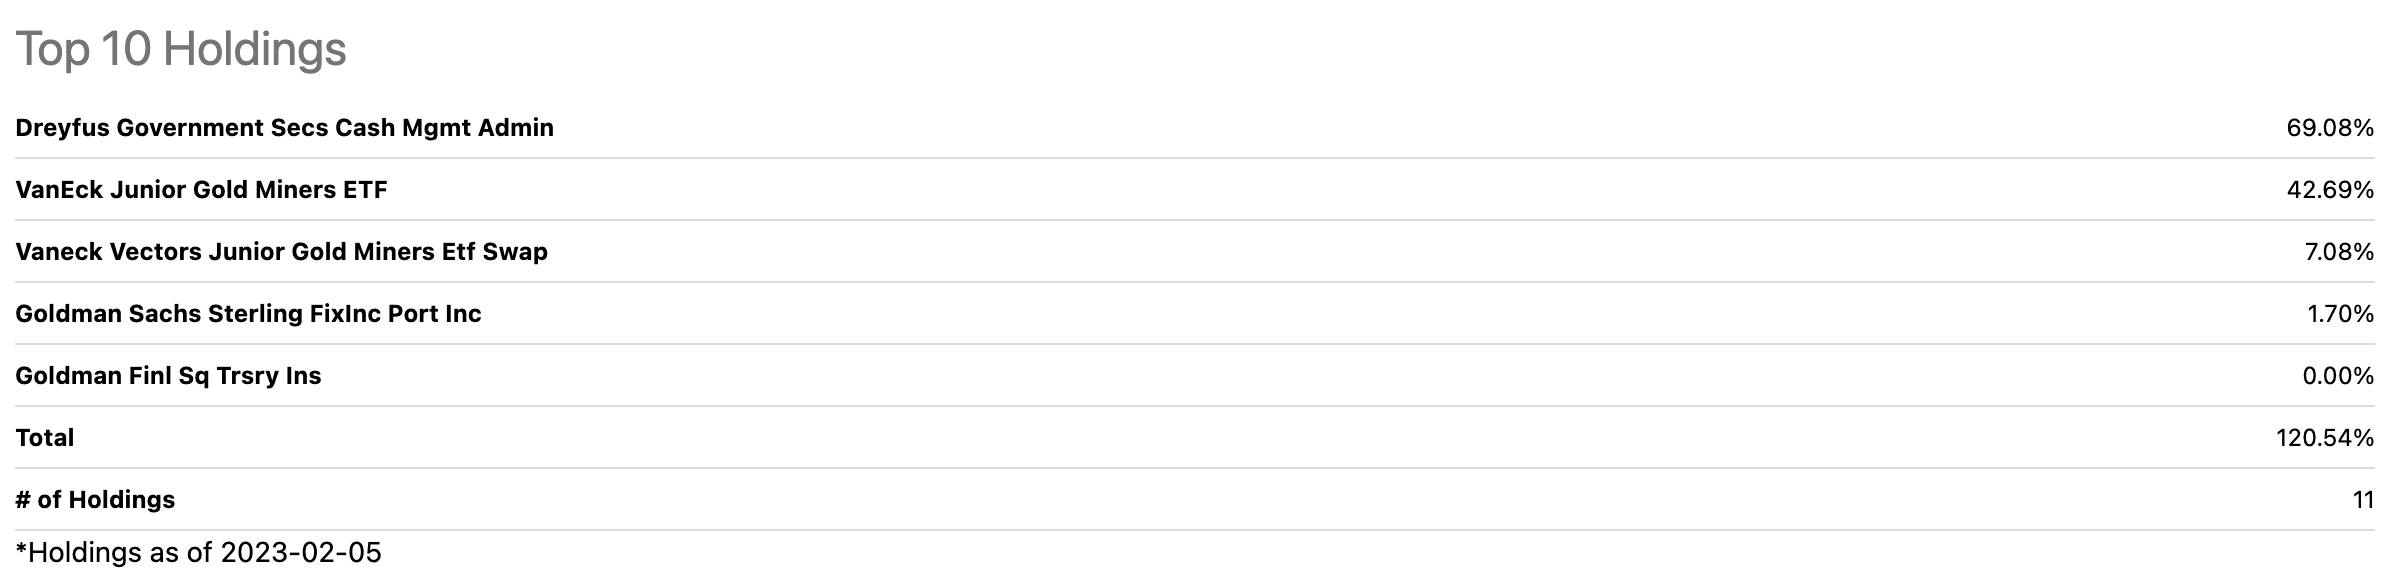
JNUG holds derivatives that can turbocharge GDXJ's performance. The most recent holdings include:
Top Holdings of the JNUG Product (Seeking Alpha)
As the chart highlights, JNUG has exposure to GDXJ. JNUG likely holds short-term options on GDXJ that create its targeted 200%. Meanwhile, the MVIS Global Junior Gold Miners Index's components and other information are available via this link .
JNUG is only appropriate for short-term risk positions in the junior gold mining stocks, as the tradeoff for its leverage is time decay. Over the past years, JNUG experienced periodic splits and reverse splits:
Split History for JUNG (splithistory.com)
In March 2020, JNUG fell to a split-adjusted $33.20 per share and rose 475.8% to $191.17 in August 2020, twice GDXJ's percentage gain.
Timing is everything in life, and while the long-term bull market in gold is firmly intact in February 2023, JNUG will depreciate if the junior gold mining shares fall or if they remain in a narrow trading range as time decay erodes the turbocharged product's value. However, if gold is on a bullish launchpad that will take it to another new record high, buying JNUG on the current dip could enhance percentage returns.
Leigh Goehring, the managing partner of Goehring and Rozencwajg, natural resource investors, recently told Kitco News that inflation is a " decade-long problem that will trigger new record-high prices in gold ." Goehring told Kitco, " I wouldn't be surprised to see a $3,000 price this year. " With gold under $1,900 per ounce on February 7, a 57.9% move to $3,000 would likely cause explosive price action in senior and junior gold mining shares and an even more substantial rally in the short-term JNUG product.
When considering the JNUG product, price and time stops are crucial because its leverage comes at a steep price that erodes JUNG's value over time. Meanwhile, inflation and the geopolitical landscape remain very bullish for gold in early 2023. Gold outperformed stocks, bonds, cryptocurrencies, real estate, and most assets in 2022 as the price of nearby futures posted a marginal 0.13% loss. Meanwhile, leverage and decay caused JNUG to fall from $64.13 on December 31, 2021, to $36.17 per share on December 30, 2022, or 43.6%. GDXJ declined 15% in 2022 as it underperformed gold, but the nearly triple percentage drop in JNUG highlights the danger of holding the leveraged product too long. JNUG is an effective short-term product that could explode if gold rallies, but plan to use discipline and do not overstay your welcome!
For further details see:
JNUG Could Explode If Gold Follows Through On The Upside