JQUA - JQUA: A Quality ETF Outperforming For The Right Reasons
2023-09-11 14:05:44 ET
Summary
- JQUA is a quality-focused large-cap blend ETF that selects constituents primarily from the Russell 1000 Index. Expenses are low at 0.12%, and the ETF has over $2 billion in assets.
- In a 60-ETF sample, JQUA ranked ninth-best in total returns between 2018-2023, making it one of the better quality ETFs on the market. Performance in down years was relatively strong.
- JQUA is unique because it improves its benchmark's fundamentals without sacrificing diversification. JQUA has 38% of assets in its top 25 holdings compared to 50-80% for its peers.
- This article compares JQUA's fundamentals alongside other top-performing ETFs like QUAL, SPHQ, PSET, USMC, and OEF. Special attention is also given to MOAT, a popular total market fund.
- While MOAT outperforms due to superior asset allocation, JQUA has the edge on security selection, proving successful stock-picking based on fundamentals is possible. I like what I see, and rate JQUA a solid "buy".
Investment Thesis
Today, I initiate coverage on the JPMorgan U.S. Quality Factor ETF ( JQUA ), a well-diversified large-cap factor fund that selects Russell 1000 stocks based on quality and profitability characteristics. JQUA has outperformed the iShares Russell 1000 ETF ( IWB ) by 15.53% since its November 2017 launch with about 7% less volatility, so my first impression is the strategy has merit. After evaluating its performance against 60 large-cap blend peers and fundamentals against five other quality-focused funds, I'm impressed. In this lengthy but detailed analysis, I will explain why I've rated JQUA a "buy," and as always, I look forward to answering your questions in the comments section afterward.
JQUA Overview
Fund Basics
JQUA is competitively priced with a 0.12% expense ratio compared to 0.15% for IWB, the iShares MSCI USA Quality Factor ETF ( QUAL ), and the Invesco S&P 500 Quality ETF ( SPHQ ). Its main drawback is that it's a relatively new fund launched less than six years ago. However, while its $2.03 billion in assets under management seems small, it's sufficient.
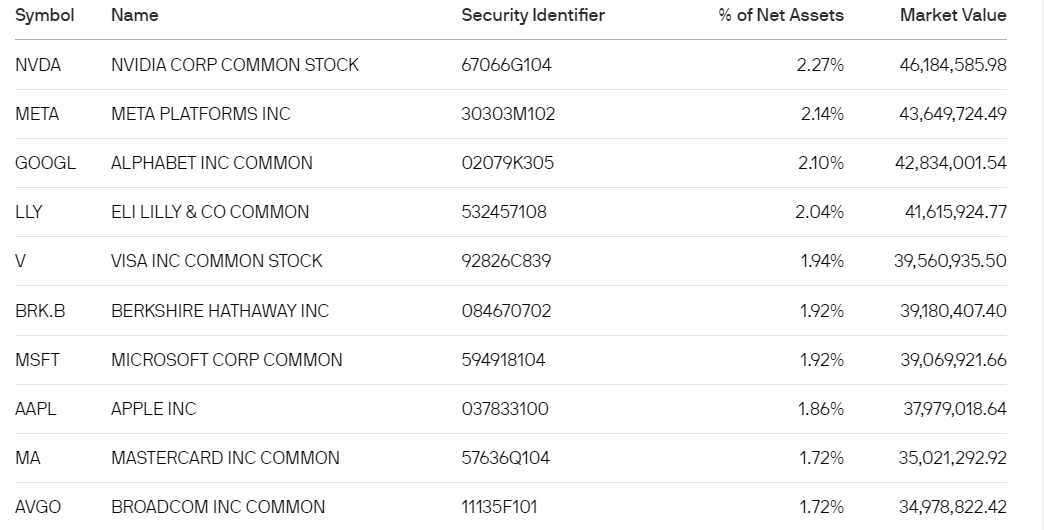
In addition, according to its fund page , JQUA's premium/discount to NAV is 0.00%, and its median bid-ask spread over the last 30 days is just 0.07%. As an ETF, JQUA benefits from primary and secondary market liquidity, described here . Since the best measure of the liquidity of an ETF is the liquidity of its underlying holdings, JQUA's large- and mid-cap selections mean it's highly liquid. A quick look at the fund's top ten holdings indicates shares of JQUA can efficiently be created and removed from the market as necessary.
Strategy Discussion and Sector Exposures
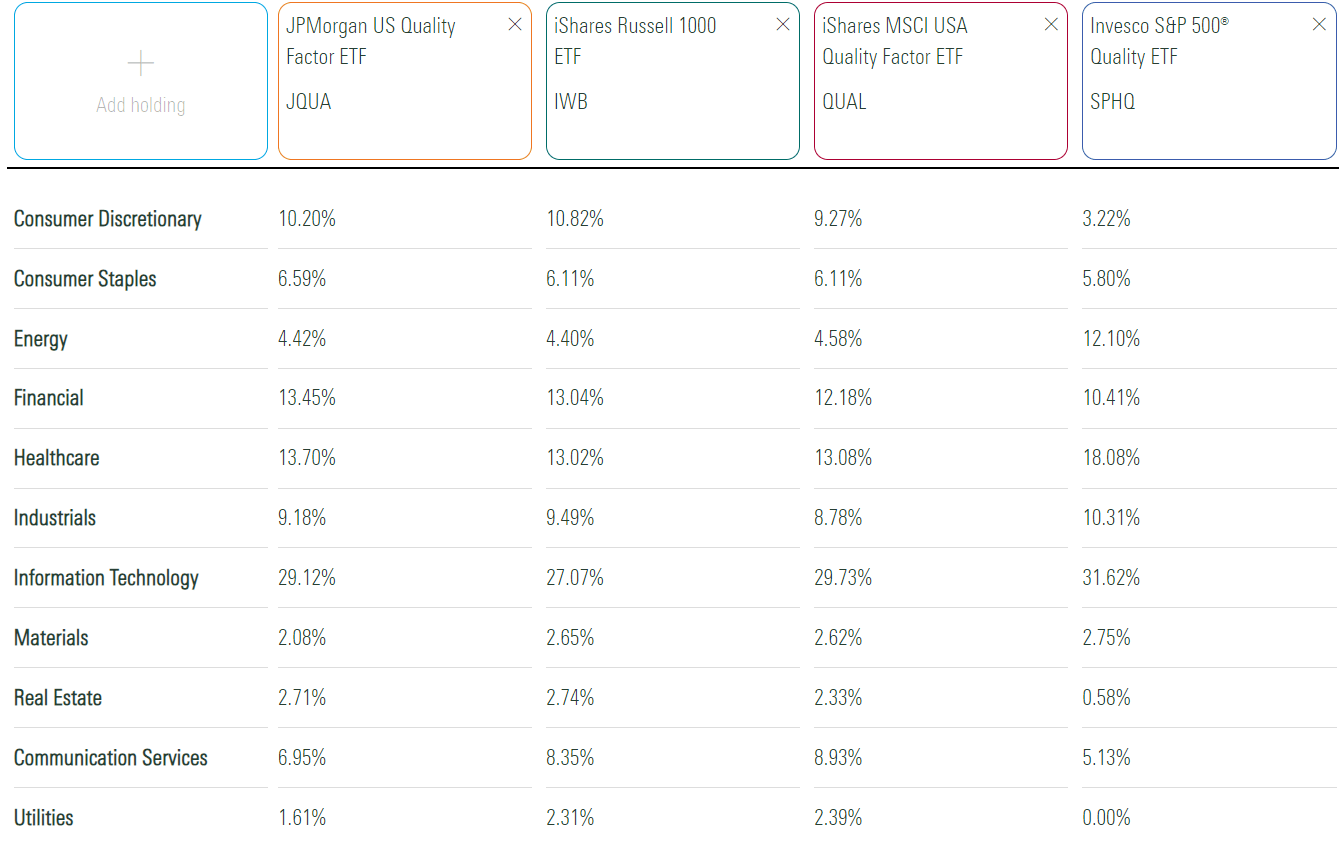
JQUA tracks the JP Morgan US Quality Factor Index, selecting stocks following a proprietary strategy based on quality factor characteristics. According to JQUA's summary prospectus , the method "targets equity securities with higher quality characteristics relative to their sector peers as measured by profitability, earnings quality, and solvency/financial risk." Selections are made primarily from the Russell 1000 Index, though the prospectus allows managers some flexibility. In addition, the prospectus describes how the Index diversifies across all sectors on a market capitalization-weighted basis. We can easily see the similarities in sector exposures with IWB in the following table.
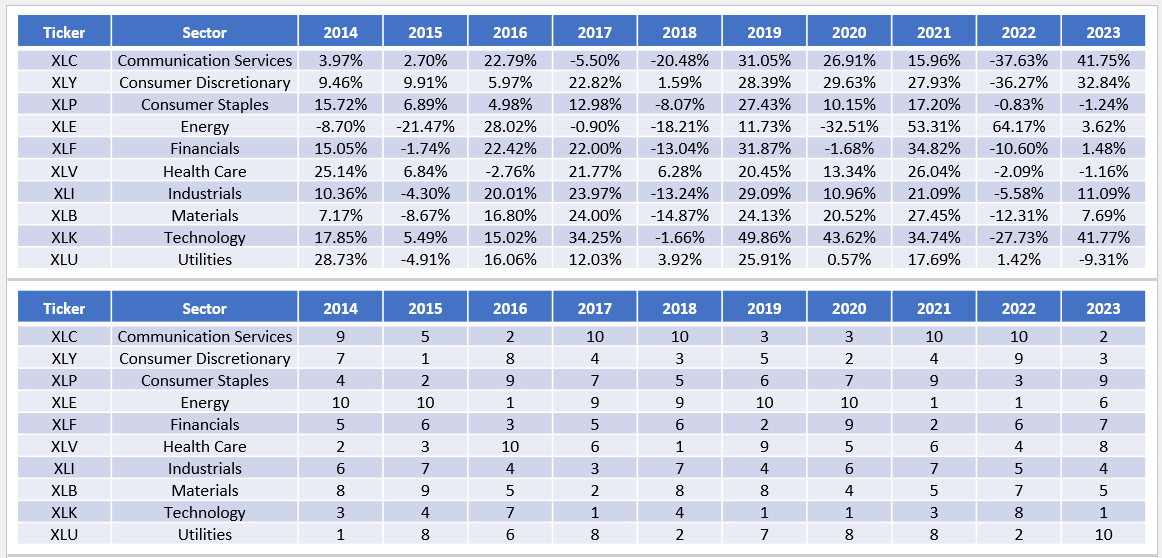
Like IWB, JQUA has a high allocation to Technology stocks, which is not unusual for a quality-focused fund. QUAL and SPHQ have slightly higher percentages; all four have negligible allocations to defensive sectors like Consumer Staples and Utilities. As shown below, XLP and XLU are the two worst-performing sectors this year (excluding Real Estate) and have yet to perform that well since JQUA's launch. Keep this table in mind as we evaluate JQUA's performance later. Since its sector exposures align with the Russell 1000 Index, JQUA's fortunes still rely on a strong economy and optimistic market. In short, don't think of it as a hedge against stocks.
However, to its credit, JQUA outperformed IWB in 2018 and 2022 by 1.91% and 5.73%, the two years of market declines. I believe JQUA can add value for investors during these down years while offering sufficient upside potential. To illustrate, consider JQUA's downside risk-adjusted returns (Sortino Ratio) since November 2017 compared to QUAL, SPHQ, and IWB. It's substantially higher at 1.07, resulting from a better maximum drawdown figure (22.15% from January to September 2022) and a better "worst year" figure: 13.46% in 2022. Here is a link to the results.
The key takeaway is that nearly all of JQUA's excess returns to date are due to successful security selection rather than the overweighting of a particular sector. In contrast, other ETFs may outperform due to successful asset allocations, and the Pacer US Cash Cows 100 ETF ( COWZ ) comes to mind as an example of a fund that potentially gives investors a false sense of security. As documented here and in several other reviews, COWZ succeeded because its methodology favored Energy stocks, leading it to outperform IWB by 15% and 20% in 2021 and 2022. While that takes nothing away from the approach, it's worth noting that per the table above, the Energy Select Sector SPDR ETF ( XLE ) was the top-performing sector ETF in those years, gaining 53.31% and 64.17%, respectively. Had you recognized the inflation risks early on, you likely could have achieved similar or even better results as COWZ by increasing your Energy sector exposure.
More Performance Comparisons
In my ETF database, I have identified 60 large-cap blend ETFs, including JQUA, that launched before 2018 that may also be appropriate comparators. In the first table below, I've listed the annual returns for the top 30 on a total returns (compounded) basis between January 2018 and August 2023, and the second table includes annual, average, and total rankings.
I want to make a few observations:
1. These tables show that JQUA was the ninth-best performer, with a 90.26% total return between January 2018 and August 2023. Several plain vanilla funds outperformed, notably those highly concentrated in mega-cap stocks like XLG , OEF , IWL , and MGC . There's an obvious case for simply buying these ETFs and forgetting about smart-beta funds, which I'll try to sort out later in my fundamental analysis. The Invesco S&P 500 High Beta ETF ( SPHB ) also did well, which makes sense. High-beta funds should outperform in rising markets but underperform in falling markets. We saw that in 2022 when SPHB ranked #53/60. XLG was the worst performer that year, with a 24.29% decline.
2. The Invesco Russell 1000 Dynamic Multifactor ETF ( OMFL ) was the top performer, gaining 103.81%, or 13.99% per year. I've covered OMFL twice, and it's not a large-cap blend fund. Typically, it switches between an expansion phase where small/mid-cap stocks with cheap valuations are favored and a slowdown phase where a less volatile blue-chip portfolio is implemented. Since most of its outperformance came when the ETF was in the "expansion" phase, I'm not comfortable classifying it in the same category as a straightforward S&P 500 Index fund. However, I included it to be comprehensive and will let each reader decide for themselves if it's an appropriate comparator.
3. The fundamental and multi-factor ETFs that performed well include the Principal Quality ETF ( PSET ), the Principal U.S. Mega Cap ETF ( USMC ), JQUA, and SPHQ. Further down the list are GSLC , FNDX , FQAL , and FLQL .
4. The second table shows that JQUA was the ninth-best performer on total returns, but its average annual return was just the 13th-best. After looking into the discrepancy, which is the largest except for the ProShares S&P 500 Ex-Energy ETF ( SPXE ), I noticed that JQUA has been a relatively consistent performer over the last six years. Its average annual rank was #24/60, but notably, it ranked fifth-best in the two negative years for the market in 2018 and 2022 at #6 and #22, respectively. The top ETFs in these two years were:
- First Trust Dow 30 Equal Weight ETF ( EDOW ): #1 and #7.
- SPDR Dow Jones Industrial Average ETF ( DIA ): #11 and #6.
- Invesco Bloomberg Pricing Power ETF ( POWA ): #13 and #8.
- Invesco Russell 1000 Dynamic Multifactor ETF ((OMFL)): #4 and #24.
- JPMorgan U.S. Quality Factor ETF ((JQUA)): #6 and #22.
Please note that POWA, previously known as the Invesco Defensive Equity ETF, recently changed strategies, so past performance may no longer be worth evaluating. Still, the "defensive" part holds, and I reiterate that investors looking for extra protection in a market downturn should consider smart beta ETFs instead of the plain vanilla mega caps that have outperformed much of the last decade.
JQUA Fundamental Analysis
Readers should consider multiple ETFs alongside JQUA, as it's not yet evident it's the ideal choice. I've tried to do that in the table below, comparing JQUA's fundamentals with IWB, QUAL, SPHQ, PSET, and USMC. I also selected the iShares S&P 100 ETF ( OEF ) as a top-performing, somewhat diversified plain vanilla benchmark.
Here are my observations:
1. JQUA has the lowest five-year beta of the seven ETFs at 0.97. One main reason is that high-beta mega-cap stocks don't dominate the fund. For example, Nvidia ( NVDA ), which has a 1.74 five-year beta, has only a 2.24% weight in JQUA, even though it's the most significant holding. That's 0.43% less than IWB's, 1.21% less than USMC's, and between 2.30% and 4.02% less than the remaining comparators. I downgraded the semiconductor industry in June, as I felt it was wise to take some profits on stocks like Nvidia, so I favor JQUA's lower allocation.
2. JQUA offers 8.14% and 10.58% estimated sales and earnings per share growth vs. IWB's 9.33% and 9.92% figures. It's a mixed bag, but its 25.08x forward earnings valuation is slightly better. That said, SPHQ has the best earnings growth (13.64%) and valuation combination (24.40x forward earnings). I'll talk more about why this is the case in point #5, but it's evident there are numerous other high-quality ETFs with similar, if not better, metrics.
3. This fundamental analysis highlights JQUA's improvement over IWB on return on profitability. Its constituents' trailing return on assets is higher (11.95% vs. 10.31%), as is its return on total capital (16.24% vs. 14.44%). All constituents have a perfect 10/10, or "A+," Seeking Alpha Profitability Grades, and on a normalized ten-point scale, JQUA scores an overall 9.41/10, better than IWB's 9.12/10. Still, the other ETFs are also highly profitable. USMC and SPHQ are the best at 9.79/10 and 9.86/10, and at this point, you must ask yourself how much quality you need in a market downturn. Since all six comparators performed better than IWB in 2018 and 2022 (IWB's average ranking was #42/60 those years), the ideal Profit Score should at least be 9.12/10. JQUA outperformed them all those years, so perhaps its 9.41/10 score is sufficient.
4. All ETFs have similar Seeking Alpha EPS Revision Scores, suggesting neither ETF has an obvious advantage, at least in the eyes of Wall Street analysts. JQUA's constituents delivered a 6.87% weighted average earnings surprise last quarter, a bit below average. I've listed JQUA's top ten industries below, alongside their weighted average earnings surprises from the previous quarter, to give you an idea of its current strengths and weaknesses.
- Systems Software (6.93% Weight): 8.41% EPS Surprise.
- Semiconductors (6.76% Weight): 14.09% EPS Surprise.
- Pharmaceuticals (6.34% Weight): 7.93% EPS Surprise.
- Application Software (5.86% Weight): 13.31% EPS Surprise.
- Biotechnology (4.53% Weight): 0.89% EPS Surprise.
- Interactive Media & Services (4.44% Weight): 7.00% EPS Surprise.
- Transaction & Payment Processing (4.01% Weight): 3.79% EPS Surprise.
- Integrated Oil & Gas (2.75% Weight): -0.65% EPS Surprise.
- Household Products (2.55% Weight): 7.83% EPS Surprise.
- IT Consulting & Other Services (2.55% Weight): 8.59% EPS Surprise.
Energy stands out for the wrong reasons, as it's the only top industry with a negative last-quarter earnings surprise. JQUA's 2.75% weighting to Integrated Oil & Gas stocks is Exxon Mobil ( XOM ) at 1.54% and Chevron ( CVX ) at 1.21%, sharply contrasting with the 7.45% weighting in SPHQ. On the opposite side are QUAL and PSET, which have no exposure to these stocks. You may have a preference based on your outlook on the sector, but JQUA's weightings are a nice compromise. Crude Oil futures have climbed back to $87.30, about $20 above its YTD March bottom but still well off the $120 per barrel prices at peak inflation last year.
5. One aspect I have yet to discuss is the importance of considering an ETF's fundamentals alongside diversification. With JQUA, only 38.40% of assets are in its top 25 holdings, less than IWB's 40.76%. At the industry level, JQUA's holdings in the top 25 total 73.15%, which is second-best in the sample and easily the best among its smart beta peers. The figures for the others are:
- IWB: 65.32%.
- QUAL: 85.24%.
- SPHQ: 91.17%.
- PSET: 90.23%.
- USMC: 98.17%.
- OEF: 86.58%.
Diversification is rarely the focus when evaluating fundamentals on third-party websites like Morningstar. To illustrate, consider the metrics presented for SPHQ. Morningstar uses a harmonic weighted-average method to calculate an ETF's valuation ratios, while I use a simple weighted-average method, but it's the growth rates I want to highlight. Based on this, you'll likely be impressed with SPHQ. Its historical earnings growth is 2x the category average, its cash flow growth is 4x, and its price-earnings ratio is nearly identical.
However, creating a portfolio with metrics like these is easy when you're not forced to choose as many stocks as the benchmark. SPHQ holds 100 stocks across 54 industries, with 72.19% of assets in its top 25 holdings. On the other hand, IWB has 1,000 stocks across 145 industries, with 40.76% of assets in its top 25 holdings. When presented with this information, rational investors understand the unfair comparison. However, I've come across too many articles that rely solely on these Morningstar tables, and I'd like to point out how misleading they can be. I can't say precisely how much diversification is worth, but I tend to cut a well-diversified ETF some slack if it doesn't look as good as a concentrated ETF on paper. Consider inferior fundamentals a cost of better diversification, which can keep you from underperforming too much if a particular sector or industry falls out of favor.
What Did I Miss?
I've tried to be pretty comprehensive in this article by evaluating JQUA against many alternatives, but I'm sure I've missed some worthy contenders. One of those is the VanEck Morningstar Wide Moat ETF ( MOAT ), which deserves its detailed analysis. I did not include MOAT in the earlier tables because it takes a Total Market, not Large Cap, focus, according to FactSet. To some, it's a distinction without a difference, so let's look at MOAT's fundamentals and performance rankings from 2018-2023 next. In the table below, we see how MOAT has outperformed JQUA by an annualized 0.49% (12.92% vs. 12.43%) since JQUA launched.
However, JQUA's risk-adjusted returns (Sharpe and Sortino Ratios) are better, as MOAT's annualized standard deviation (volatility) was 19.35% compared to 16.68% for JQUA. MOAT's drawdown was about 1% better, though.
If I slotted MOAT into the performance analysis from earlier to make 61 ETFs, here's how it would rank vs. JQUA:
- 2018: #1 ((MOAT)) vs. #7 ((JQUA)).
- 2019: #2 ((MOAT)) vs. #38 ((JQUA)).
- 2020: #37 ((MOAT)) vs. #31 ((JQUA)).
- 2021: #53 ((MOAT)) vs. #24 ((JQUA)).
- 2022: #24 ((MOAT)) vs. #22 ((JQUA)).
- 2023: #4 ((MOAT)) vs. #24 ((JQUA)).
MOAT has experienced its fair share of ups and downs. Unlike JQUA, it's been a top performer in 2018, 2019, and 2023 and a bottom performer in 2021. What's interesting is how MOAT performed well in both negative and positive market years (2018 and 2019), and I think that potential is quite appealing, and why so many SA readers like it.
I've included the same fundamental analysis for MOAT as I did for JQUA in the table below. It may surprise some that MOAT's quality, measured by Seeking Alpha's 8.95/10 Profit Score, is even lower than IWB's 9.12/10 score. TTM ROA and ROTC are also 4-5% behind JQUA, a crucial reason for MOAT's higher potential to perform poorly in a given year. Plus, it's much more concentrated than JQUA, with 61.36% of assets in its top 25 holdings and coverage extending to just 30 industries.
Looking at MOAT's estimated growth metrics, they're significantly lower than JQUA. It trades at 24.78x forward earnings, similar to JQUA and other quality-focused ETFs, but the discount is smaller than expected. Instead, MOAT has succeeded in 2023 because of superior asset allocation, which I determined in one of my earliest reviews. Currently, it has no exposure to Energy, Real Estate, and Utilities, so again, it's less diversified than JQUA. I encourage you to consider it, but do not expect the same level of consistency. Concentrated ETFs like SPHQ are better comparators.
Investment Recommendation
I looked at JQUA from various performance and fundamental perspectives in this analysis. I've drawn the following conclusions:
1. JQUA was the ninth-best-performing large-cap blend ETF in my sample of 60 from January 2018 to August 2023. It's never been a top performer in any year, but it's consistent and seems to do best when markets decline. This track record aligns with my thinking of how high-quality ETFs should work. In addition, JQUA's current portfolio has a 0.97 five-year beta, the lowest compared to the six other peers selected. Given these factors, there's a good chance it will outperform in the next market downturn, and if they happen more frequently, JQUA could rise to become a top-performing large-cap fund.
2. JQUA is one of many quality ETFs investors should consider. Investors looking for exposure to the quality factor can do so with almost any market-cap-weighted mega-cap fund. Naturally, quality declines as you add smaller companies to a portfolio, but ideally, investors will receive higher growth or a cheaper valuation in exchange. I found that JQUA was the only fund to match IWB in terms of concentration in its top 25 holdings (38.40% vs. 40.76%) and showed improvements in earnings growth and forward earnings valuation. Other ETFs like SPHQ may look better on paper but are far more concentrated. This explains why its track record is so mixed.
3. JQUA might benefit from increased diversification and lower exposure to mega-cap stocks, which didn't outperform their smaller counterparts last earnings season. That said, it's still heavily exposed to the Technology sector at 29.12%, and the Technology Select Sector SPDR ETF ( XLK ) already gained 41.77% YTD through August. Considering how XLK's average annual return over the prior 20 years (2003-2022) was 15.42% and how earnings surprises aren't matching what they were in the major bull market runs of 2009 and 2020, there may be little upside left this year.
Based on these points, I still have a good impression of JQUA and have decided to rate it a "buy." I like that all of its outperformance over IWB is due to superior security selection rather than concentrated bets on one or two sectors. While straightforward market-cap-weighted ETFs like XLG and OEF have outperformed, they've only done so due to the unusual success of only a handful of stocks. If you expect this trend to stop, smart beta ETFs are worth considering, and JQUA is a reasonably safe solution. Thank you for reading, and I look forward to continuing the discussion in the comments below.
For further details see:
JQUA: A Quality ETF Outperforming For The Right Reasons