JRI - JRI: Amortizing Infrastructure Fund
2023-04-13 14:13:40 ET
Summary
- The Nuveen Real Asset Income and Growth Fund aims to provide high current income from a portfolio of infrastructure and real estate company equities and bonds.
- The fund pays an attractive 8.8% distribution yield. But it exhibits classic signs of being an amortizing "return of principal" fund.
- Compared to peers, the JRI fund is more volatile and has worse long-term returns. I would recommend investors consider some peer funds that I list instead.
The Nuveen Real Asset Income and Growth Fund ( JRI ) aims to provide high current income from a portfolio of infrastructure and real estate asset company equities and bonds.
Although the JRI fund pays an attractive 8.8% distribution yield, my main worry is that the fund exhibits classic signs of being an amortizing "return of principal fund" with long-term returns significantly below its distribution rate. I recommend investors take a look at other utility and infrastructure funds instead.
Fund Overview
The Nuveen Real Asset Income And Growth Fund ("JRI") is a closed-end fund ("CEF") that seeks to provide high current income from a portfolio of real asset-related companies across the world. The JRI fund can invest across a company's capital structure, including common stocks, preferred securities, and debt. Real asset-related companies are those engaged in or involved with infrastructure projects, facilities, services, and REITs.
Up to 40% of the fund's assets may be invested in debt securities, with up to 10% invested in non-investment grade ("junk") securities rated CCC+/Ca1 or lower.
The JRI fund may also use leverage to enhance returns and may write call options to generate additional income. The JRI fund has $382 million in net assets vs. $549 million in managed assets for an effective leverage of 30.4% as of February 28, 2023.
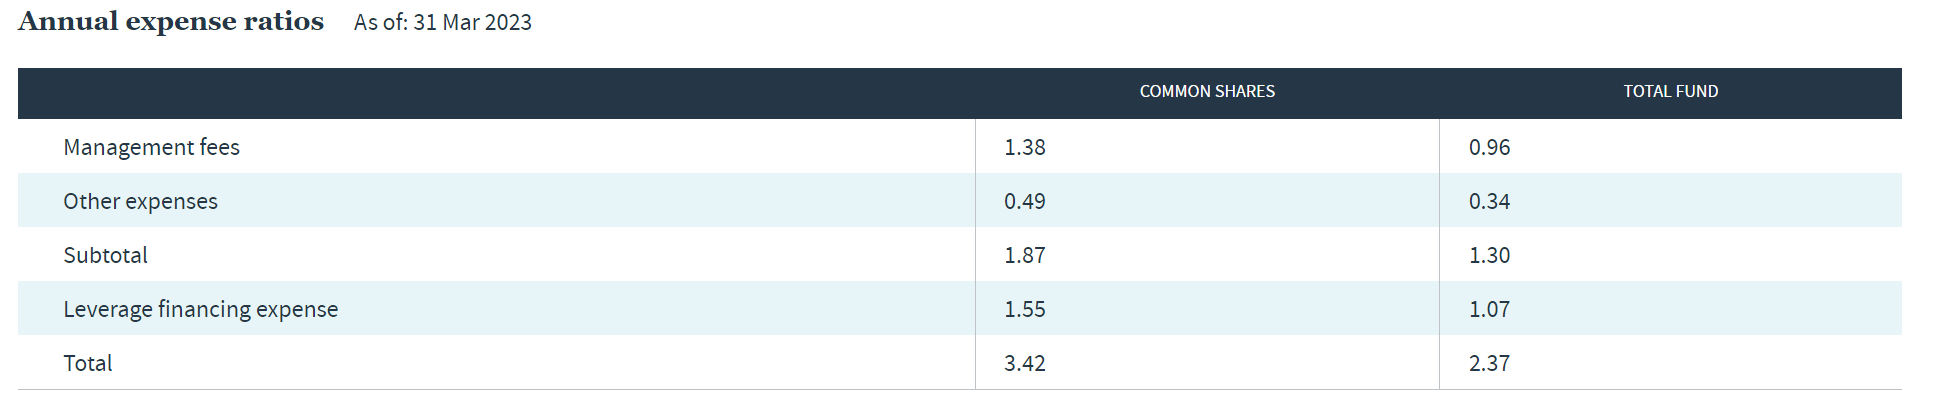
The fund charged a 1.87% expense ratio as of March 31, 2023. However, including the cost of leverage, JRI's annual expenses climb to 3.42% of common shares (Figure 1).
Portfolio Holdings
As of February 28, 2023, the JRI fund had 485 positions with fixed income effective duration of 3.0 years.
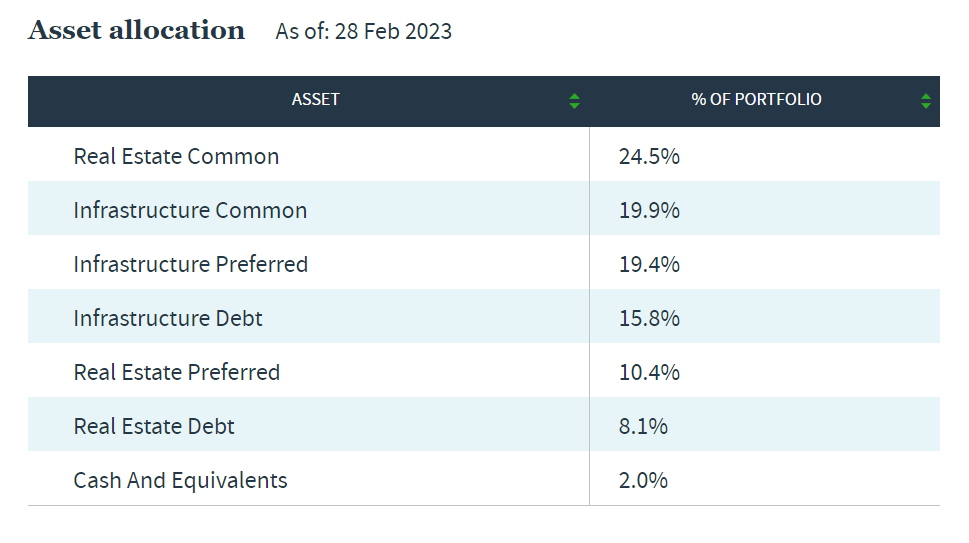
Figure 2 shows the JRI fund's asset allocation. 44.4% of the fund is allocated to common equity (24.5% real estate, 19.9% infrastructure), 29.8% is allocated to preferred securities (19.4% infrastructure, 10.4% real estate), and 23.9% is allocated to debt securities (15.8% infrastructure, 8.1% real estate).
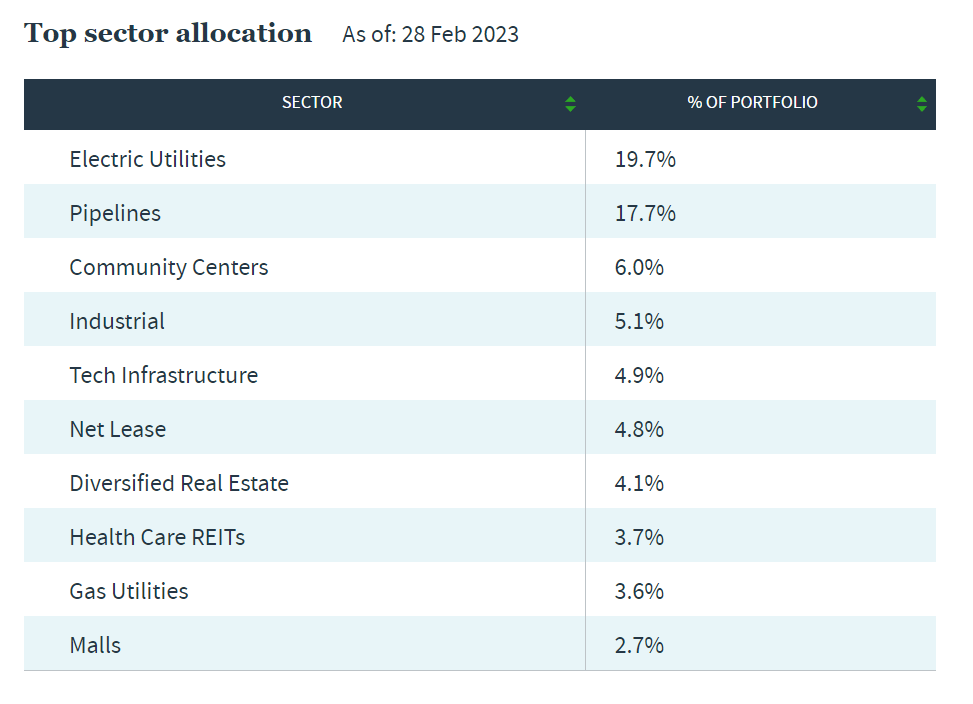
Figure 3 shows the sector allocation of the fund's common equity and preferred security portfolios. The top sector allocations are Electric Utilities (19.7%), Pipelines (17.7%), Community Centers (6.0%), Industrial real estate (5.1%), and Technology Infrastructure (4.9%).
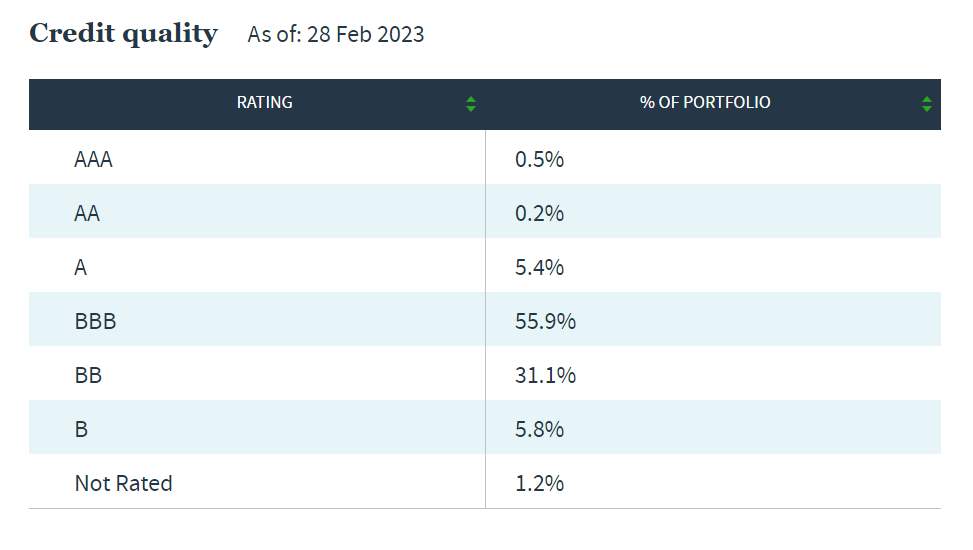
Figure 4 shows the credit quality allocation of the JRI fund's bond portfolio, which is predominantly invested in BBB-rated (55.9%) and BB-rated (31.1%) securities.
Figure 4 - JRI fixed income credit quality allocation (nuveen.com)
Returns
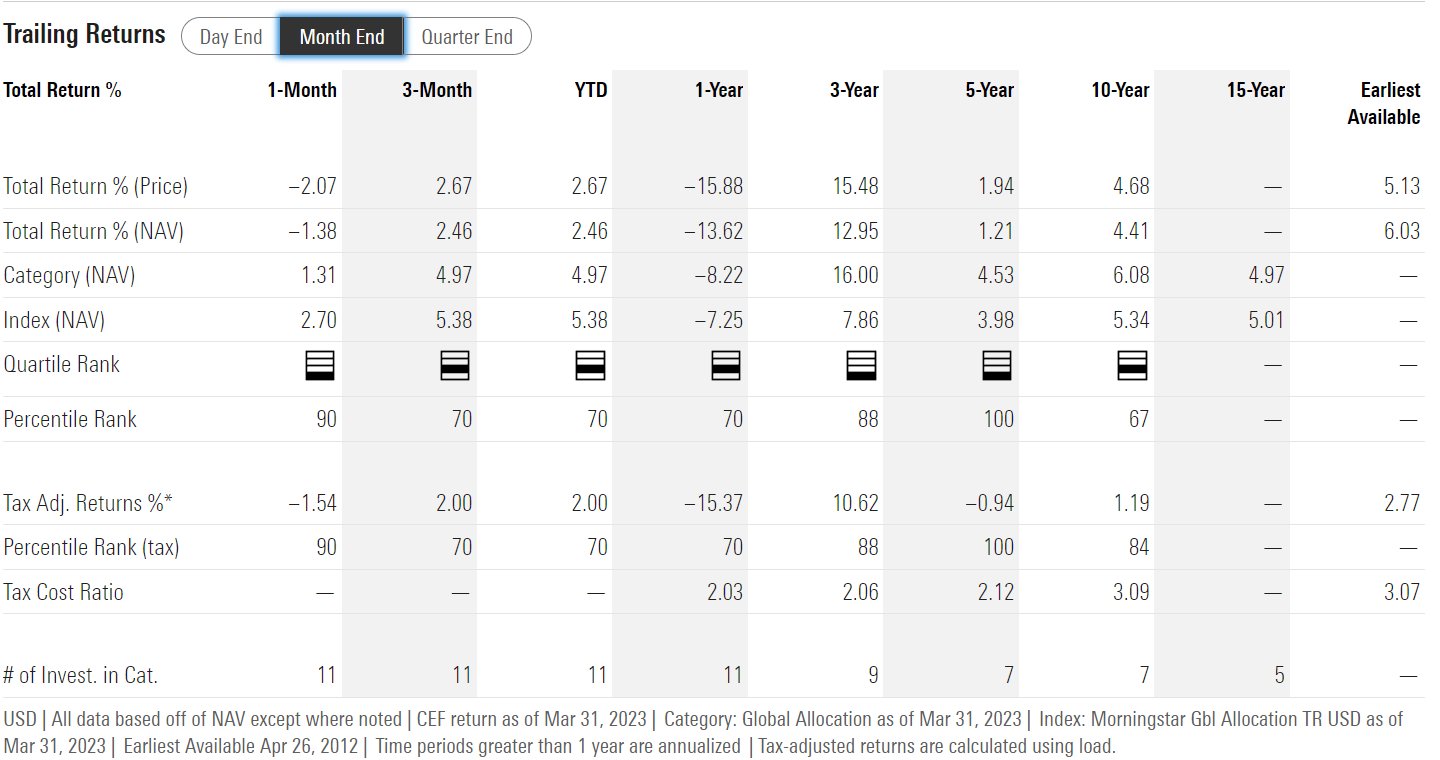
Figure 5 shows the JRI fund's historical returns. The fund has an impressive 3Yr average annual return of 13.0% to March 31, 2023, but 5 and 10Yr average annual returns are much more modest at 1.2% and 4.4%, respectively.
Investors should keep in mind that the 3Yr average return figure may be flattered due to the starting period, March 2020, which coincided with the lows of the COVID-pandemic. Many funds exhibit strong 3Yr average annual returns because of this quirk. I believe the 5 and 10Yr return figures are much more representative of the JRI fund's returns potential through a cycle.
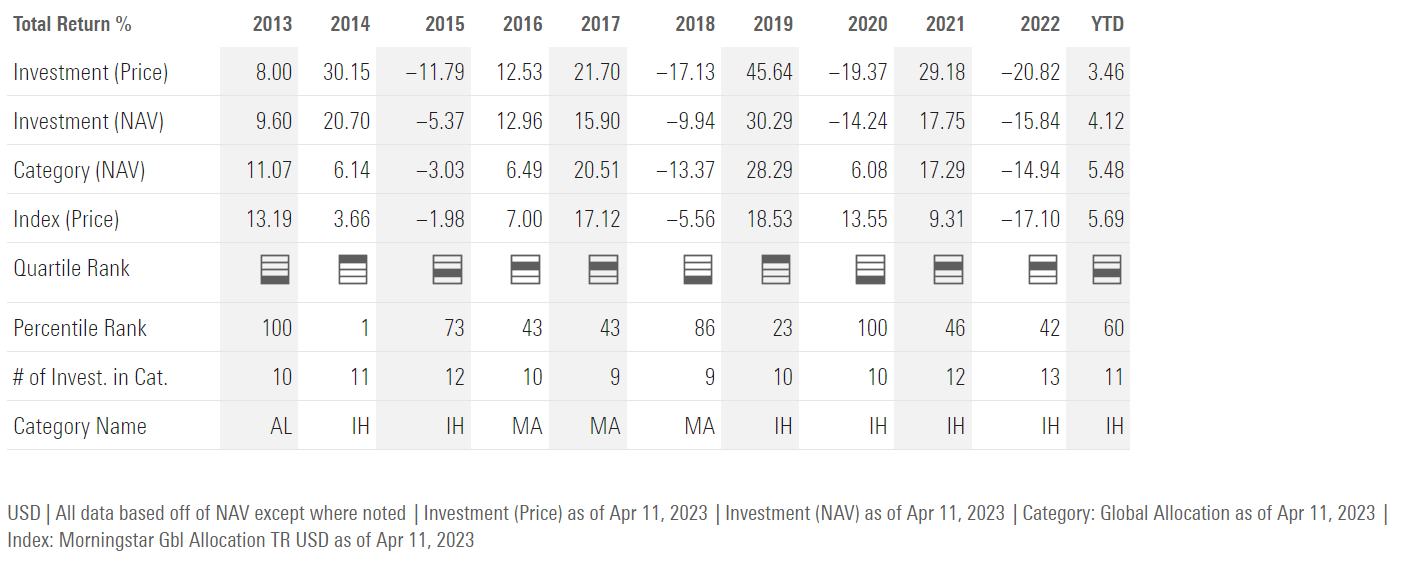
Analyzing JRI's returns on an annual basis, I am struck by the volatile nature of JRI's performance (Figure 6). In the decade from 2013 to 2022, the JRI fund has had returns greater than 10%, or less than -10% in 7 of the 10 years.
Distribution & Yield
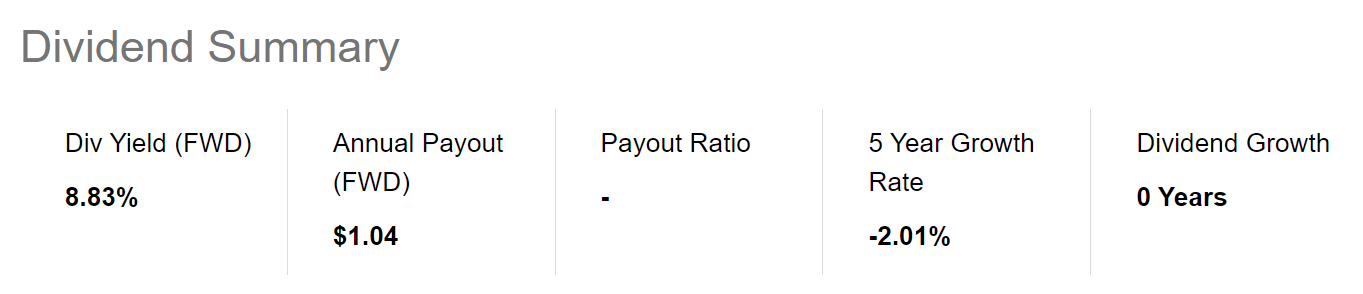
The main attraction for investors in an infrastructure fund like JRI is its distribution yield. The JRI fund is currently paying an attractive $0.087/share monthly distribution that annualizes to an 8.8% distribution yield (Figure 7). On NAV, the JRI fund is paying a 7.5% distribution yield.
Investors should note that JRI has recently cut its monthly distribution, from $0.0965 to $0.087 in March 2023. While JRI's current distribution yield may look attractive at first glance, I am worried that it may not be sustainable in the long-run.
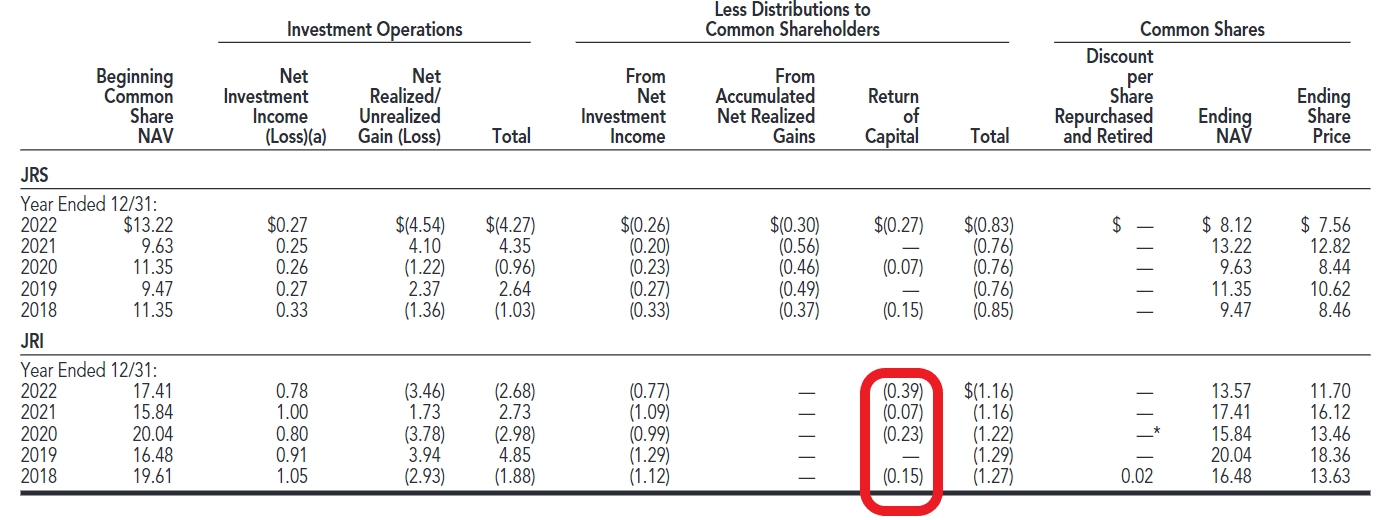
From the fund's annual report, we can see that the JRI fund had consistently used return of capital ("ROC") to fund a portion of its distribution (Figure 8). Funds that do not earn their distributions are called " return of principal " funds and are characterized by liquidating NAV to fund distribution rates that are too high relative to the strategy's earnings power.
Figure 8 - JRI has used ROC to fund distributions (JRI 2022 annual report)
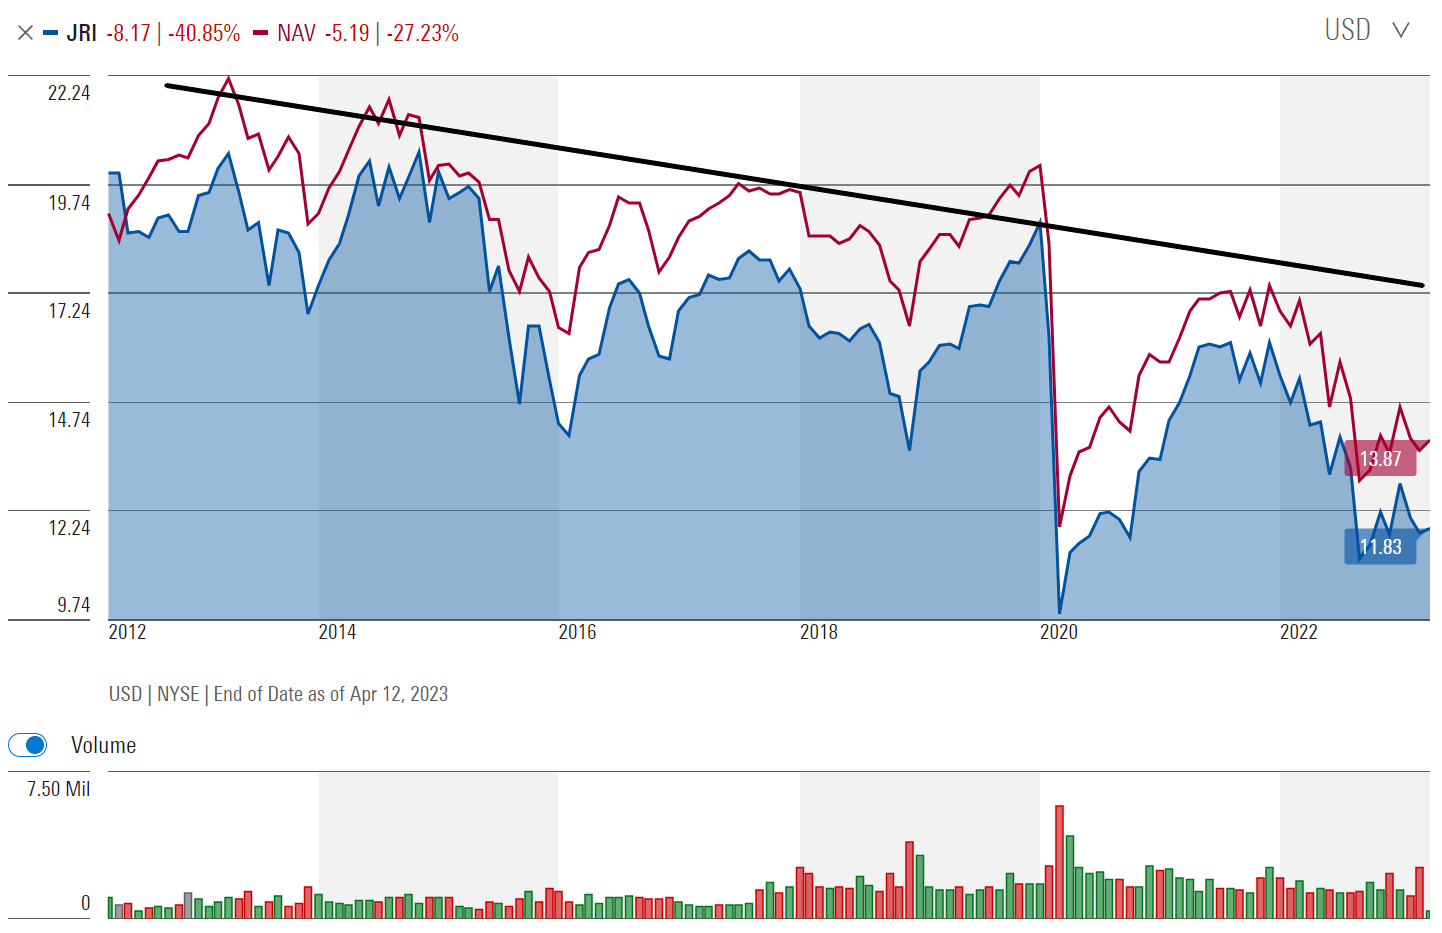
My suspicion is confirmed by analyzing the fund's NAV and market price history, which exhibits the classic long-term decline that is commonly associated with "return of principal" funds (Figure 9).
Figure 9 - JRI has long-term declining NAV and price (morningstar.com)
Since inception, JRI's distribution has also shrunk from a quarterly $0.3675 (equivalent to a monthly $0.1225) to the current $0.087/month.
The problem with amortizing "return of principal" funds is that long-term investors may end up losing both principal and income, as NAV is liquidated to pay an unsustainable yield, which reduces income-earning assets to fund future distributions.
JRI Vs. Peers
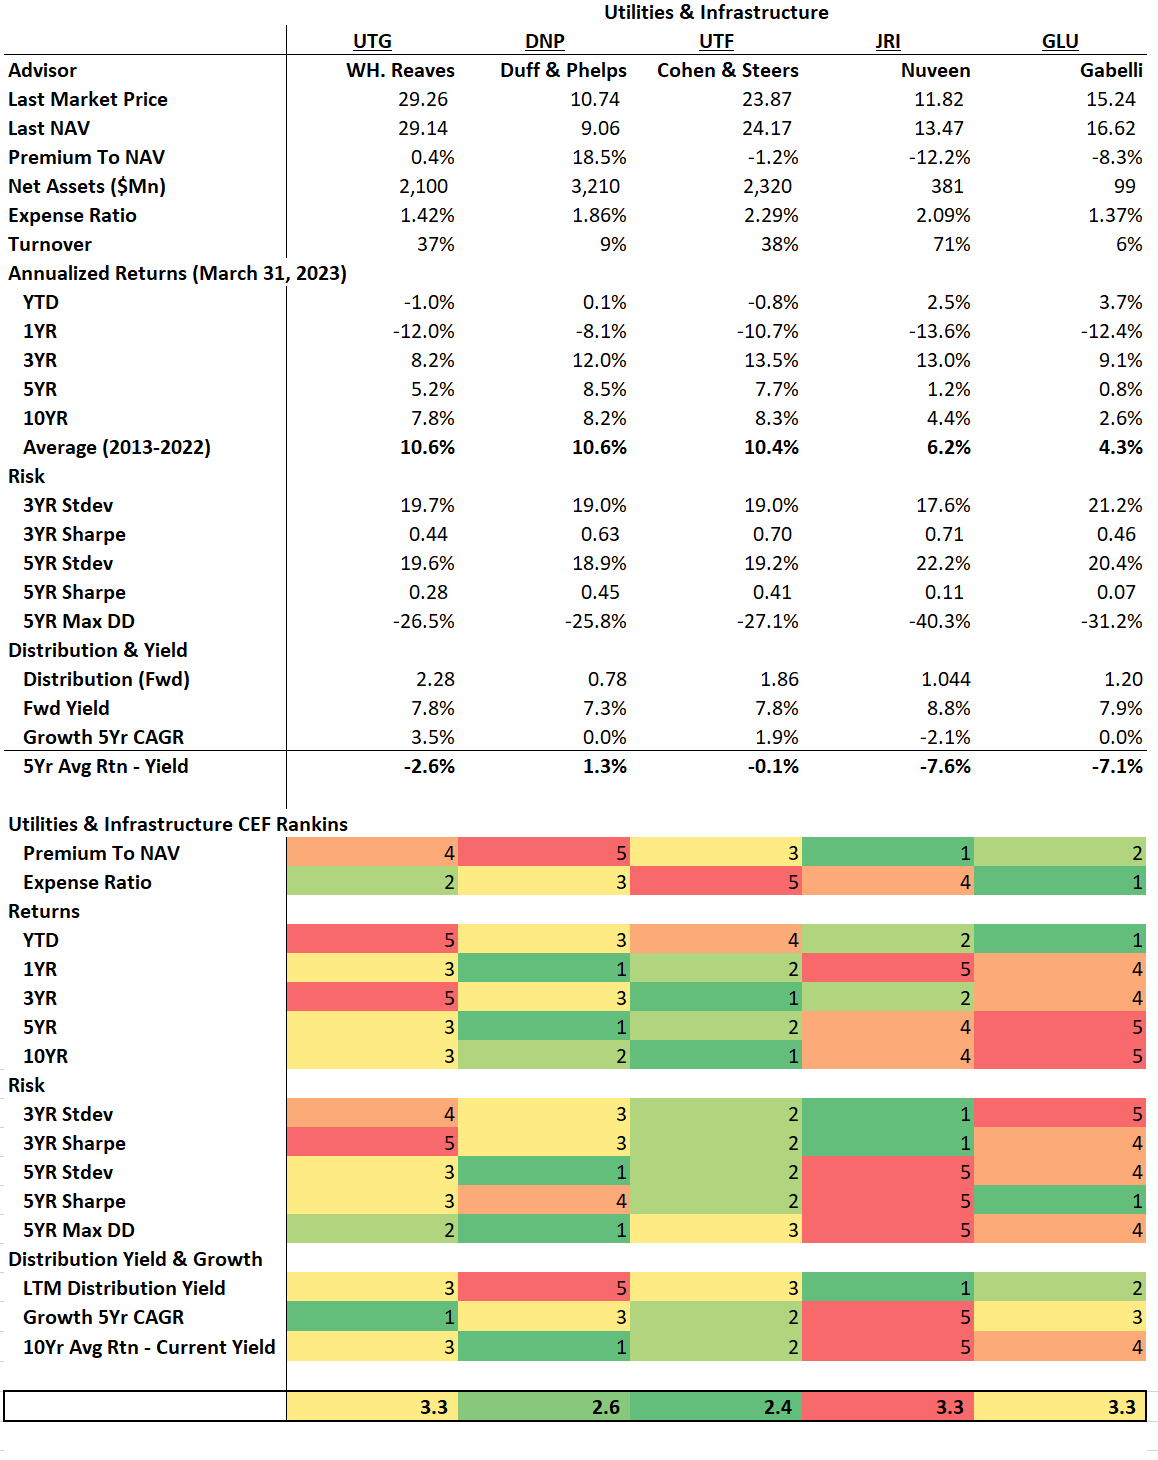
Figure 10 compares the JRI fund against peer funds that also focus on utilities and infrastructure assets. For this comparison, I have chosen the Reaves Utility Income Trust ( UTG ), DNP Select Income Fund ( DNP ), Cohen & Steers Infrastructure Fund ( UTF ), and the Gabelli Global Utility & Income Trust ( GLU ) as peers for JRI.
Figure 10 - JRI vs. peers (Author created with data from Seeking Alpha, Morningstar and fund websites)
In terms of fund structure, on the positive side, the JRI fund is currently trading at a 12% discount to NAV versus peers that mostly trade near NAV or at a premium. However, it is one of the more expensive funds, with a 2.09% expense ratio.
With respect to return, the JRI fund has a strong 3Yr return figure, but its longer-term 5 and 10yr average annual returns are poor vs. peers.
Due to its strong 3Yr returns, the JRI fund has the best 3Yr Sharpe Ratio. But it also has the worst 5Yr volatility and Sharpe Ratio, as well as the largest drawdown compared to peer funds. This speaks to the volatile nature of JRI's returns that I mentioned above.
On the distribution yield, the JRI fund pays the highest current yield, but it is also the only peer fund to have cut its distribution. Comparing 5Yr average annual returns to its distribution rate, the JRI fund also has one of the worst shortfalls.
Overall, the JRI fund ranks poorly against its peer funds due to the volatile nature of its returns and the low long-term returns performance.
At the moment, I believe the Cohen & Steers Infrastructure Fund is the most attractive out of the peer funds, as it does not trade at a large premium, unlike the DNP fund. Plus, it ranks well in terms of returns and risk. Unfortunately, UTF is also the most expensive.
Conclusion
The Nuveen Real Asset Income And Growth Fund seeks to provide high current income from a portfolio of infrastructure and real estate equities and debt. While investors may be tempted to collect the attractive 8.8% distribution yield, my main worry is that the fund exhibits classic signs of being an amortizing 'return of principal fund' with long-term returns significantly below its distribution rate.
Furthermore, returns of the Nuveen Real Asset Income and Growth Fund are very volatile and can be a bit of a hit-or-miss. For high-yielding infrastructure exposure, I would recommend investors take a look at the UTF fund instead of Nuveen Real Asset Income and Growth Fund.
For further details see:
JRI: Amortizing Infrastructure Fund