USOI - July Non-OPEC And World Oil Production
2023-11-28 03:22:00 ET
Summary
- July Non-OPEC oil production increased by 520 kb/d to 52,245 kb/d and is up 1,706 kb/d from May.
- From August 2023 to December 2024, oil production in Non-OPEC countries is expected to increase by 1,105.
- World without the US oil output in July decreased by 419 kb/d to 68,749 kb/d. August’s output is expected to drop by 350 kb/d to 68,399 kb/d.
A guest post by Ovi
The EIA continues to have problems with updating its World oil production website. Consequently, this month’s report is again a shorter version of previous posts because the EIA’s International Energy Statistics update for June and July is not available. Information from other sources such as OPEC, the STEO and country specific sites such as Brazil, Norway and China are used to provide a short-term outlook for future output and direction for a few of these countries and the world.
Where STEO data was used, the ratio of C + C to All Liquids was calculated . The average for the last six months up to May was used to project June and July production and in a few cases August production.
World oil production and projection charts are presented at the end of this post.
The current May International Energy Statistics has been updated to correct for the missing condensate production in the previous Russian file and is used for this report.
July Non-OPEC oil production increased by 520 kb/d to 52,245 kb/d and is up 1,706 kb/d from May. Close to 500 kb/d of the June increase is related to the EIA’s condensate correction for Russia in the EIA’s updated May International Energy Statistics. In the previous EIA May report, Russian condensate was not included in Russian production.
Using production data from the November 2023 STEO and the updated May EIA International Energy Statistics, a projection for Non-OPEC oil output was made for the period August 2023 to December 2024. (Red graph). Output is expected to reach 53,377 kb/d in December 2024, which is 969 kb/d higher than the December 2019 peak of 52,408 kb/d. August production is expected to increase by 27 kb/d.
From August 2023 to December 2024, oil production in Non-OPEC countries is expected to increase by 1,105. Note that production is expected to be relatively flat till May 2024.
July Non-OPEC W/O US production increased by 455 kb/d to 39,286 kb/d.
August Non-OPEC W/O US production, using the same method described above, is projected to drop by 66 kb/d to 39,220 kb/d. From August 2023 to December 2024, production in Non-OPEC countries W/O the US is expected to increase by 718 kb/d.
Note that December 2024 output exceeds the pre-covid high of 39,554 kb/d in January 2020 by 384 kb/d.
Non-OPEC Oil Production Charts
Brazil’s National Petroleum Association (BNPA) reported that output in September increased while it dropped in October. September increased by 210 kb/d to 3,672 kb/d mainly due to ramp-ups at four offshore platforms and less maintenance, red markers. October production dropped by 131 kb/d to 3,541 kb/d.
Production from the off-shore “pre-salt” region has been added to the Brazil chart, blue markers. October production dropped by 108 kb/d, which accounts for most of the 131 kb/d overall decrease in Brazil’s October output.
According to this source : “Much of Brazil’s oil comes from its ‘pre-salt’ region, where 11.5 billion barrels of proven crude deposits sit under a thick crust of sodium chloride, beneath the ocean floor. These deposits lie around 200km from Rio de Janeiro and were discovered during da Silva’s first term in office in 2006. Petrobras ( PBR ) now plans to develop 11 more platforms in the waters by 2027. However, output from the region is expected to peak by 2029, meaning many are questioning the long-term potential for oil production in Brazil.”
According to this source , “Petrobras approved a strategic plan for 2024-2028. E&P CapEx for the 2024-2028 period totals US$ 73 billion, with around 67% allocated to the pre-salt, which has a major economic and environmental competitive advantage, with the production of better quality oil and lower emissions of greenhouse gases. The projected production profile out to 2028 is shown below.
The production curve considers the entry of 14 new platforms (FPSOs) in the 2024-2028 period, 10 of which have already been contracted. A new generation of platforms is being built, more modern, more technological, more efficient and with lower emissions.
The projections for oil production, total production and commercial production of oil and natural gas for 2024 have been increased by approximately 100,000 bpd/boed compared to the previous plan, considering the good performance of the fields, the forecasts for ramp-ups and the entry of new wells.”
Comparing this chart with the current pre-salt production shown in the Brazil chart of say roughly 2,775 kb/d, production will not increase over the next two years. Starting in 2026, output will increase by 100 kb/d/yr.
According to the EIA’s STEO, Canada’s production increased by 260 kb/d in July to 4,605 kb/d.
The STEO is forecasting that Canadian production rose slightly in August before dropping by 80 kb/d to 4,545 kb/d in September due to fires in Alberta this summer.
The China National Bureau of Statistics reported that production in August rose by 44 kb/d to 4,117 kb/d. Output dropped in September to 4,103 kb/d.
Every January for the last four years, China’s production has taken a massive increase. In 2022, production jumped by 322 kb/d from December 2021 to February 2022. However, according to the November MOMR: For 2024, Chinese liquids production is expected to remain steady at the 2023 level of 4.6 m/d.
While China’s production growth has risen steady since 2018, it may be approaching its post pandemic high, as inferred by the November MOMR.
According to the STEO, Kazakhstan’s output decreased by 119 kb/d in July to 1,757 kb/d.
The STEO is forecasting a production drop in August to 1,707 kb/d and a rebound to 1,789 in September.
Mexico’s production in July was 1,915 kb/d, a decrease of 44 kb/d from June’s 1,959 kb/d.
According to Pemex, Mexico’s oil production from August to October was relatively flat. October output was 1,923 kb/d, 8 kb/d higher than July.
Mexico has recently revised its definition of condensate. This has resulted in the EIA adding an extra 60 kb/d, on average, to the Pemex report. The red markers include the additional 60 kb/d.
The Norway’s Petroleum Directorate ((NPD)) reported that August’s production was unchanged at 1,805 kb/d and then dropped to 1,659 kb/d in September. (Red markers). According to the November MOMR, production dropped due to unplanned shutdowns and equipment failure on a number of platforms. October output rebounded to 1,798 kb/d.
According to the NPD : “Oil production in October was 3.7 percent lower than the NPD’s forecast and 0.7 percent lower than the forecast so far this year.”
The recent production high of 1,856 kb/d appears to be close to Norway’s post Covid production peak.
Oman’s production rose very consistently since the low of May 2020. However, production began to drop in October 2022. According to the November STEO, Oman’s July’s output dropped by 2 kb/d to 1,037. The STEO projects that production will recover to 1,039 kb/d in August.
Qatar’s July’s output was unchanged at 1,322 kb/d, possibly due to lack of updated information.
The EIA’s November STEO report was used to project Russian output from August to October by reducing the all liquids output by 0.9339 to estimate the C + C production. The 0.9339 has not varied much from the pre-war average of Russia Ministry production to the STEO all liquids production from October 2020 to September 2021. October production was 9,868 kb/d, a decrease of 5 kb/d from September, orange markers.
Using data from previous Argus Media reports, Russian production is presented from May to October. For October, Argus reported that Russian crude production was 9,530 kb/d, an increase of 30 kb/d, blue markers. Adding 8% to Argus’ October crude provides a projected C + C production of 10,292 kb/d, which is a proxy for the Pre-War Russian Ministry estimate, red markers.
Comparing the Argus crude data with the latest STEO projection indicates that the STEO estimate for Russian C + C is midway between the Argus estimates for Crude and C + C. Prior to the war, the Russian Ministry estimate was always 404 kb/d higher than the EIA estimate for C + C. The current October Russia Proxy output is 424 kb/d higher that the EIA’s STEO estimate, just 20 kb/d higher than in the past.
The November IEA OMR agrees that Russian crude production in October was close to 9,530 kb/d.
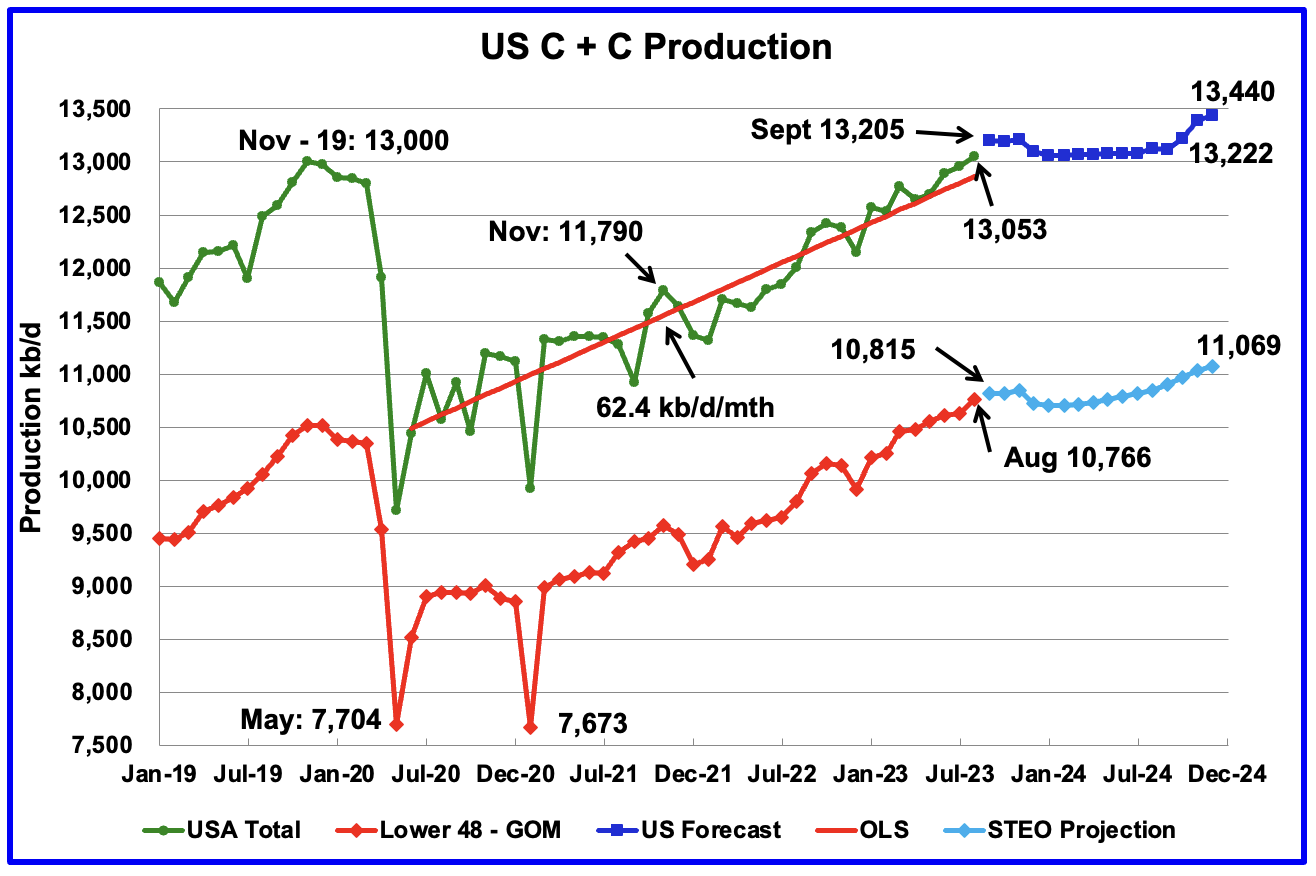
U.S. August oil production increased by 94 kb/d to 13,053kb/d, a new record high by 53 kb/d over November 2019. The increase was primarily due to increases in Texas, New Mexico and North Dakota.
The dark blue graph, taken from the November 2023 STEO, is the forecast for U.S. oil production from September 2023 to December 2024. Output for December 2024 is expected to be 13,440 kb/d which is 440 kb/d higher than the November 2019 peak of 13,000 kb/d.
The critical thing to note in this updated chart is that production is essentially flat out to October 2024 when production reaches 13,222 kb/d. Is this due to production plateauing in the Permian basin?
The light blue graph is the STEO projection for output to December 2024 for the Onshore L48.
World Oil Production Projection
World oil production in July, according to the STEO, decreased by 207 kb/d to 81,708 kb/d.(Green graph).
This chart also projects World C + C production out to December 2024. It uses the November 2023 STEO report along with the updated May International Energy Statistics to make the projection. (Red markers).
The red graph forecasts that World crude production in December 2024 will be 83,027 kb/d and is 1,556 kb/d lower than the November 2018 peak. Note that it is not known how much of the decrease is due to OPEC + reducing their voluntary production cuts. Note that Saudi Arabia reduced its output by 1 Mb/d in July. Currently, the OPEC + voluntary production cuts are in the 3,000 kb/d range.
World without the US oil output in July decreased by 419 kb/d to 68,749 kb/d. August’s output is expected to drop by 350 kb/d to 68,399 kb/d. December 2024 output of 69,587 kb/d is 3,204 kb/d lower than October 2018 output of 72,791 kb/d.
Editor's Note: The summary bullets for this article were chosen by Seeking Alpha editors.
For further details see:
July Non-OPEC And World Oil Production