KAI - Kadant: Looking For A Successful Retest Of Support Before Going Long
2023-11-24 01:09:44 ET
Summary
- Kadant Inc. reported strong growth in key financial metrics in Q3, including revenues, net income, and free cash flow, leading to an increase in full-year guidance.
- The company's shares have broken out above long-term resistance, indicating a bullish pattern and potential for further growth.
- Kadant's above-average profitability and strong free cash flow generation make it an attractive investment option at the right entry-point.
Intro
Kadant Inc. ( KAI ) is an industrial player providing products & services in its 'Material Handling', 'Industrial Processing' & 'Flow Control' segments. Typical products are vibratory equipment, ring debarkers & rotary & expansion joints to name but a few. The company came across our desk as covered Gates Industrial Corporation plc ( GTES ) recently which also is an industrial player that operates in the same industry (Industrial Machinery & Supplies & Components). Therefore, from an encouraging industry standpoint, both Kadant & Gates beat their bottom-line estimates in their recent third-quarter numbers which resulted in strong rallies in both companies post their respective announcements.
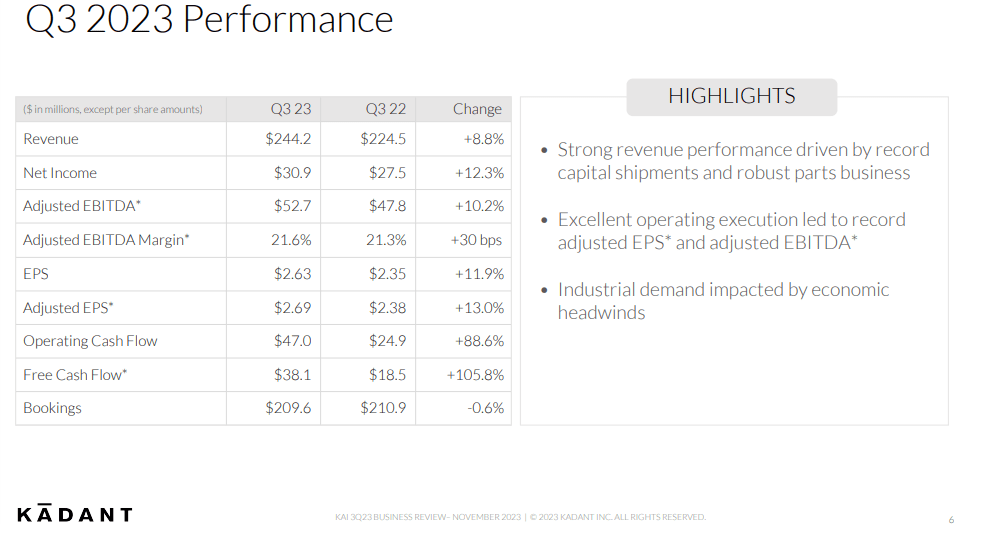
The strong rally in KAI post its Q3 results was not surprising when you delve into the numbers below. Kadant reported strong growth in key financial metrics such as revenues, net income, and free cash flow with operational execution remaining to the fore. The company's top-line growth stemmed from a significant level of capital shipments plus sustained strength in the aftermarket parts industrial segment. Underlying strength across all three segments led the CFO to increase full-year top-line guidance to approximately the $945 million level. Furthermore, adjusted EPS was guided up to approximately the $9.70 per share level. The one caveat with these updated figures is that management cannot control when its customers will order. Therefore, investors should continue to look at Kadant over a wide timeframe to ensure discrepancies regarding order flow are ironed out in due time.
Bullish Technicals
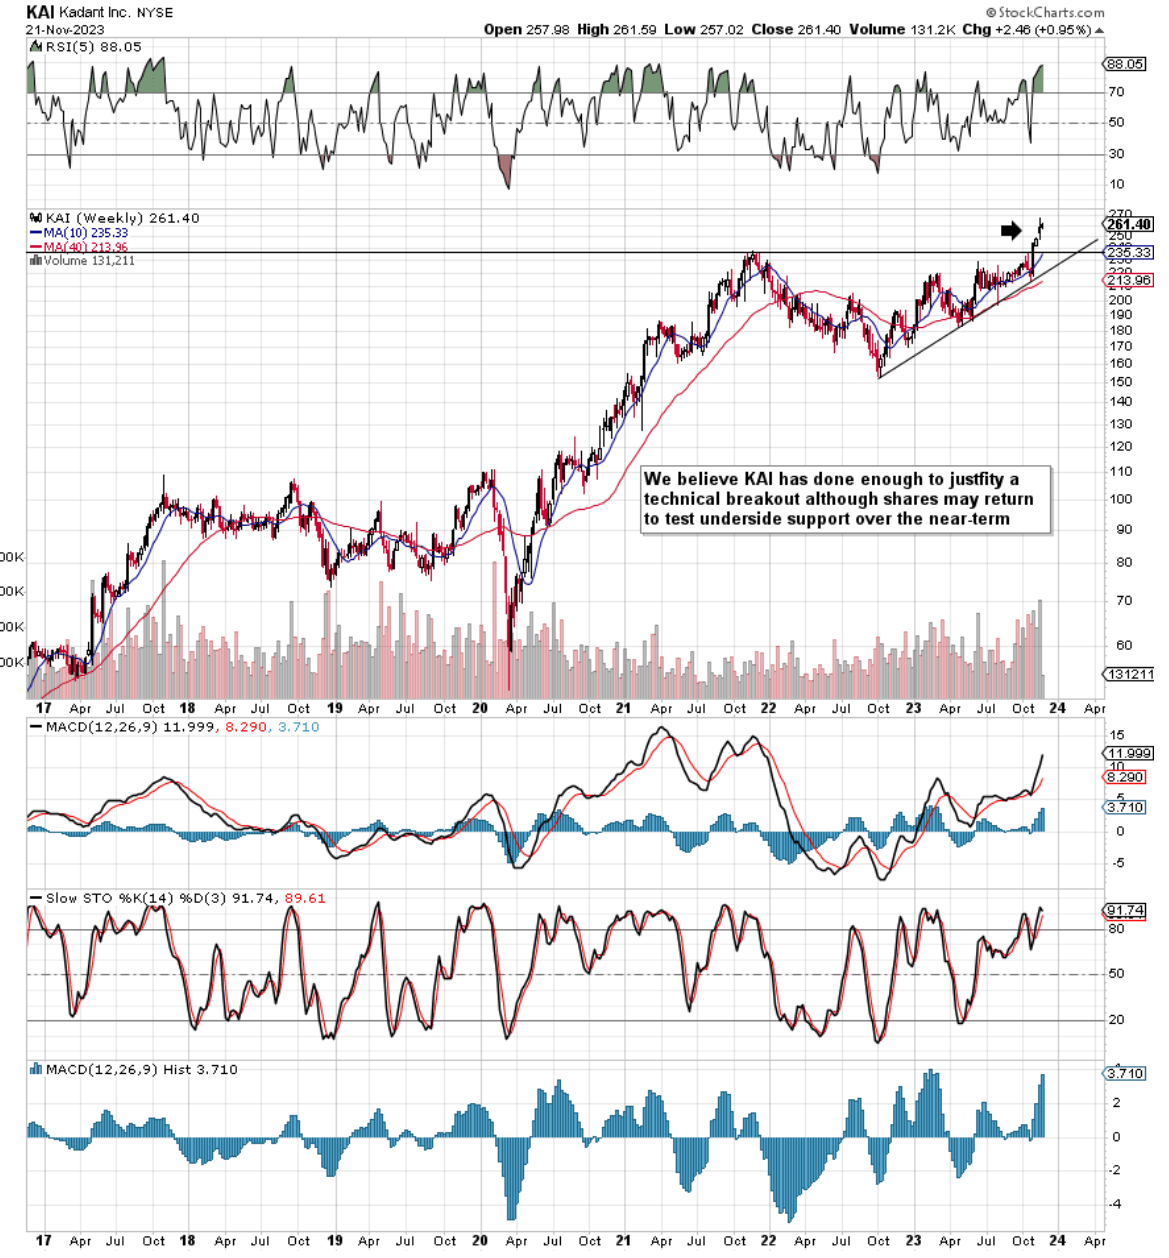
If we pull up an intermediate 5-year chart, we see that shares due to the impressive Q3 report have managed to break out above long-term resistance. Given the pattern of higher highs that took place up to that point, the pattern looks like an ascending triangle which invariably is a bullish pattern (accumulation). Suffice it to say, that given the amount of daylight between the share price and the breakout level, we believe KAI has done enough to justify the breakout. Could shares return to test underside support? Of course, but we believe (as long as current trends continue) that shares should bounce off that support level if indeed an upcoming test comes to pass. Here are two key reasons explaining our long-term bullishness in this play.
Above Average Profitability
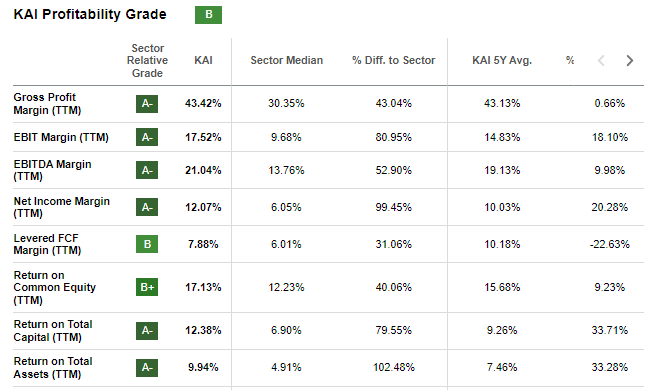
Although it is evident that Kadant's valuation multiples come in well over historic averages, it is not Kadant's fault that the market continues to love this stock. The reasoning behind this is evident in that multiple key profitability metrics continue to come in well above peers as we see below. Kadant's trailing return on capital (net income - dividends) / (debt + equity) currently comes in above 12% whereas the sector median comes in at 6.9%. However, we would wager that Kader's use of capital is even more efficient (versus its peers) for the following reasons.
When we delve into Kadant's balance sheet, we see that after the third quarter, Kadant reported $76.8 million of cash & equivalents, $384.3 million of goodwill & $161 million of intangible assets. Now when it boils down to it, although these line items contribute to the company's equity (in the traditional ROC calculation ), none of them are responsible for generating the company's profit as we stand. Therefore a more accurate picture of how well the company converts capital into profit would be to remove the above-mentioned assets which subsequently changes the denominator of the ROC formula above to 'debt + adjusted equity'. Plugging in the appropriate numbers, we get an adjusted ROC for Kadant of 44.34%.
Free Cash Flow Growth
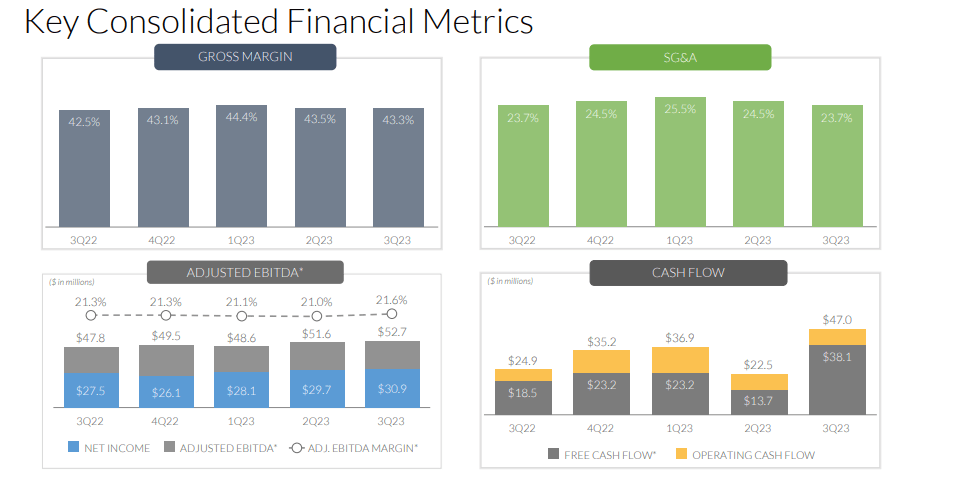
Although converting capital into profit as efficiently as possible is a large part of a company's profitability, having capital to allocate at one's disposal plays an equal role in setting up a company for success. To this point, we see bullish trends in Kadant, specifically with respect to how cash-flow generation has been changing for the better. Operating cash flow came in at a positive $47 million in Q3 which resulted in free cash-flow generation of $38 million. Suffice it to say, given the significant increase in Kadant's cash-flow generation in recent quarters, we believe trailing cash-flow multiples do not offer an accurate reflection of the company's current profitability.
Therefore, if we were to annualize Kadant's Q3 free cash-flow print over the next 12 months for example, we would get a forward free cash-flow number of $148 million. Then by dividing this projection by the number of shares outstanding (11.7 million), we would get a projected free cash flow per share of $12.64. When we divide our projected free cash flow per share ($12.64) into Kadant's prevailing share price ($262.59), we get a projected free cash flow forward multiple of 20.75.
The above multiple tells us how much each dollar of free cash flow would potentially cost Kadant over the next 12 months. Suffice it to say, a projected free cash flow multiple of just over 20 is by no means expensive and demonstrates the financial firepower Kadant continues to have at its disposal to keep building the company.
Conclusion
To sum up, given Kadant's profitability trends and free-cash-flow growth, we would become interested in this play if shares could come back down to successfully test support (Just above the $230 level). It is not the stock's fault that investors continue to love this stock. Let's see what Q4 brings. We look forward to continued overage.
For further details see:
Kadant: Looking For A Successful Retest Of Support Before Going Long