MTH - KB Home: Revenue Shrank Over The Cycle
2023-08-08 00:49:24 ET
Summary
- KB Home is a cyclical company with a strong correlation between its revenue and housing starts.
- KBH stock has not achieved any revenue growth over the past 18 years and has poor financial position and low returns.
- The valuation of KBH based on its earnings power value shows that there is not enough margin of safety for investment.
Investment thesis
From 2005 to 2022, there was a 0.76 correlation between KB Home ( KBH ) revenue and Housing Starts. Housing Starts are cyclical making KBH a cyclical company.
Over the past 70 years, there was no growth in the long-term annual average Housing Starts. At the same time, KBH did not achieve any revenue growth over the past 18 years. As such, I valued KBH based on its Earnings Power Value ((EPV)) over the cycle.
A valuation of KBH on such a basis with different gross profit margin assumptions showed that there is not enough margin of safety even under the most optimistic scenario. The other concerns with KBH are its poor financial position as well as low returns. Couple with the lack of margins of safety, this is not an investment opportunity.
Thrust of my analysis
In my article " Home Builders' Base Rates: A Reference For Better Fundamental Analysis ", I identified 9 listed home builders (panel). These are companies with available financial data from 2005 to 2022 - the latest peak-to-peak Housing Starts cycle.
For each company, I carried out the following analysis:
- Determined the performance and financial position over the cycle.
- Determined the intrinsic value over the cycle based on a DCF approach.
By using the same approach, I hope you can then compare them on an apple-to-apple basis.
I had previously determined the fundamental analysis of D.R. Horton ( DHI ), Lennar ( LEN ), M.D.C ( MDC ), M/I Homes ( MHO ), Meritage ( MTH ), NVR ( NVR ), PulteGroup ( PHM ), and Toll Brothers ( TOL ) based on their performance over the 2005 to 2022 cycle. Refer to the respective articles for the details.
This is the final article in my series to determine the cyclical values of the top 9 listed homebuilders.
Cyclical companies
Damodaran has this to say about cyclical companies:
Cyclical and commodity companies share a common feature, insofar as their value is often more dependent on the movement of a macro variable… than it is on firm-specific characteristics…the biggest problem we face in valuing companies…is that the earnings and cash flows reported in the most recent year are a function of where we are in the cycle, and extrapolating those numbers into the future can result in serious misvaluation."
To overcome the cyclical issue, we have to normalize the performance over the cycle. Damodaran suggested several ways to do this:
- Take the average values over the cycle. This is applicable for companies whose size remained about the same throughout the cycle.
- Take the current revenue and determine the earnings by multiplying it with the normalized margins. This is the preferred method if the company has grown over the cycle.
- Take the sector average over the cycle if there is not enough history for the company.
I used the second approach for all nine companies.
In looking at the performance and valuation over the cycle, I had assumed that there is no change to the long-term annual Housing Starts of 1.5 million units.
But there are many Seeking Alpha readers who believe that there is some fundamental change to this long-term annual average Housing Starts. To cater to this, I assumed that there is a 1/3 increase to 2.0 million units.
I do not have a crystal ball on how the future will unfold. As such I will value KBH under both views and let you decide what to do.
If you want to see how I came to these views as well as the pros and cons of them, refer to my previous articles.
KBH Profile
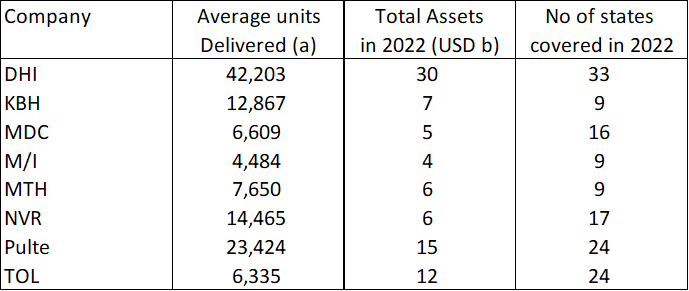
I would consider KBH as a mid-sized company among the panel. It ranked No 4 in terms of the average homes delivered over the cycle and 2022 Total Assets. Refer to Table 1.
However, it has a more concentrated geographical coverage. Its homebuilding operations span only 9 states.
Table 1: Panel Profile (Author)
Notes to Table 1:
a) 2005 to 2022 average
Like most of the panel companies, KBH has a homebuilding and financial services segment. In 2022, the homebuilding segment accounted for 99.7 % of the 2022 revenue.
2 things make KBH stands out among the panel companies. Refer to Table 2.
- It is the only one where the revenue shrank from 2005 to 2022.
- It has the lowest Return on Assets (ROA).
The lowest ROA is an eye-opener as the company had touted that its core business strategy - which it called KB Edge - is about asset efficiency, among other things.
…our KB Edge business strategy…to enhance asset efficiency…" - 2022 Form 10-K
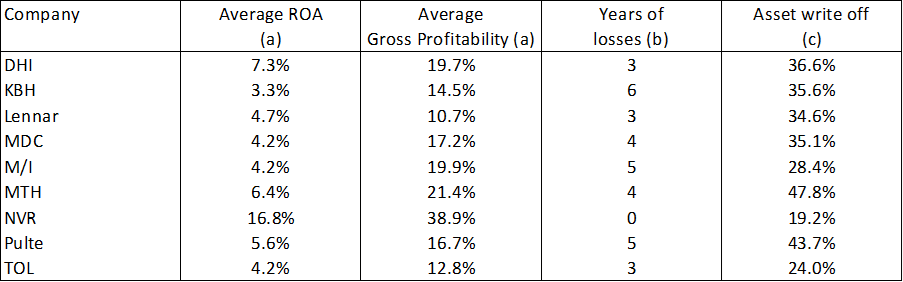
Table 2: Panel Performance (Author)
Notes to Table 2:
a) From 2005 to 2022.
b) 2005 to 2022 average.
Revenue correlation
From 2005 to 2022, there was a 0.76 correlation between KBH revenue and Housing Starts, making KBH a cyclical company.
Of the 9 panel companies, KBH was the only one where the changes in revenue almost exactly mirror the changes in the Housing Starts. From 2005 to 2022, both the Housing Starts and KBH revenue shrank at a 2% compounded rate per annum.
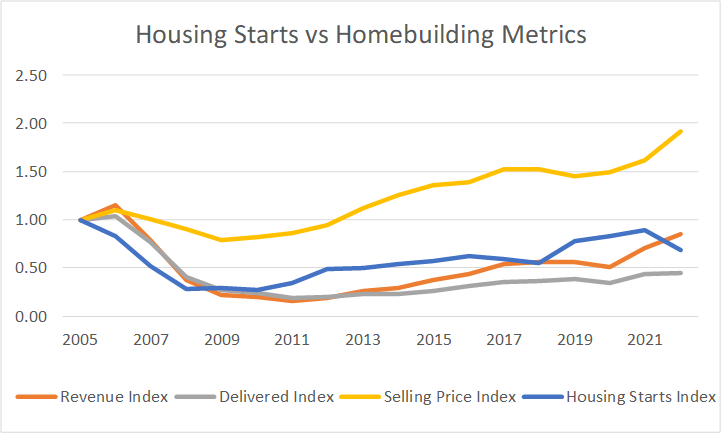
But when I dug deeper as shown in Chart 1, I found that from 2005 to 2022:
- Average selling prices grew at 3.5 % CAGR.
- The number of homes delivered shrank at 5.5 % compounded annually.
Chart 1: Correlation between Homebuilding metrics and Housing Starts (Author)
You should not be surprised by the increase in the average selling prices. This is because of the increase in the House Price Index as per Chart 2.
From 2016 to 2022, the House Price Index increased by 80%. But KBH did not fully tap into this as it only managed to achieve an increase in its average price by 38 % from 2016 to 2022.
But I am not sure whether this is because the House Price Index reflects the national situation whereas KBH only covered 9 states.
Chart 2: House Price Index (Trading Economics.com)
Performance
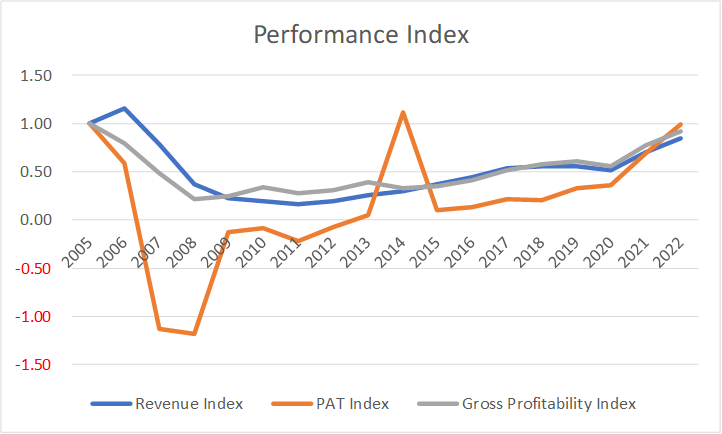
I look at 3 metrics to get an overview of the performance over the cycle - revenue, profit after tax (PAT), and gross profitability (gross profits/total assets).
Chart 3 shows the performance of KBH over the 2005 to 2022 cycle. You can see that revenue, PAT, and gross profitability for most of the cycle were lower than those in 2005.
Chart 3: KBH Performance Index (Author)
Over the 18 years cycle, KBH incurred losses from 2007 to 2012 i.e. 6 consecutive years. These were due to a combination of factors:
- Lower revenue coupled with lower gross profit margins.
- Losses from equity investments.
- Asset write-downs.
It makes you worry about how KBH will fare in the coming downtrend part of the Housing Starts cycle.
Note that the spike in PAT in 2014 was due to a one-off reversal of USD 825 million for deferred tax asset valuation allowance. Because of this and the many years of losses, you should look at the returns over the cycle rather than the past few years of results.
In this context, the return as measured EBIT(1-t) / TCE averaged 5.3 % over the past 18 years. Considering that the WACC is 7.8%, you can see that it is not an exciting performance. (Refer to the Valuation Model section for the computation and discussion)
The really interesting metric is gross profitability as this is a measure of capital efficiency. You can see that the value in 2022 is even lower than that in 2005.
While it has been able to increase its average selling price, this has not translated into improved gross profitability. It raises questions about its ability to manage costs.
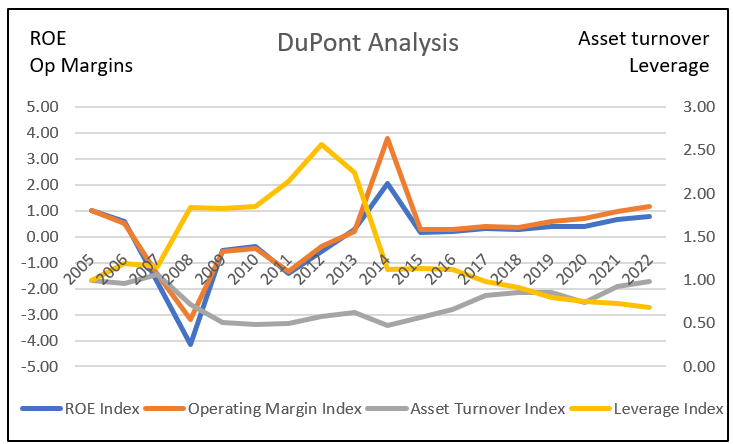
This inability to improve operating efficiency is also reflected in the asset turnover as per the DuPont Analysis. There was hardly any improvement relative to the 2005 value. Refer to Chart 4.
You must wonder about the company's ability to deliver the asset efficiency part of the KB Edge strategy.
Chart 4: DuPont Analysis (Author)
What does all this mean? When valuing KBH over the cycle, we have to:
- Account for some asset write-offs.
- Ignore any improvements in operating efficiency.
- Value it based on the EPV given its poor growth track record.
Financial position
I would like cyclical companies to be financially sound going into the downtrend leg of a cycle as I do not know how severe the downtrend will be.
I used 4 criteria to assess the homebuilders. Overall, I would rate KBH's financial position as average as it did poorly on 2 of the metrics.
As of the end of Nov 2022, KBH had USD 329 million in cash. This is about 5 % of its total assets. This is the lowest ratio for the panel that ranged from 7% to 44%.
It has a Debt Equity ratio of 0.51 at the end of Nov 2022. My base rate for the sector was a mean Debt Equity ratio of 0.41 for 2022.
Over the past 18 years, it generated an average of USD 144 million per year in Cash Flow from Operations compared to the average PAT of USD 135 million per year. This seemed to be a very good cash generation ratio. The mean Cash Flow from Operations over the same period for my base rate was USD 328 million compared to the mean PAT of USD 405 million.
Over the cycle, it managed to generate positive Cash Flow from Operations annually for 6 out of 18 years. It considered it OK at this placed it in the middle position among the 9-panel companies.
Valuation
I valued KBH based on its Earning Power Value using a single-stage Free Cash Flow to the Firm (FCFF) model.
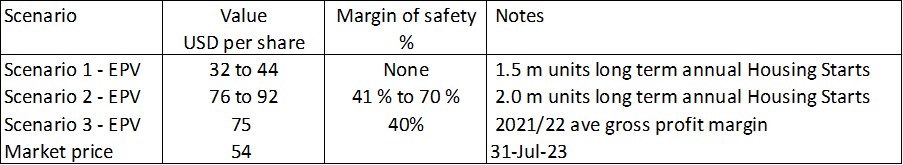
I focused on 3 Scenarios:
- Scenario 1. I assumed that 2021/22 represented the long-term annual average Housing Starts of 1.5 million units.
- Scenario 2. This assumed that the long-term annual average Housing Starts was increased to 2.0 million units.
- Scenario 3 - This assumed a non-cyclical scenario. I assumed that the 2021 and 2022 performances represented the long-term performance. As such I used the actual average 2021 and 2022 Gross Profit Margins.
Table 3 summarizes the results. There is a range for the values under Scenario 1 and 2 because I used 2 bases to estimate the annualized gross profit margins:
- The average of the annual gross profit margins from 2005 to 2022.
- The normalized gross profit margins = (sum of 2005 to 2022 gross profits) divided by the (sum of the 2005 to 2022 revenue).
Table 3: Summary of KBH Valuation and Margins of Safety (Author)
You can see that there is no margin of safety under Scenario 1.
While there is some margin of safety under Scenario 3, I do not consider this realistic since it assumes that KBH is not a cyclical company.
My target is for a 30% margin of safety. You may think that there is some margin of safety under Scenario 2. But this assumes that we are currently at 2.0 million units of Housing Starts. We know that this is not so.
If we assumed that it will take another 5 years to reach the 2.0 million units, the intrinsic value reduces to USD 52 per share to USD 64 per share i.e. zero to 19% margin of safety. This is below my 30 % target.
Overall, there is either no or not enough margin of safety under all the three Scenarios.
Valuation model
In valuing KBH, I modeled it as comprising a homebuilding and financial services operations.
For the homebuilding segment, the key earnings driver was gross profits. This was derived from the equation, Gross Profits = Delivered units X Average Selling Price X Cyclical Gross Profit Margins. The Cyclical Gross Profit Margins were assumed to be the average 2005 to 2022 Gross Profit Margins (normalized margins).
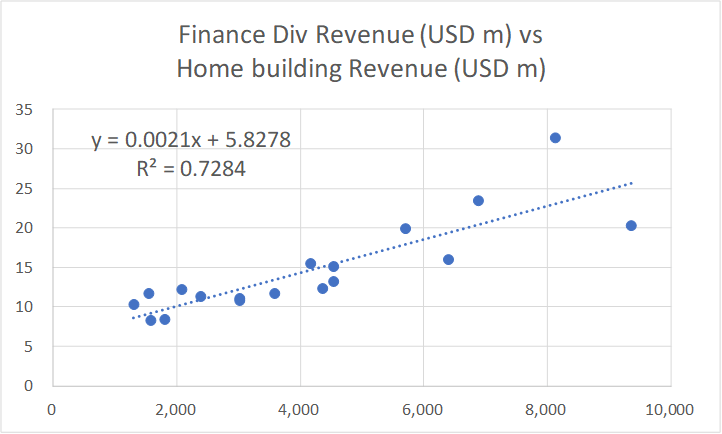
I modeled the revenue for financial services operation based on a linear regression equation. The equation linked the revenue of the financial services operations with that of the homebuilding. This was derived using the EXCEL plotting function as illustrated in Chart 5.
- Revenue for the homebuilding operations was the independent variable.
- Revenue for the financial services operations was the dependent variable.
Chart 5: Link between Finance Services Revenue and Homebuilding Revenue (Author)
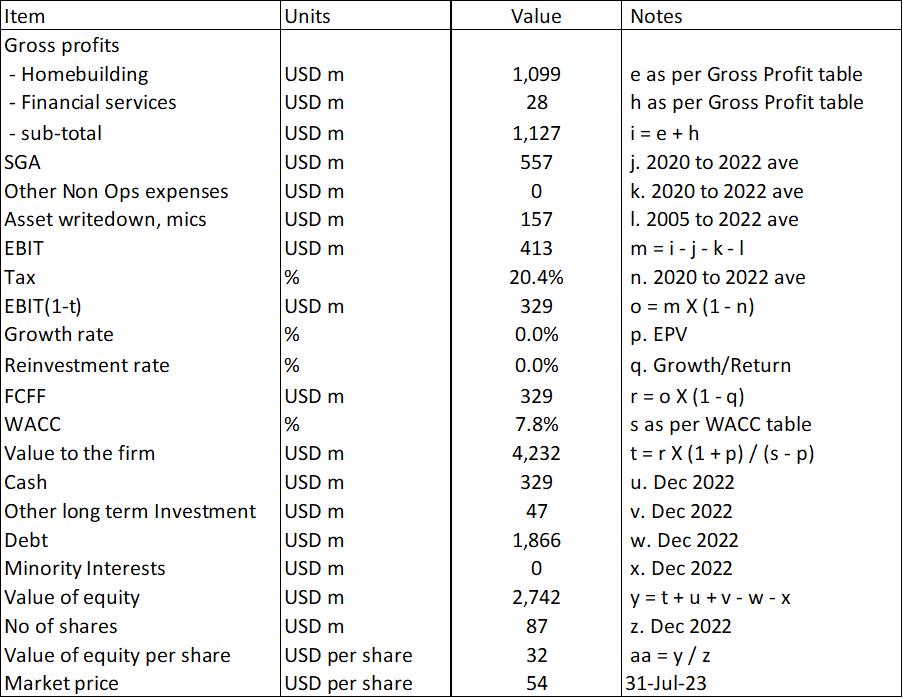
I then valued KBH as follows:
Value of the operating assets of the firm = FCFF X (1 + g) / (WACC - g)
Where:
FCFF = EBIT X (1 - t) X (1 - Reinvestment rate)
g = growth rate = 0 for EPV case.
t = tax rate based on the past 3 years' average rate.
WACC = weighted average cost of capital derived from the first page of a Google search for the term "KBH WACC" as summarized in Table 4.
Table 4: Estimating the WACC (Various)
The Reinvestment rate was derived from the fundamental growth equation
Growth = Reinvestment rate X Return. Since the growth was assumed to be zero, the Reinvestment rate is then zero.
EBIT = Gross profits - Selling, Admin, and Selling or SGA expenses - Other expenses and asset write-downs
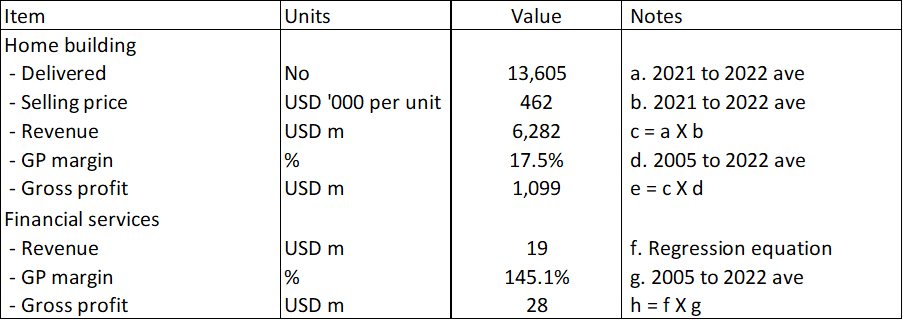
Gross Profits
The Gross Profits for KBH were derived as shown in Table 5. The key assumption here is that the sector was operating at the long-term annual average Housing Starts in 2021/22. As such the average 2021/22 Delivered units and Average Selling Price represented the cyclical performance.
Table 5: Deriving the Gross Profits (Author)
The Gross Profits for the homebuilding operations = Delivered units X Average Selling Price X Gross Profit Margins.
The Gross Profits for the financial services operations = Revenue X Gross Profit Margins.
The cyclical Gross Profit Margins for both operations were assumed to be 2005 to 2022 average values.
Sample calculation
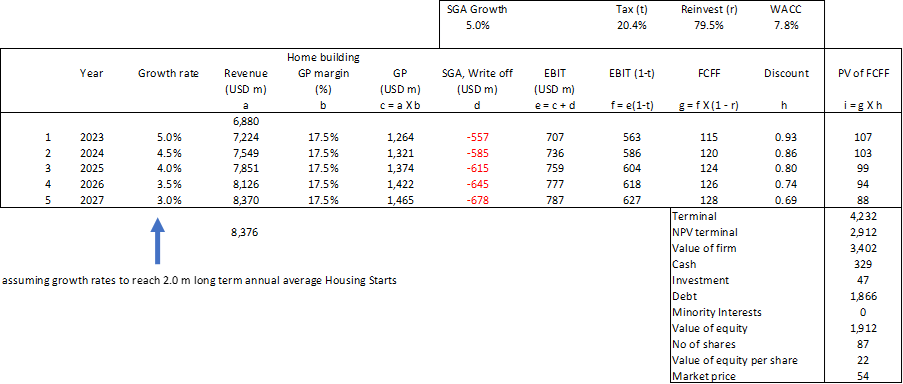
Table 6 shows a sample calculation for the intrinsic value.
Table 6: Calculating the intrinsic value (Author)
2-stage FCFF model
I used this model to determine the value assuming that it would take another 5 years to reach the 2.0 million long-term average annual Housing Starts. The key assumptions were:
- The annual growth rates for the next 5 years we set such that the 2022 revenue grew to that based on the 2.0 million Housing Starts.
- The terminal value was assumed to be the value to the firm based on 2 million Housing Starts as per Scenario 2.
- The discount rate was the same as the average shown in Table 4.
Table 7. Two-stage valuation model (Author)
Notes to Table 7:
a) Starting with 2022.
b) Based on 2005 to 2022 average.
c) a X b.
d) Assumed 5% growth rate based on 2020 to 2022 average
Risks and limitations
I would summarize the risks and limitations of my valuation into 3:
- WACC.
- Small geographic spread.
- Low returns.
The discussions on the WACC are similar to those for the other companies that I have covered. As such I would not repeat them. Refer to my other articles.
The trust of my analysis is that there is a strong correlation between the company's revenue and Housing Starts. KBH operates in only 9 states and looking at the correlation with the national Housing Starts may not show an accurate picture. A more realistic picture would be to use some weighted regional Housing Starts to identify the peak-to-peak period.
Over the period from 2025 to 2022, the return as measured by the average EBIT/TCE was only 6.6 % where:
TCE = Total Capital Employed = Equity + Debt - Cash - Long Term Investments.
After accounting for 20% tax we have EBIT(1-t)/TCE as the return measure for the firm = 5.3 %. This is lower than the WACC of 7.8%.
The company cannot be creating shareholders' value if the return is lower than the cost of funds. You can argue that we are not comparing apple-to-apple as the cost of funds is not a cyclical one. However, the gap is about 30%. As such I still have concerns about its ability to generate returns that far exceed its cost of funds.
Conclusion for KBH
KBH is a cyclical company. Any analysis, and valuation of KBH should be based on its performance over the cycle.
I assumed that the cycle is represented by the 2005 to 2022 performance. This is pegging it to the latest peak-to-peak Housing Starts cycle.
The EPV of KBH on such a basis showed that there is no margin of safety under all the 3 Scenarios.
Furthermore, I have concerns about KBH's fundamentals:
- It has not been able to deliver the asset efficiency part of its KB Edge strategy. There was no improvement in gross profitability and asset turnover.
- It has not been able to achieve a return over the cycle that is greater than the cost of funds.
- Financially it is not in the strongest position.
I would not invest in KBH from both the margin of safety and business fundamentals perspective.
I am a long-term value investor and my analysis and valuation are based on the long-term prospect of a company. This is not an analysis for those seeking to make money over the next few weeks or months.
Panel Best
I have now completed the analysis of all the 9-panel companies. I wanted to pull them together to see:
- Which is the best from the fundamental perspective.
- Which has the best margins of safety.
The ideal is to find one that is the best on both counts.
Fundamentals
In terms of fundamentals, I looked at two groups of metrics - performance and financial strengths. Refer to Tables 8 and 9.
Table 8. Panel Performance (Author)
Notes to Table 8:
a) 2005 to 2022 average.
b) From 2005 to 2022.
c) 2007 to 2009 write-off as % of 2007 total asset
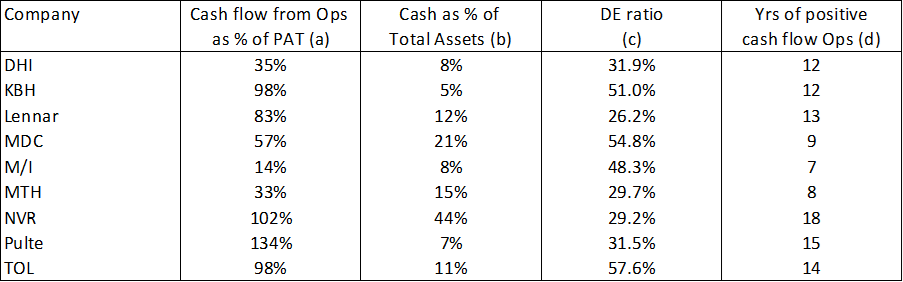
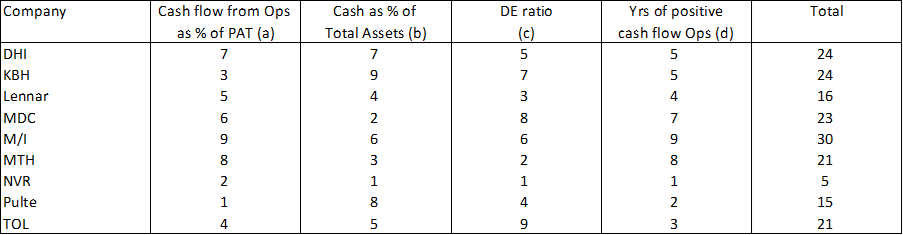
Table 9: Panel Financial Strengths (Author)
Notes to Table 9:
a) 2005 to 2022 average.
b) 2022 cash and short-term investments as % of 2022 total assets.
c) 2022.
d) Number of years with positive cashflow from Ops from 2005 to 2022.
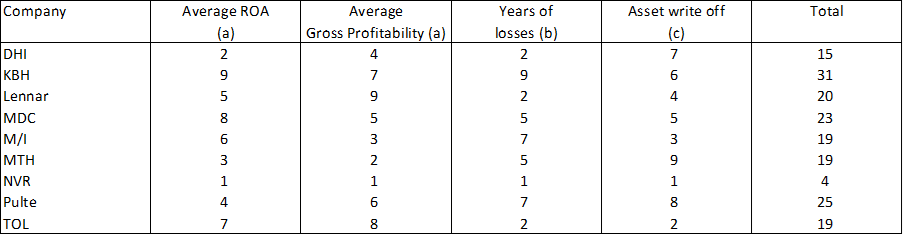
To get an overall picture, I ranked each of the above metrics from best (score of 1) to worst (with a score of 9). Note that for some metrics, the best is the lowest value (e.g. DE ratio) while for others the best is the highest value (e.g. ROA).
I then added the individual rank score to arrive at the total for each company. The best company is the one with the lowest total rank score.
The rank scores for the Panel Performance and Panel Financial Strengths are shown in Tables 10 and 11.
You can see that based on the total rank score, NVR was far ahead of the others.
Table 10: Ranking of Panel Performance (Author) Table 11: Ranking of Financial Strengths (Author)
Margins of safety
I compared the panel based on 2 Scenarios:
- Scenario 1 assuming that we have 1.5 million long-term annual average Housing Starts
- Scenario 2 assuming there is a 1/3 uptick in the long-term annual average Housing Starts to 2.0 million units. However, it would take another 5 years to reach this level.
The results are summarized in Table 12.
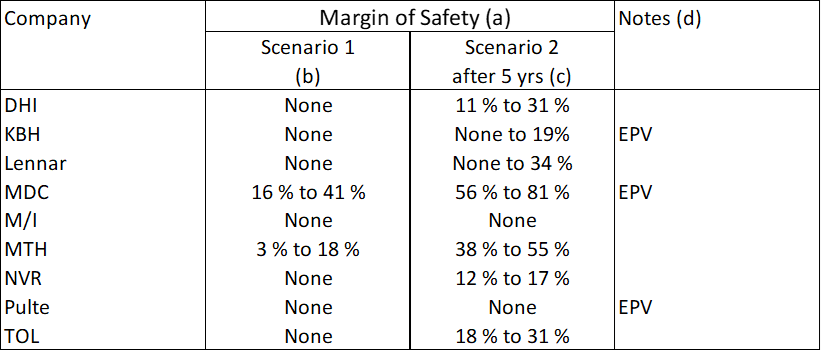
Table 12: Panel Margins of Safety (Author)
Notes to Table 12:
a) Based on the market prices at the time of the respective articles (Jun to Aug). The range is due to the 2 ways to estimate the gross profit margins.
b) Based on 1.5 m Housing Starts.
c) Assuming it will take 5 years to reach the 2 m Housing Starts. Note that in some of the earlier articles, I did not show these values.
d) Unless stated otherwise, the value is based on the FCFF model incorporating growth.
You can see that although NVR has the best fundamentals, it does not have the best margin of safety.
MDC has the best margin of safety from both Scenarios perspectives. However, when you consider fundamentals, MDC is ranked No 7.
I must admit I am a bit disappointed in not being able to find a company that is the best on both fundamentals and margin of safety. But I am a long-term value investor and my priority is the margin of safety. I am ambivalent about the Graham or Buffett styles when it comes to "quality". As such I would pick MDC.
For those who want a margin of safety as well as a good performance, MTH comes to mind. It has some margins of safety and is in the middle ranking when looking at the performance and financial strengths together.
For further details see:
KB Home: Revenue Shrank Over The Cycle