KCE - KCE Vs. IAI: Which Capital Markets ETF Is The Better Buy?
2023-07-21 16:18:27 ET
Summary
- KCE and IAI are two Capital Markets ETFs that have outperformed the broader Financial Services sector over the last 17 years. Expense ratios are 0.35% and 0.39%, respectively.
- KCE is equal-weighted while IAI is market-cap-weighted and highly concentrated in just a few names, including Morgan Stanley and Goldman Sachs.
- In years when IAI outperformed, it did so substantially, so long-term investors might prefer IAI. However, I caution that Wall Street analysts are bearish on its constituents.
- The growth and valuation combination of either ETF isn't attractive at the moment, so it might be better to stick with a broad-based fund like IYF until the market stabilizes. This article includes a fundamental comparison of all three ETFs for your consideration.
Investment Thesis
Today's article compares the equal-weighted SPDR S&P Capital Markets ETF ( KCE ) with the market-cap-weighted iShares U.S. Broker-Dealers & Securities Exchanges ETF ( IAI ), two funds with 17+ year track records that have outperformed the iShares U.S. Financials ETF ( IYF ) since June 2006. While both appear suitable alternatives to broad-based Financial funds, this article will evaluate each ETF's past performance and fundamentals to pick a winner.
ETF Overview
Strategy Discussion and Top Ten Holdings
KCE tracks the performance of the S&P Capital Markets Select Industry Index , providing equal-weight exposure to U.S. securities in three sub-industries: Asset Management & Custody Banks, Financial Exchanges & Data, and Investment Banking & Brokerage. Diversified Capital Markets are technically eligible, but none are currently included. To qualify, stocks must be a member of the S&P Total Market Index and meet one of the following criteria:
- Be a current constituent with a float-adjusted market cap above $300 million and a float-adjusted liquidity ratio above 50%.
- Have a float-adjusted market cap above $500 million and a float-adjusted liquidity ratio above 90%.
- Have a float-adjusted market cap above $400 million and a float-adjusted liquidity ratio above 150%.
The float-adjusted liquidity ratio is calculated by dividing a stock's annual total dollar traded value by its float-adjusted market cap. There are also some buffer rules to consider, which interested investors can read more about here .
IAI tracks the Dow Jones U.S. Select Investment Services Index, providing market-cap-weighted exposure to Investment Services stocks according to a proprietary classification system. Minimum requirements include a $250 million float-adjusted market cap for current constituents and $500 million for new ones. Finally, the same three GICS sub-industries for KCE apply to IAI, but with substantially different exposures. The breakdown is as follows:
- Asset Management & Custody Banks: KCE (45.35%), IAI: 0.24%.
- Financial Exchanges & Data: KCE (22.33%), IAI: 21.10%.
- Investment Banking & Brokerage: KCE (32.32%), IAI: 78.66%.
KCE is the more balanced fund, while IAI focuses primarily on Investment Banking & Brokerage stocks like Morgan Stanley ( MS ) and Goldman Sachs ( GS ). Furthermore, since it's market-cap-weighted, these two holdings total 39% of the fund, with Morgan Stanley's 20% allocation pushing the Index's cap rules of 22.5% per constituent. There is also a rule limiting the aggregate weight of companies with percentages greater than 4.5% to 45%. That limit has been exceeded, so an adjustment should occur at the next quarterly rebalancing. You can view the methodology here .
KCE Top Ten Holdings
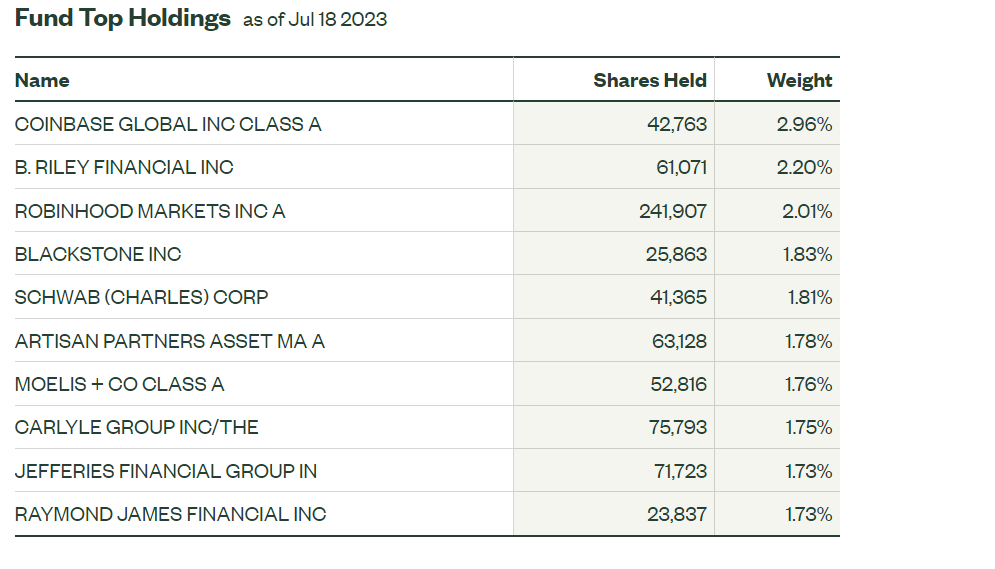
KCE's top ten holdings are listed below, totaling 19.56% of the fund. There are 65 holdings in total, so each stock has a 1.54% weighting under normal circumstances. However, Coinbase Global ( COIN ) has rallied 196% this year, and B. Riley Financial ( RILY ), Robinhood Markets ( HOOD ), and Blackstone Group ( BX ) are also trading near their 52-week high prices.
IAI Top Ten Holdings
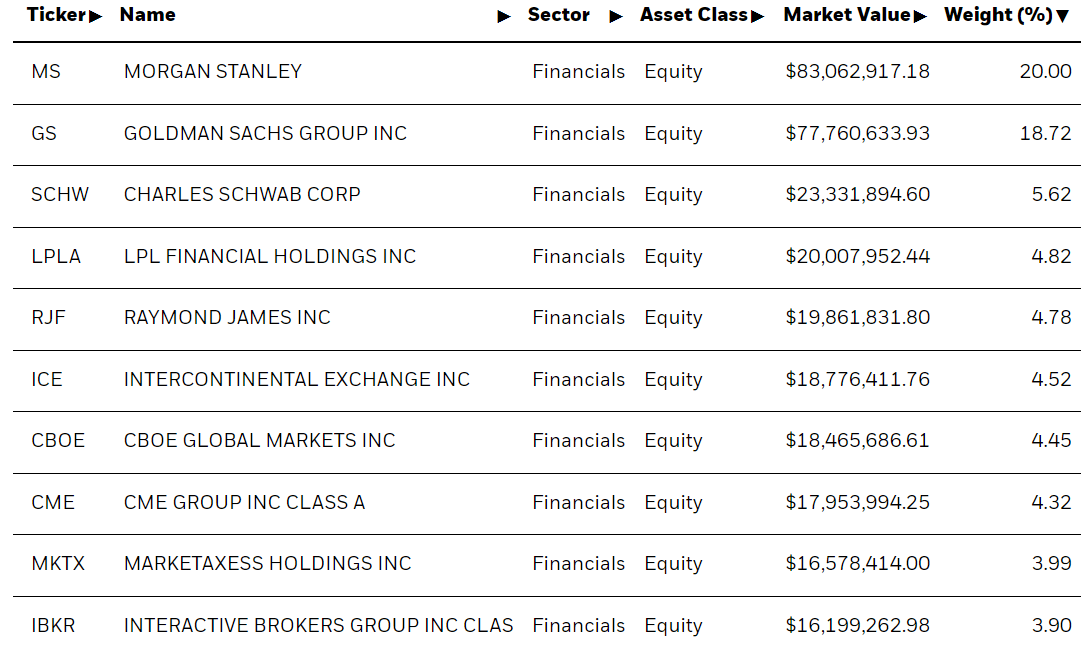
IAI's top ten holdings are next, which total 75.12% of the fund. It's so concentrated that investors might consider holding these stocks individually rather than paying IAI's 0.39% expense ratio. In this sense, KCE makes more sense because at least you get a well-diversified portfolio.
In addition to Morgan Stanley and Goldman Sachs, Charles Schwab ( SCHW ), LPL Financial Holdings ( LPLA ), and Raymond James ( RJF ) round out IAI's top five. These all operate in the Investment Banking & Brokerage industry. The next four are in the Financials Data & Exchange industry, followed by Interactive Brokers Group ( IBKR ), one of 19 of IAI's brokerage stocks.
Performance Analysis
KCE and IAI Returns Since June 2006
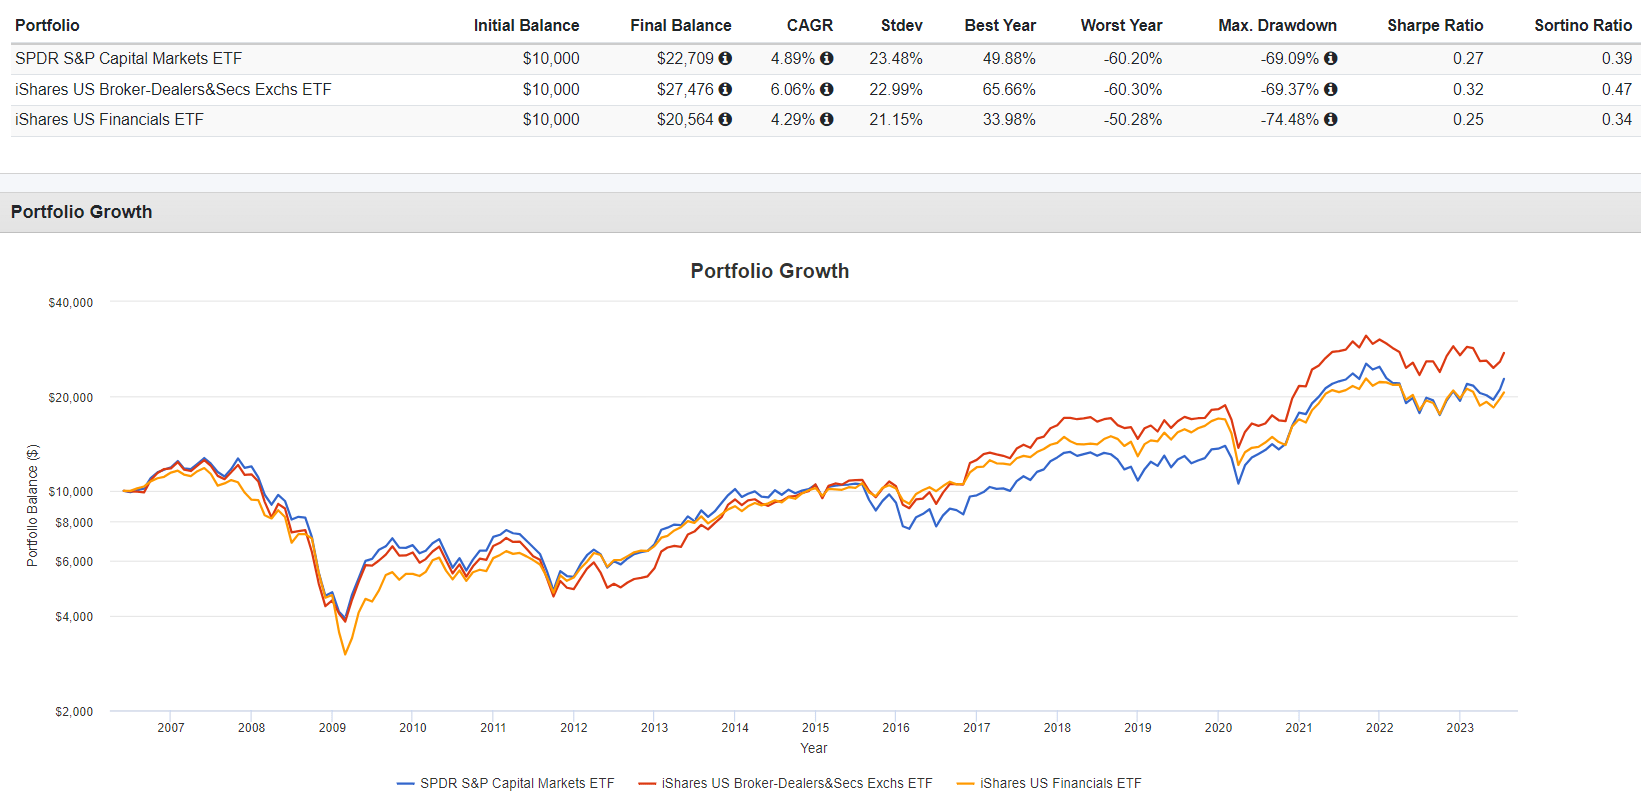
The following chart shows how the Capital Markets segment has outperformed the broader U.S. Financials sector since June 2006, the first month following IAI's launch. KCE and IAI gained an annualized 4.89% and 6.06% compared to 4.29% for IYF. Volatility was higher, but its risk-adjusted returns (Sharpe and Sortino Ratios) were better.
Despite a lower total return, KCE outperformed IAI 10/18 times between 2006-2023. The main reason is that in years when IAI outperformed, it did so by 8.72% on average compared to 5.21% for KCE. Still, it's hard to pin down any pattern. IAI beat KCE by 12.75% per year between 2013-2016 but lagged by 11.62% in 2020 and another 15.78% YTD in 2023.
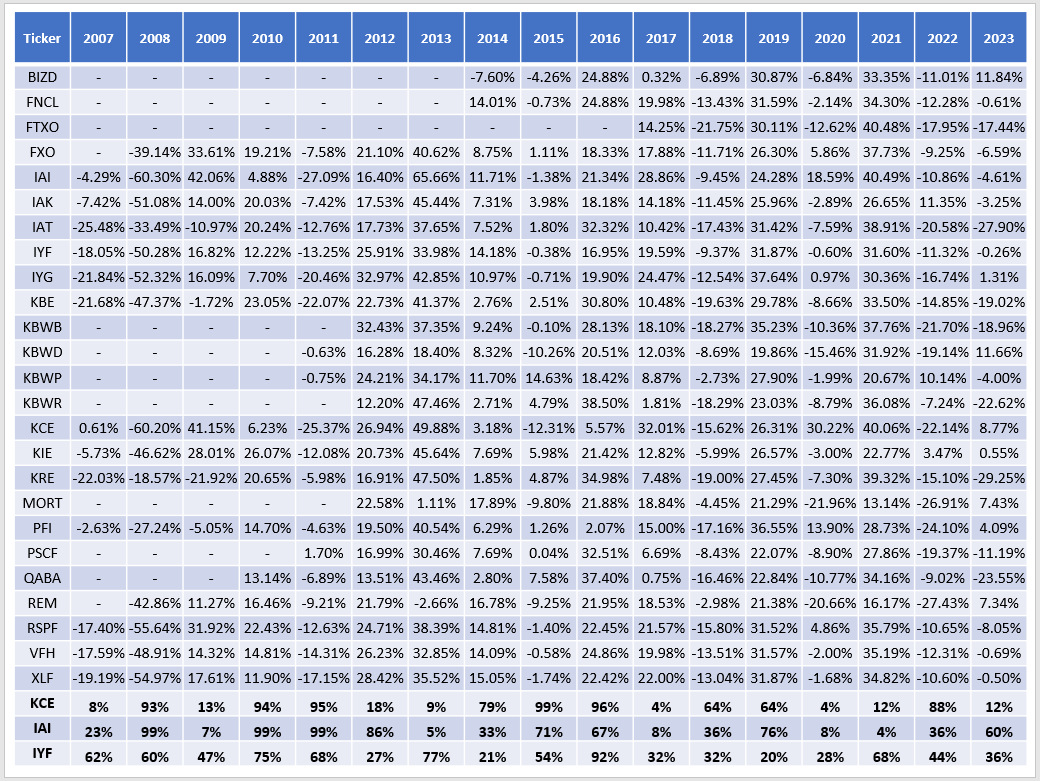
Comparisons with IYF are even more challenging to figure out. IYF was easily beating KCE before the pandemic, before KCE beat by 30.82%. More analysis is required, so I've also compared both Capital Markets ETFs against other peers in the Financial sector. Please see the chart below for the results by year, including percentile rankings in the bottom rows.
This view helps us understand when Capital Market ETFs do well and when they struggle. For example, KCE and IAI were among the worst performers in 2008, 2010, and 2011. Add 2015, 2016, and 2022 in the case of KCE, too. In contrast, both performed in the top quartile in 2009, 2013, 2017, 2020, and 2021. Very few times were either an average performer, which means that investors should either have a long-term time horizon and be able to withstand substantial underperformance in a given year or can reasonably predict bull and bear markets. The latter is a challenge, but evaluating fundamentals and market sentiment can help, so let's look at that next.
KCE Fundamentals
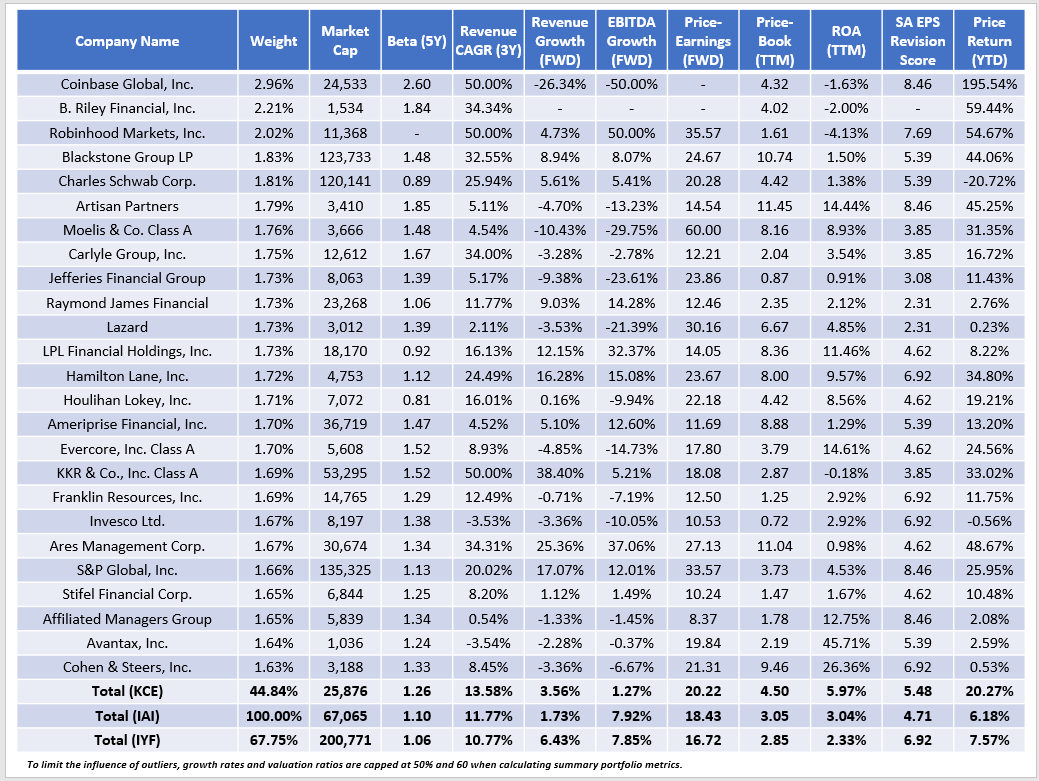
The following table highlights selected fundamental metrics for KCE's top 25 holdings, totaling 45% of the fund. Since it's an equal-weight ETF, these merely are the best performers since the latest quarterly rebalance. Therefore, the summary metrics at the bottom are more useful and representative of the entire ETF.
KCE is better diversified than IAI but is also more volatile, as indicated by its 1.26 five-year beta. The driving force is that KCE holds 32/66 Asset Management & Custody Bank stocks, typically smaller (~$21 billion market cap) with higher betas. Examples in the table above include Artisan Partners ( APAM ) and Carlyle Group ( CG ), which are unlikely to have high weights in other Financial ETFs.
While diversification is KCE's strong suit, it does not have an attractive growth and valuation combination. Analysts expect just 3.56% and 1.27% sales and EBITDA growth over the next twelve months, compared to 1.73% and 7.92% for IAI. Also, KCE trades at 20.22x forward earnings and 4.50x book value, 1-2 points more than IAI. On EPS Revisions, KCE's 5.48/10 score isn't great, but it's substantially better than IAI's 4.71/10 score. Let's see what's driving IAI's poor score next.
IAI Fundamentals
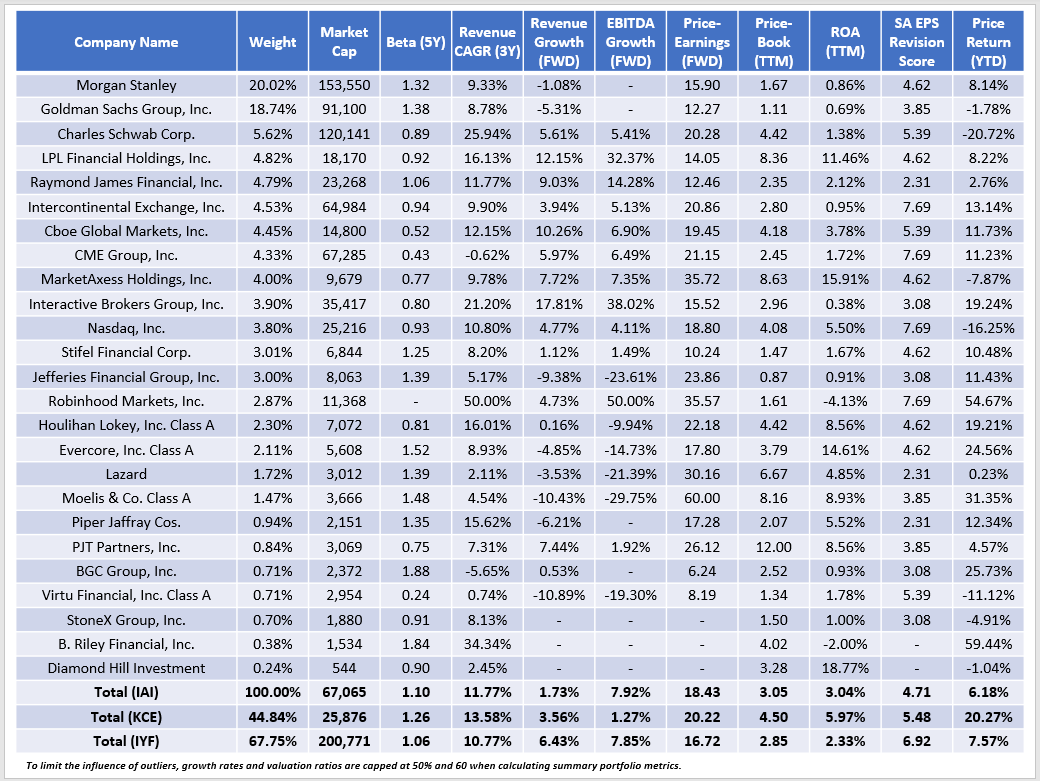
The following table highlights the same metrics for IAI's top 25 holdings, which total 100% of the fund. As mentioned, stocks with weightings above 4.5% easily exceed the limit, so I expect these allocations to change soon.
There isn't one stock that's driving the poor EPS Revision Score. Instead, analysts are bearish on nearly all of IAI's holdings. For example, Morgan Stanley's EPS Revision Grade is a "C-," with all analysts revising downward sales and earnings estimates for the upcoming quarter. The company's CEO described the current harsh macroeconomic environment in the latest earnings call earlier this week, summing it the company's Q1 challenges as follows:
- Navigating the regional banking crisis.
- Political uncertainty related to the U.S. debt ceiling.
- The impact of higher rates and when they will plateau.
- The strained relationship between the United States and China.
One concern is Morgan Stanley's shrinking return on tangible common equity, a standard bank metric. It declined to 12.1% in Q2 2023 vs. 16.9% in Q1 2023 and 13.8% in Q2 2022, with $300 million severance accounting for approximately 1.4% of the change. The company is focused more on the stable wealth management segment, reporting $90 billion in net new client assets, though revenues from investment banking were virtually unchanged from a year ago.
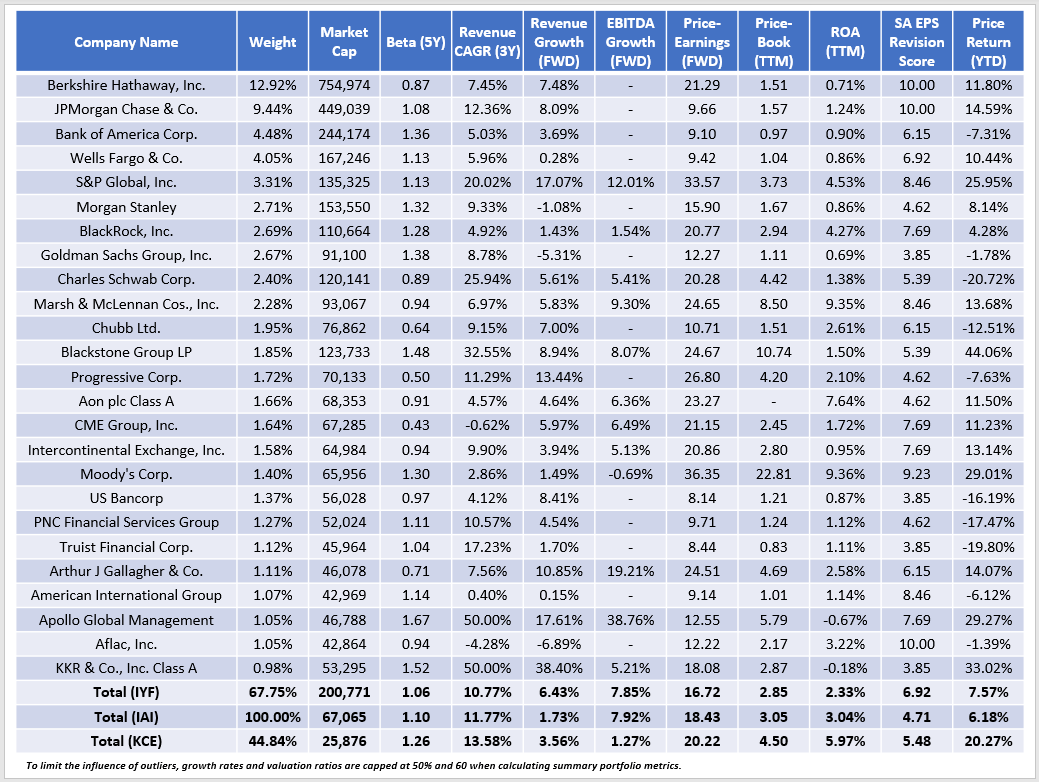
In my view, the easiest solution is to own IYF. I know it's lagged over the long run, but the growth and valuation combination is currently superior, and there isn't the same earnings momentum as with KCE and IAI. IYF is led by Berkshire Hathaway ( BRK.B ) but also includes the largest diversified banks like JPMorgan Chase ( JPM ), Bank of America ( BAC ), and Wells Fargo ( WFC ). I've listed the ETF's fundamentals below for your reference.
Investment Recommendation
Based on their extensive track records, I'm inclined to choose IAI as the winner over KCE. It underperformed more frequently (10/18 years), but in the years when it did outperform, it did so by a substantial margin. However, I'm discouraged by its poor earnings revision score, which reflects the challenges facing the entire investment banking industry. Furthermore, it's highly concentrated in just a few companies like Morgan Stanley, Goldman Sachs, and Charles Schwab. The better play might be to hold one or two of those stocks to complement a broad-based Financial ETF like IYF and save on the ETF's 0.39% expense ratio. Thank you for reading, and I look forward to discussing these funds more in the comments section below.
For further details see:
KCE Vs. IAI: Which Capital Markets ETF Is The Better Buy?