SJM - Kellanova And WK Kellogg Co: 2 Radically Different But Tasty Companies
2023-10-04 14:54:39 ET
Summary
- Kellogg completed the separation of its North American cereal business, rebranding the majority of its assets as Kellanova and the North American business as WK Kellogg Co.
- Kellanova focuses on snack products, with snacks representing 60% of overall revenue and annualized growth of 8%.
- WK Kellogg Co, the North American cereal business, prioritizes margin expansion over growth and is trading at a discount compared to similar firms.
- Both companies offer investors with distinct prospects, and both warrant optimism from the right kind of investor.
October 2, 2023 ended up being a very interesting day for shareholders of food giant Kellogg. This is because, on that day, the management team at the company announced that the firm finally completed the separation of its North American cereal business from the rest of the food producer. This resulted in the bulk of the company's assets, operating under the original company known as Kellogg, being rebranded as Kellanova ( K ), while the North American cereal business has been branded as WK Kellogg Co ( KLG ). Spin offs can be truly confusing times for market participants, particularly those who own shares of the spinoff. But they can also open up doors of opportunity for those shareholders to either allocate capital where they think it is most likely to generate the risk adjusted returns that they want or to increase exposure to both new enterprises.
In what follows, I've decided to look at both of these companies in order to see what kind of upside potential, if any, might exist. And what I found is that both enterprises have significant differences that might make one a good pick for one type of investor and the other a good pick for another type. But at the end of the day, the value investor in me has decided to rate both enterprises a ‘buy’.
Hello Kellanova
As part of the spinoff of the North American cereal business, shareholders of what was once Kellogg, but that is now rebranded as Kellanova , get to keep not only their existing shares of that parent company. They also ended up receiving one share of WK Kellogg Co for every four shares of Kellogg that they previously owned. But before we get into the North American cereal business, it would be helpful to dig into Kellanova simply because it represents the vast majority of the assets of Kellogg before the spinoff occurred.
To best understand why a spinoff occurred to begin with, it's helpful to understand the objective that management set out to achieve. As with many large companies with many moving parts, there were certain business lines of Kellogg that demonstrated attractive growth in the past and that would likely continue to grow in the long run. At the same time, there were also business lines that likely would see only modest growth in the future. By splitting up the high growth prospects from the low growth ones, the management teams of both firms can give said firms the attention and resources needed in order to optimize shareholder returns. After all, the needs of a high growth company are different than a low growth company. A high growth company should be focused on expanding its top line as quickly as possible, obviously without sacrificing its margins if possible. A low growth enterprise, meanwhile, should be less focused on growth and should, instead, be focused on ways to increase margins.
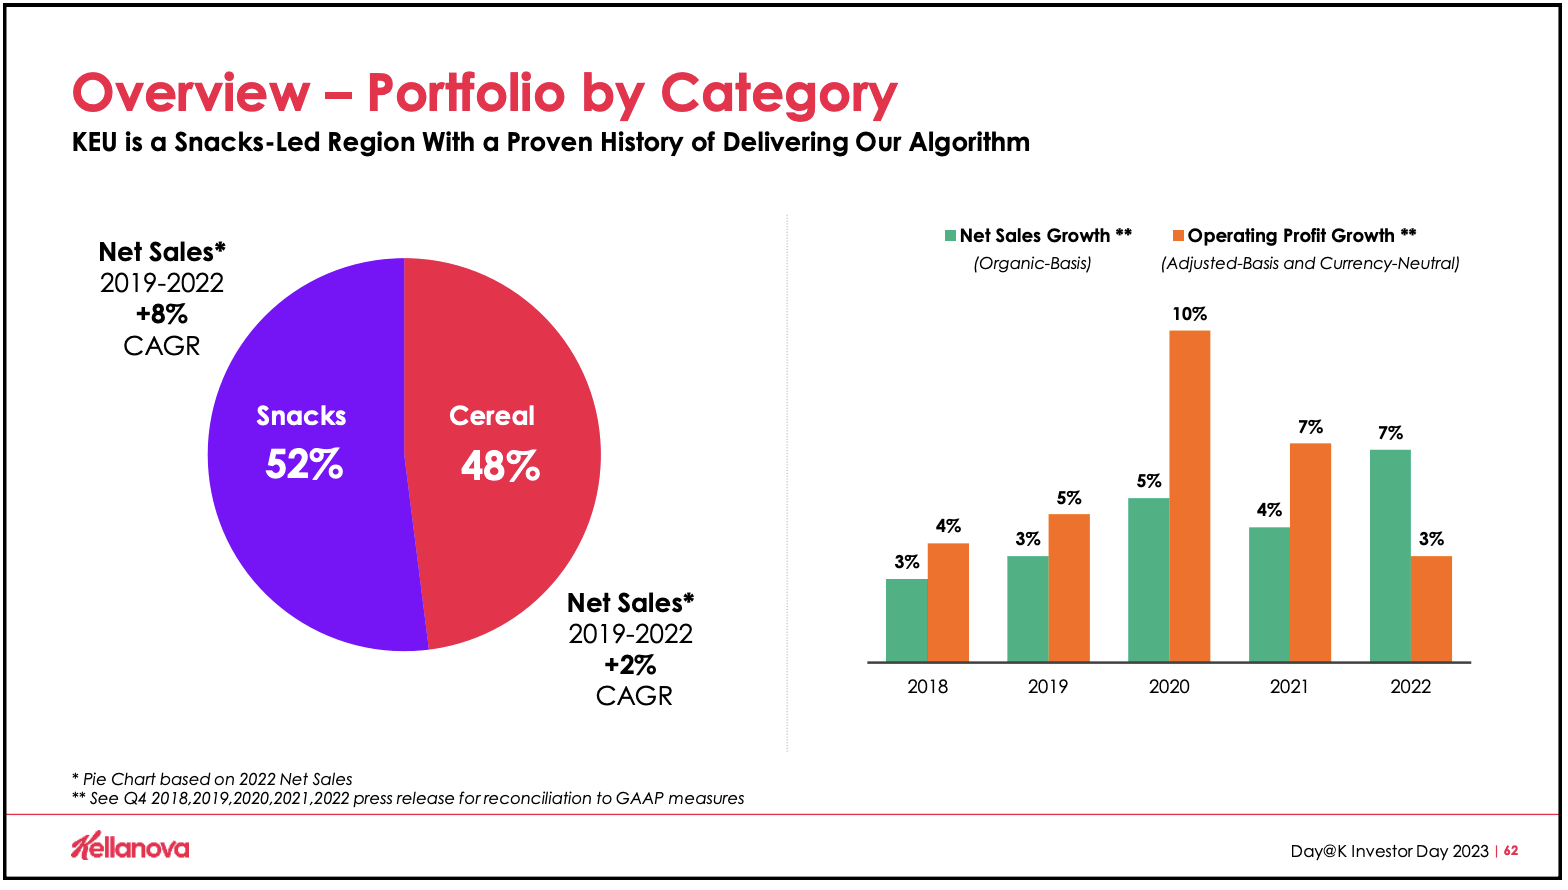
The business that is now called Kellanova has been structured to achieve that growth as best as management deemed possible. As you can see in the image above, the overwhelming majority of the revenue associated with Kellanova involves its line of snack products. Using data from 2022, snacks represent about 60% of overall revenue for the company. And in the years between 2019 and the end of 2022, this line of products experienced annualized revenue growth of 8%. The noodles and other category represents a far smaller 9% of sales. However, it grew at an annualized rate of about 25% during the same window of time. I wouldn't exactly call the international cereal and frozen foods operations fast growing, with annualized growth of 5% and 2%, respectively, but it won't be long until you see why these were included with the growth category products.
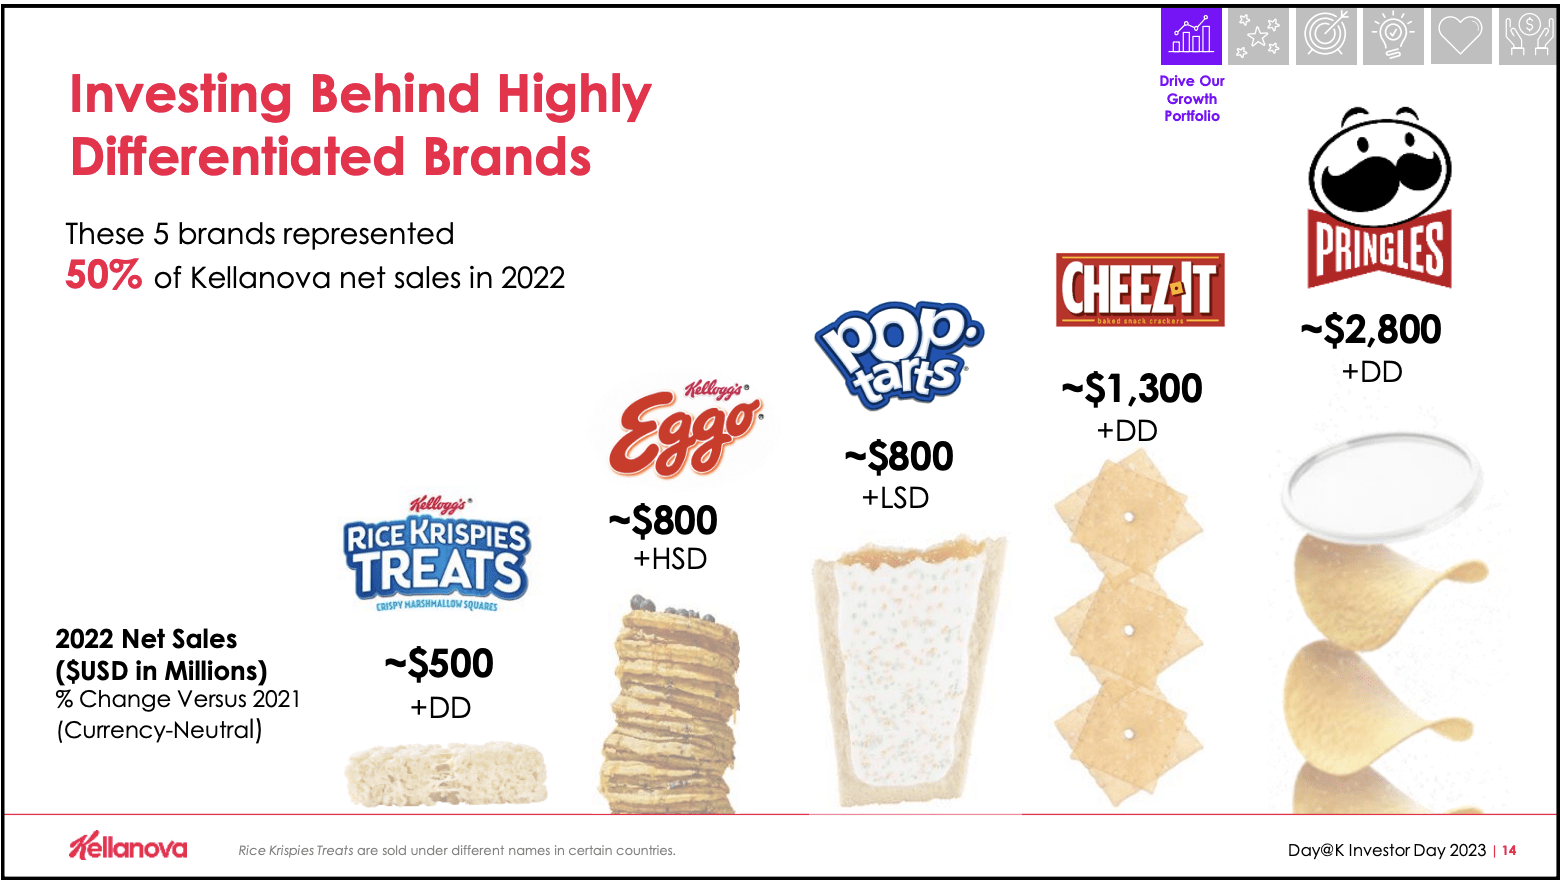
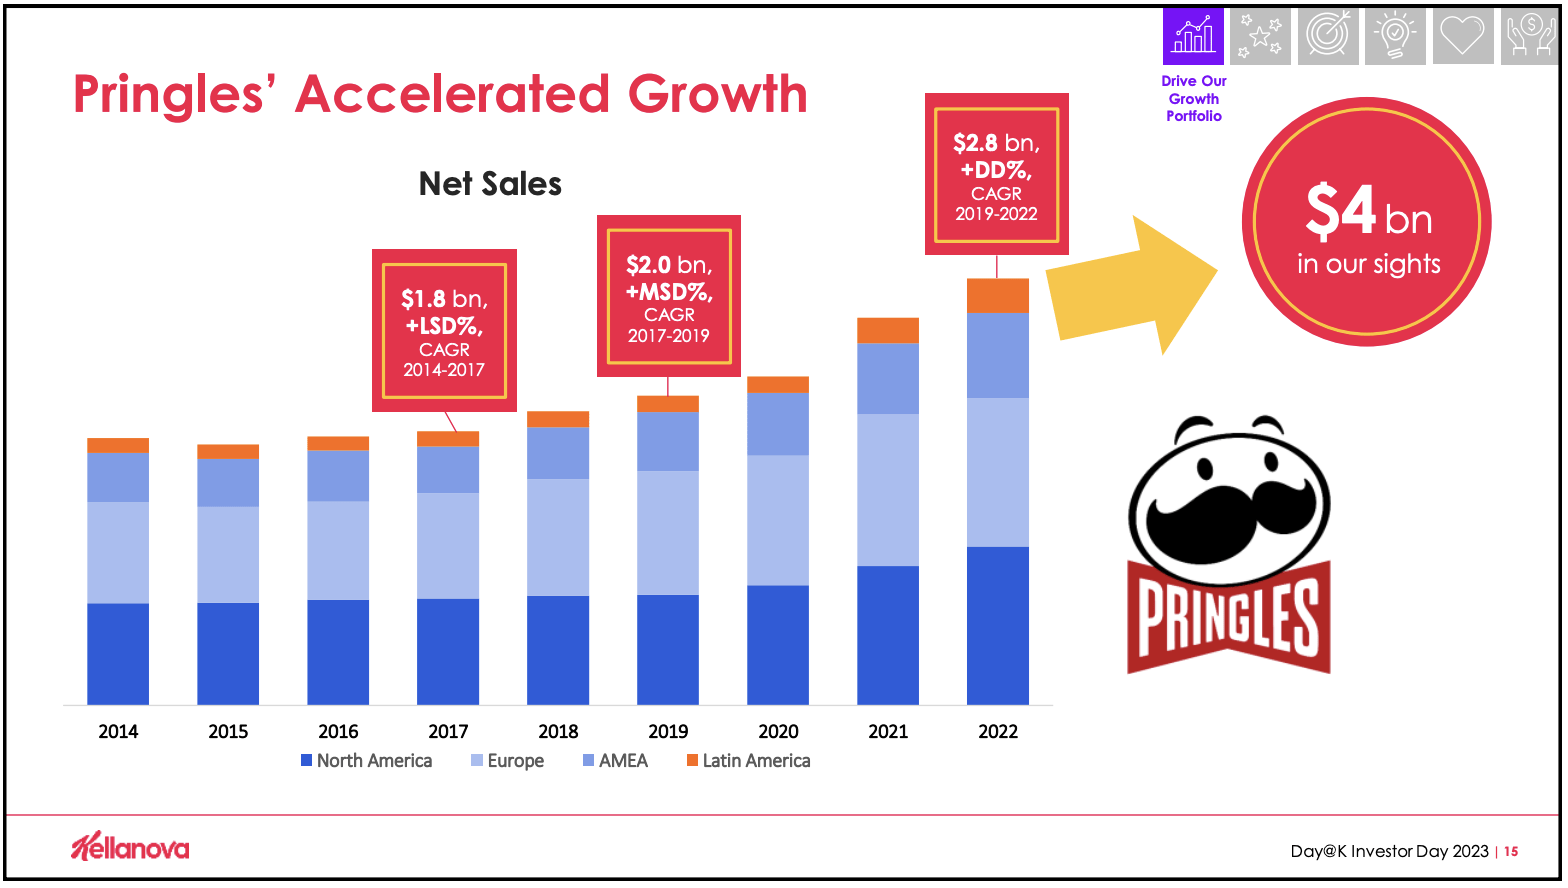
There is another lens through which we can look at the company. And this is based on its leading products. As of the 2022 fiscal year, approximately 50% of the company's revenue comes from only five brands. The largest of these is Pringles, with sales of $2.8 billion. Over the past three years, it has seen double digit growth and management believes that, before too long, revenue can hit $4 billion.
CHEEZ-IT is the second-largest product with sales of $1.3 billion. Just like Pringles, this particular offering is growing at a double-digit rate. However, management has not indicated what size this opportunity might ultimately grow to. In third place, at $800 million, is the POP-tarts brand. But this is actually growing at a rate that's in the low single digits. Eggo matches that $800 million but, unlike Pop-tarts, Eggo is growing at the highest single digit rate. And lastly, we have Rice Krispies Treats at $500 million. These are growing at a rate in the double-digit range.
On the snack side of things, management has pointed out some really attractive opportunities. For instance, the global salty snacks market is estimated to be worth about $94 billion. And from 2020 through 2022, that market has grown at an annualized rate of 8%. The same kind of growth rate has been seen with the portable wholesome snacks category, which stands at about $17 billion in size. Meanwhile, the crackers and biscuits category is worth about $85 billion and has grown at about 7% per annum.
The picture for the company does look different based on the regions in which it operates. As an example, in North America, its largest sales category involves crackers. These represent about 36% of revenue for the North American business. This is followed up by the portable wholesome snacks category at 27% of revenue. Salty snacks come in at 16%. And right behind that, at 15%, we have the frozen breakfast category. In recent years, this set of operations as a whole has grown at a mid-single digit rate. Meanwhile, operating profits have grown at the high single digit rate, showing that management can grow revenue while simultaneously boosting margins. This set of operations is what I would consider to be the crown jewel of Kellanova because of the combination of attractive growth, margin expansion, and the fact that it involves leading brands in a large economy that is incredibly developed.
While snacks comprise 79% of sales in the company’s North American operations, the composition attributable to Europe is a bit different. 52% of revenue coming from Europe can be chalked up to snacks offerings, while the remaining 48% involves cereal products. Even so, management has hopes of further growth in this space. Pringles, for instance, has grown from $800 million in revenue in 2019 to $1 billion in revenue last year. Pop-tarts are also growing rather rapidly, with an annualized growth rate over the past five years in the double-digit range. Management almost certainly views the opportunity in Europe much like it views its North American market. At the end of the day, these large and rich economies prove to be fertile ground for the snacks category. In fact, management even went so far as to say that their goal is to grow the portion of revenue the European unit generates from snacks to 60% by 2025.
The picture does look similar in Latin America. There, cereal accounts for the lion’s share of revenue for the company. About 61% of revenue in total in Latin America comes from cereal products. But this has been shrinking in recent years. This is because, while the business has grown as a whole, certain other parts are growing more rapidly. Back in 2015, 11% of revenue associated with the company's Latin America operations involved the sale of salty snacks. That number has since grown to 20%. Cookies and crackers have grown from 2% to 9%, while portable snacks and other offerings has increased from 6% to 10%.
So far, this explains why snacks products have been the core of the growth business that is Kellanova. However, this does little to explain the other parts of the enterprise and why they are lumped in. But the picture does become clear once we look at the firm's operations across the AMEA (Africa, Middle East, and Asia) regions. Across these areas, we have about 75% of the world's population. That translates to roughly 6 billion people. It's also responsible for 50% of global GDP.
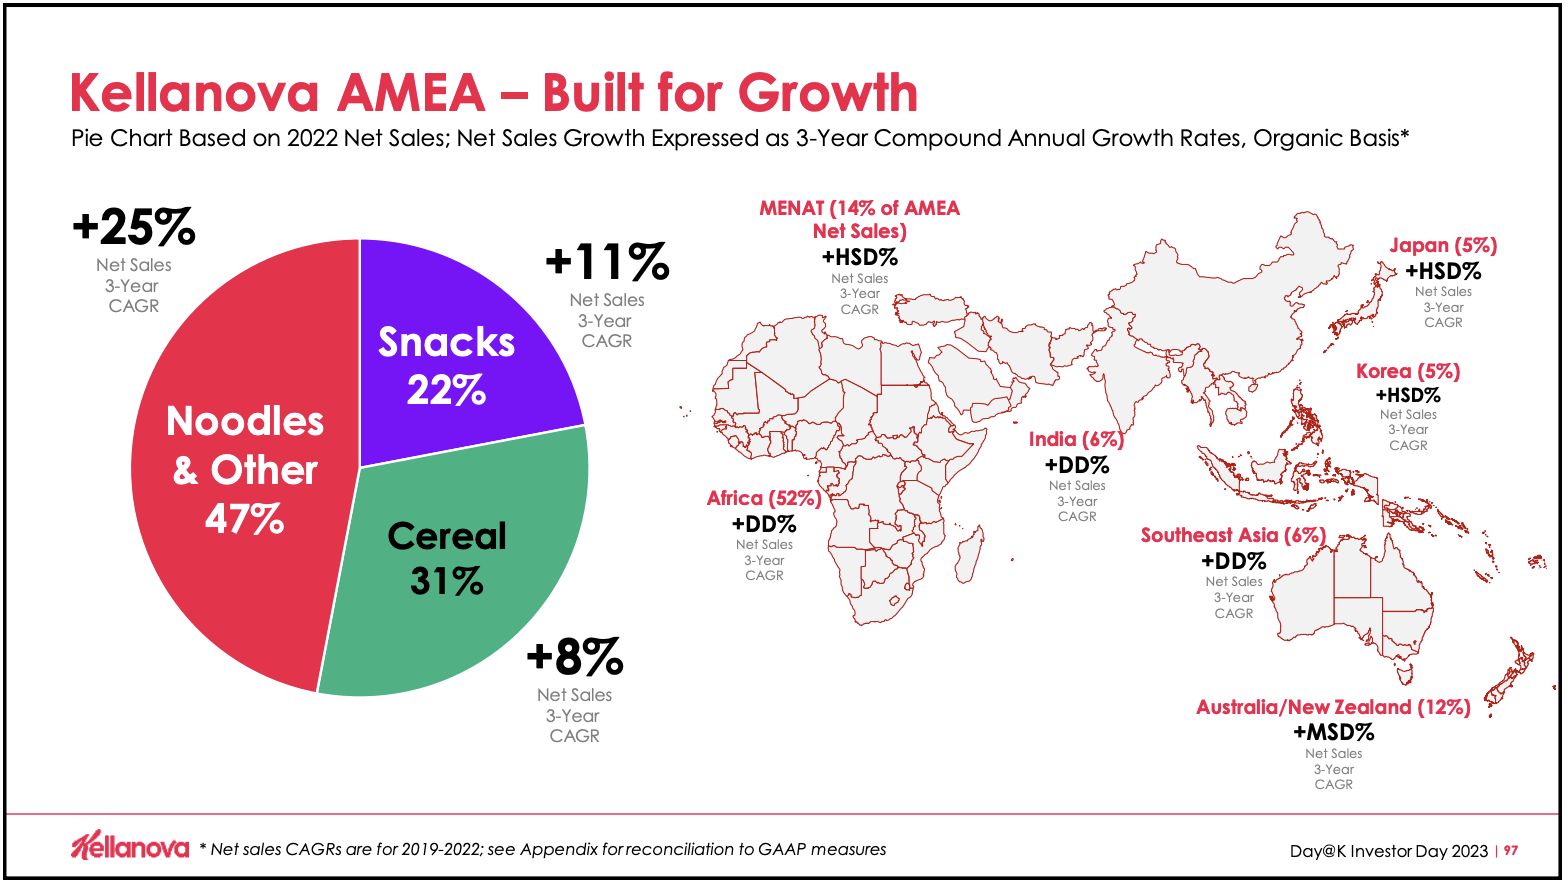
Earlier in this article, I mentioned that the noodles and other category of Kellanova has achieved rapid growth in recent years. That's exactly because of the regions in which these products are sold. 40% of the revenue associated with the AMEA markets involve noodles and other similar products. Snacks only account for 22%, while the cereal market accounts for 31%. It suddenly becomes clear why management would want to retain both the noodles and other category, and the cereal operations outside of the North American market. Rapid growth in that part of the world should help to propel sales higher over the next few years. But what I did find interesting is that this opportunity will probably develop differently than what many might expect.
Normally, you would expect a discussion of the AMEA regions to focus on China and perhaps India. The company does have a presence in India, accounting for 6% of AMEA sales. But the greatest exposure for the company in these areas is actually Africa. Last year, 52% of sales from the AMEA markets come from Africa. The next largest involved the Middle East at 14%. Because of a large growing middle class in these parts of the world, management expects growth to continue for the foreseeable future and for the noodles and other category to expand from 50% of sales for these markets to 56% by 2026. In Africa specifically, the noodles category is expected to grow to beyond 50% over the next few years.
Financially speaking, the picture for Kellanova is interesting. While also hoping to boost operating margins from 13% this year to 15% by 2026, management is targeting rather attractive top line growth. Revenue for 2023 in its entirety should be around $13 billion. This would be up from the $12.6 billion reported for 2022. And by 2024, revenue should climb to between $13.4 billion and $13.6 billion. At the midpoint, that would translate to a 3.8% increase in revenue. Profitability is also expected to grow. Earnings per share this year should be roughly $3.35. Next year, it's expected to grow to between $3.55 and $3.65. This should take operating cash flow from $1.4 billion to between $1.6 billion and $1.7 billion. Management also forecasted EBITDA for Kellanova of between $2.25 billion and $2.30 billion in 2024. A good estimate for 2023 would be roughly $2 billion.
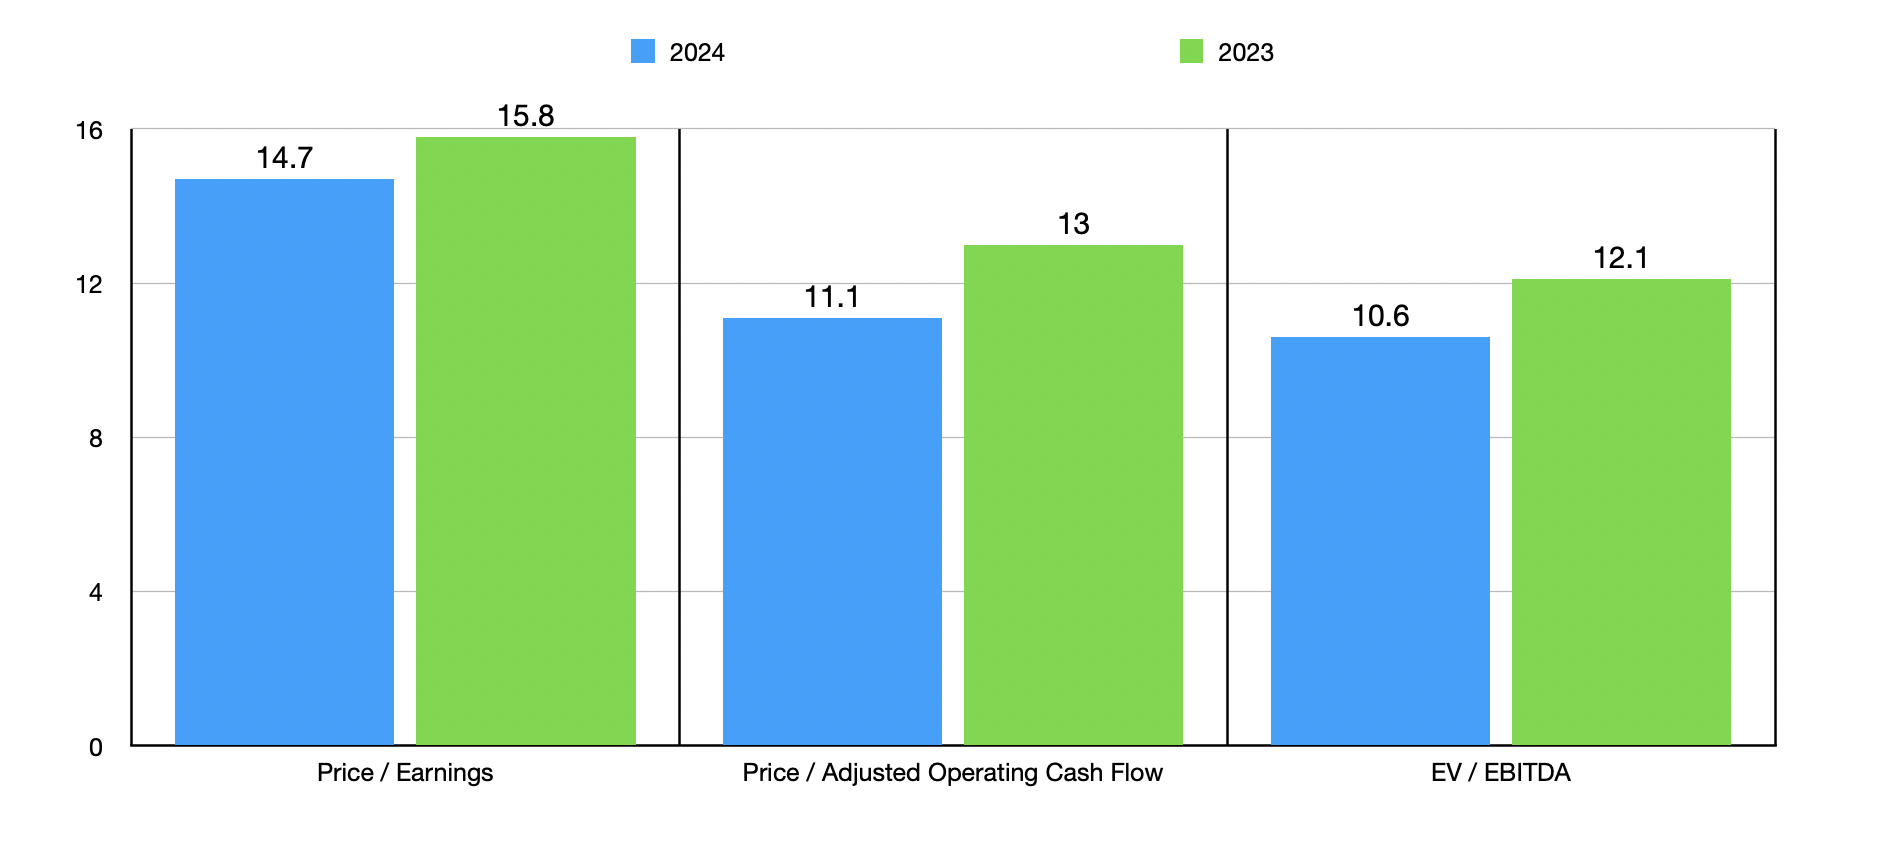
Using these estimates, I was able to value the company for 2023 and for 2024 as well. As you can see in the chart above, shares are not exactly cheap. But I wouldn't call them expensive either. As part of this analysis, I did decide to compare the company to five similar firms as shown in the table below. On a price to earnings basis and an EV to EBITDA basis, only one of the five companies was cheaper than our target. And when it comes to the price to operating cash flow multiple, that number moves up to two.
| Company |
| Price / Earnings |
| Price / Operating Cash Flow |
| EV / EBITDA |
| Kellanova |
| 15.8 |
| 13.0 |
| 12.1 |
| Mondelez ( MDLZ ) |
| 22.4 |
| 23.7 |
| 17.4 |
| Campbell Soup Company ( CPB ) |
| 14.0 |
| 10.5 |
| 9.5 |
| The Hershey Co ( HSY ) |
| 22.7 |
| 18.0 |
| 17.5 |
| Hostess Brands ( TWNK ) |
| 26.8 |
| 18.0 |
| 16.6 |
| Conagra Brands ( CAG ) |
| 18.6 |
| 12.8 |
| 14.9 |
WK Kellogg Co looks tasty
All combined, Kellanova Should generate around $13 billion in revenue this year. However, WK Kellogg Co is considerably smaller. Revenue for this year should be approximately $2.7 billion. That matches the $2.7 billion reported for 2022 and, over the next couple of years, management expects sales to be mostly flat. This is because the North American cereal business is highly mature and, with it worth $10.4 billion, WK Kellogg Co already has a sizable share of that market. In fact, it operates as the second largest seller of ready to eat cereal in the US and as the largest in Canada and the Caribbean. With household penetration exceeding 60%, it's difficult to truly grow further.
There are a number of name brands under this entity. Examples include Fruit Loops, Rice Krispies, Frosted Mini Wheats, Raisin Bran, Kellogg, and Frosted Flakes. There are a variety of other products as well. But these represent only a relatively small portion of revenue, while the ‘Big 6’ as management calls the labeled brands account for a sizable portion of revenue for the enterprise.
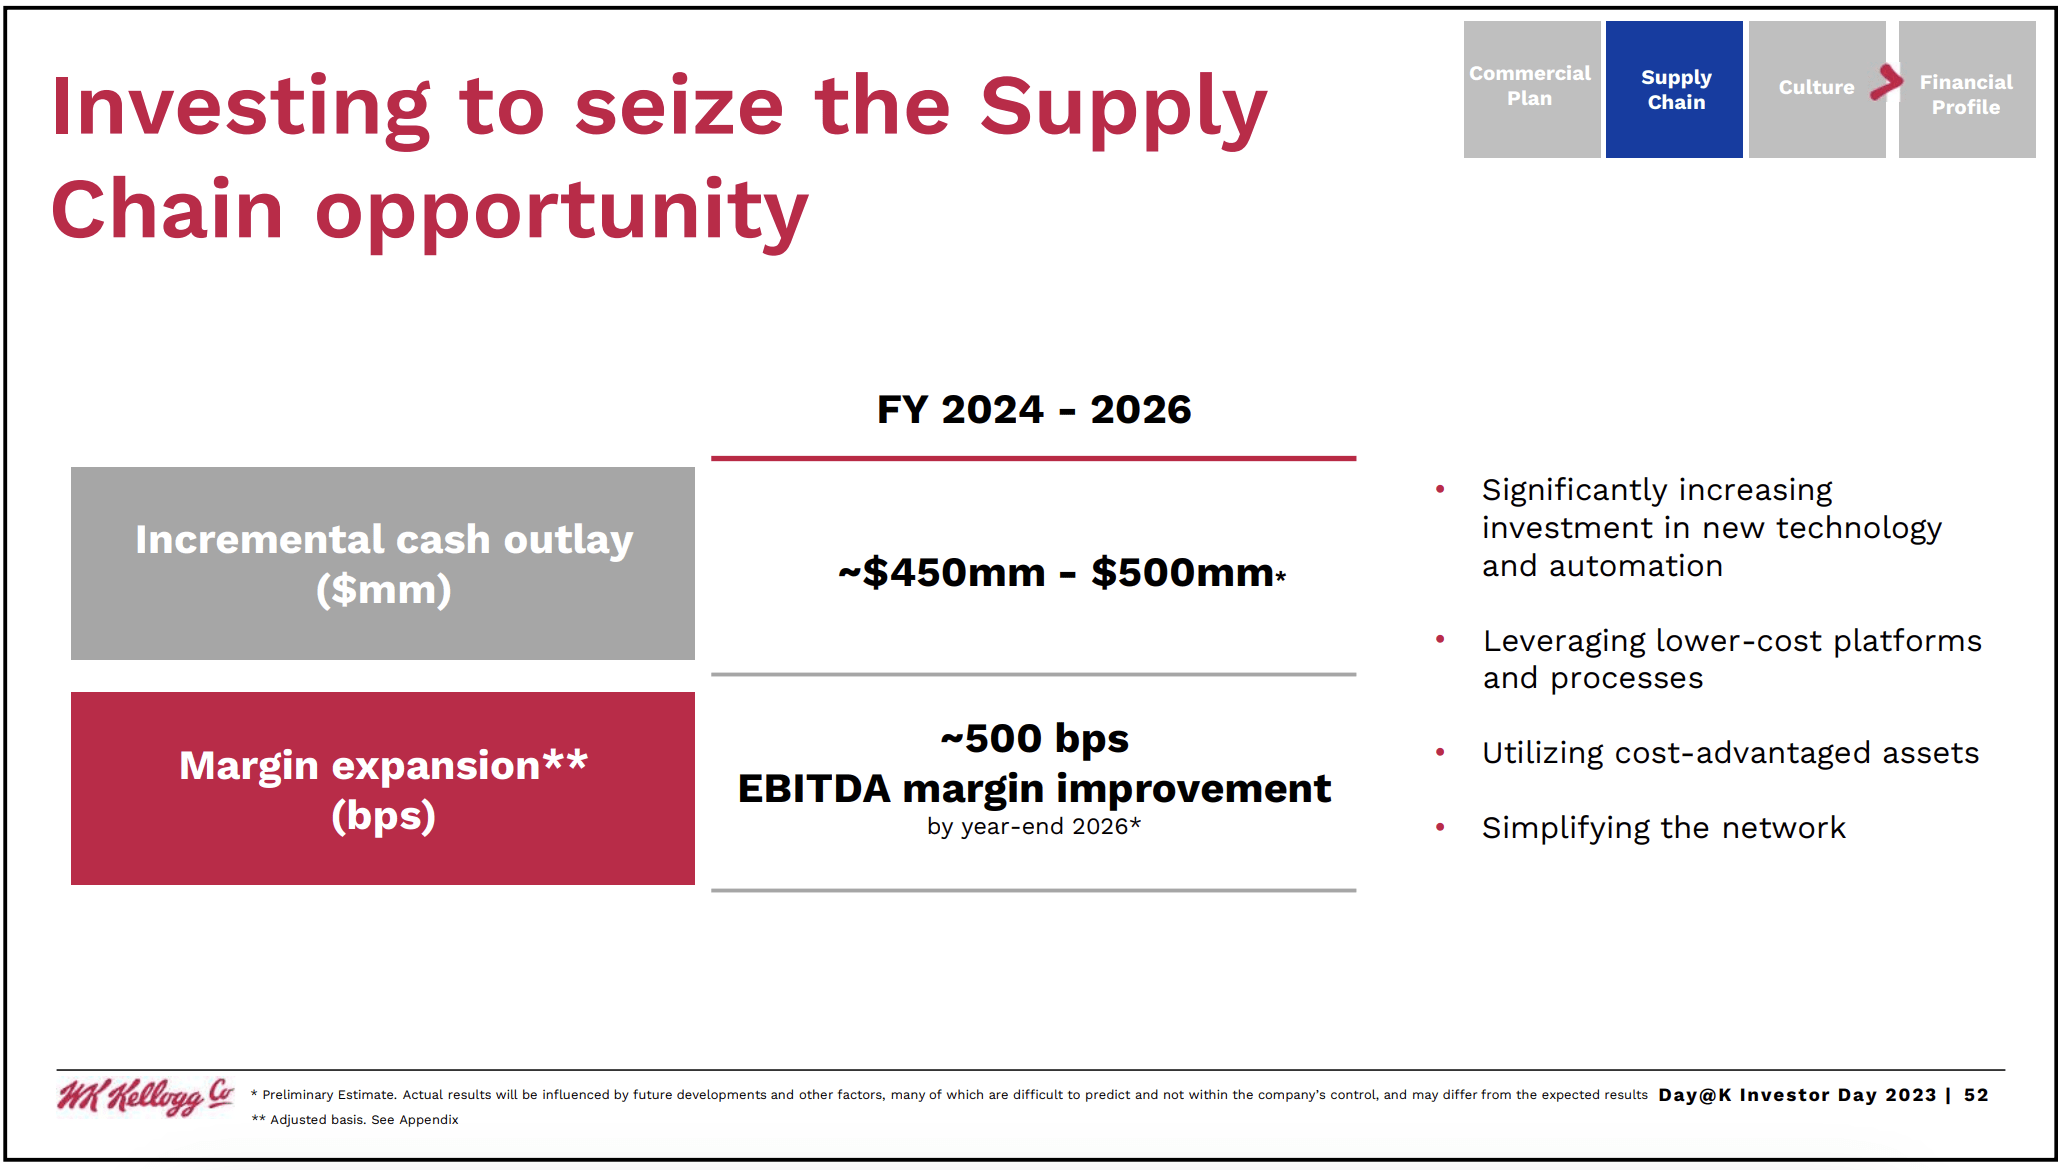
Management's primary objective for this set of operations is, instead, to focus less on growth and more on margin expansion. In fact, the company already has a plan to allocate between $450 million and $500 million toward supply chain investments between 2024 and 2026. The end goal here is to grow its EBITDA margin by 500 basis points, or 5%. To put this in perspective, next year, WK Kellogg Co is expected to generate EBITDA of between $255 million and $265 million. If management can achieve this margin expansion by the end of 2026, and if no revenue growth is achieved during this window of time, then EBITDA would manage to grow to $405 million. That's a difference of $145 million annually at the midpoint.
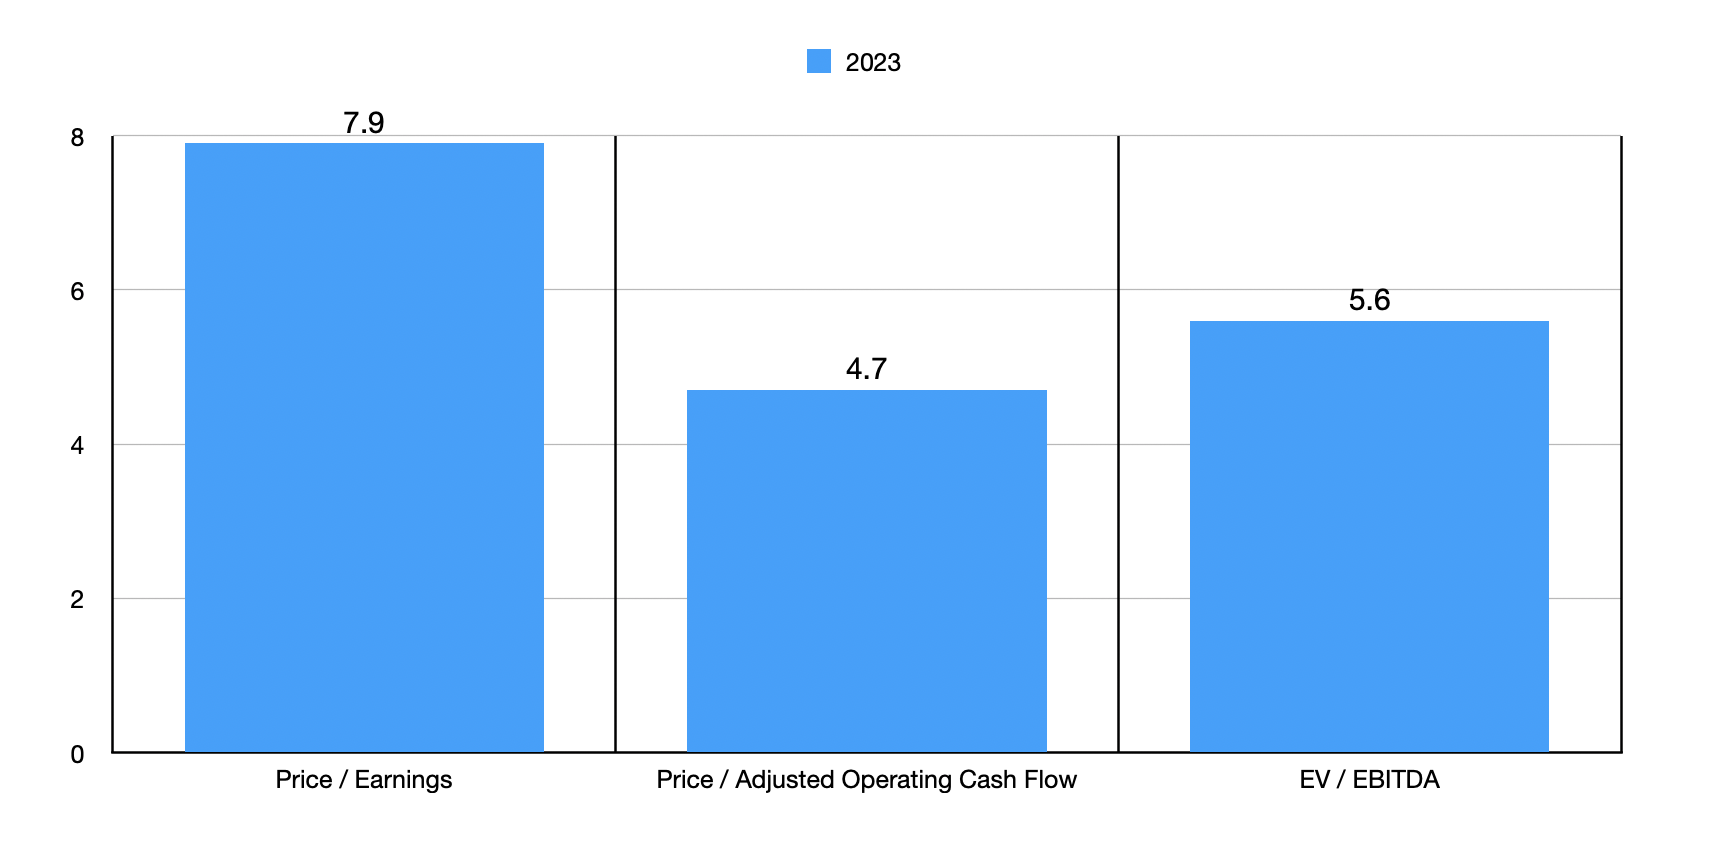
Based on estimates for the 2023 fiscal year, shares of the company look quite cheap. As the chart above illustrates, the firm is trading at a price to earnings multiple of 7.9. Both the price to operating cash flow and EV to EBITDA multiples of the company are lower than this at 4.7 and 5.6, respectively. As part of my analysis, I also compared WK Kellogg Co to five similar firms as shown in the table below. And what I found is that it ended up being cheaper than all five enterprises. Sure, it may not have any material growth potential behind it, but with how cheap shares are and the prospect of margin expansion, it does look to be a tantalizing prospect.
| Company |
| Price / Earnings |
| Price / Operating Cash Flow |
| EV / EBITDA |
| WK Kellogg Co |
| 7.9 |
| 4.7 |
| 5.6 |
| General Mills ( GIS ) |
| 15.4 |
| 13.6 |
| 11.1 |
| Post Holdings ( POST ) |
| 16.5 |
| 8.7 |
| 9.9 |
| Hormel Foods ( HRL ) |
| 23.4 |
| 18.8 |
| 15.6 |
| The J.M. Smucker Company ( SJM ) |
| 23.3 |
| 8.7 |
| 24.9 |
| Campbell Soup Company |
| 14.0 |
| 10.5 |
| 9.5 |
Takeaway
Based on the data provided, I would argue that Kellanova and WK Kellogg Co are both interesting prospects. For investors who want a more North American centric business that prioritizes margin expansion over growth and that is trading at a nice discount compared to everything else out there that I looked at, WK Kellogg Co ((KLG)) is definitely the firm of choice. But for those who want more attractive growth opportunities, particularly when it comes to overseas potential, Kellanova ((K)) would be the more sensible route to take. At the end of the day, I like both companies so, I have decided to rate both of them ‘buy’ prospects.
For further details see:
Kellanova And WK Kellogg Co: 2 Radically Different, But Tasty, Companies