TFC - KeyCorp: A Stable Bank But A Hold At Current Valuations
2024-01-16 14:51:06 ET
Summary
- KeyCorp's stable NIM indicates quality loans and potential for reliable performance.
- KeyCorp's decade-long NCO ratio outperforms peers, underscoring its effective credit risk management.
- KeyCorp's efficiency ratio, above industry ideal, suggests potential for improved cost management and profitability.
- KeyCorp's historical loan-to-deposit ratio implies a robust funding profile despite recent decrease in deposits.
- Considering normalized metrics and current price, a projected 5-year share price CAGR of 6.0% is expected.
Editor's note: Seeking Alpha is proud to welcome Bank Stock Insights as a new contributor. It's easy to become a Seeking Alpha contributor and earn money for your best investment ideas. Active contributors also get free access to SA Premium. Click here to find out more »
Investment Thesis
In my opinion, I recommend KeyCorp ( KEY ) stock as a hold based on its fundamentals and the projected 5 year stock price growth rate of 6.0%. The banks stable net interest margin reflects the quality of its loan portfolio indicating consistency, in performance. KeyCorp also excels in managing credit risks as seen by its charge off ratio compared to industry peers. However, there is room for improvement in terms of cost management and profitability since its efficiency ratio is higher than the industry average. Despite a drop in deposits KeyCorp maintains a solid funding profile as indicated by historical loan to deposit ratios. Taking into consideration metrics like return on assets to equity ratio, payout ratio and current price to book ratio also support a balanced risk/reward scenario.
Headline Financial Analysis
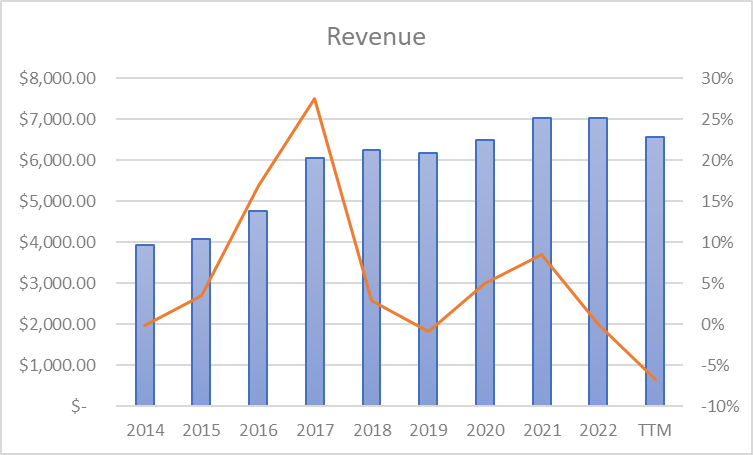
Over the ten years KeyCorp has consistently achieved revenue growth increasing from $3,934.00, in 2014 to $7,033.00 in 2022. This represents a growth rate of approximately 6.0%. In the trailing twelve months, KeyCorp reported revenue of $6,559.00, which reflects a decline of around 6.7%. This aligns with trends and future expectations as analysts anticipate revenue to be around $6,590.00, meaning revenue is expected to remain flat over the next few years.
Image created by Bank Stock Insights with Data from WiseSheets
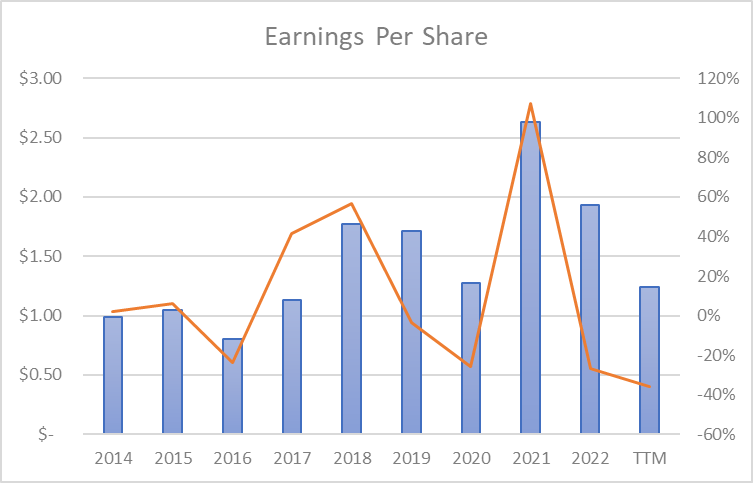
Regarding earnings per share over the decade there has been progress from $0.99 in 2014 to $1.93 in 2022 resulting in a compound annual growth rate of approximately 6.9%. Analysts forecast that by 2024 EPS will reach $1.40 suggesting a year on year growth rate of 12.9% for earnings per share from the current depressed level as a result of margin compression.
Image created by Bank Stock Insights with Data from WiseSheets
Net Interest Margin
Now let’s shift our attention to the net interest margin. In evaluating the net interest margin, it is crucial to consider the quality of loans maintained on KeyCorp’s balance sheet . KeyCorp offers loan services such as loans, financial and agricultural loans, real estate construction and mortgage loans as well, as consumer loans.
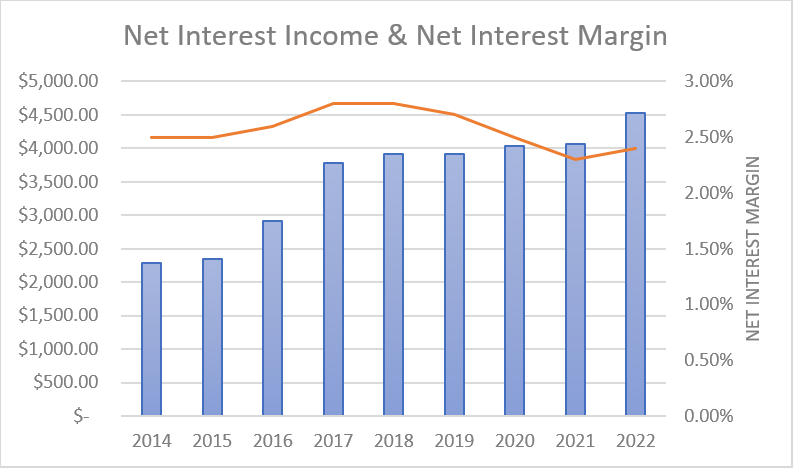
From a qualitative perspective, the majority of KeyCorp’s loan portfolio is focused on real estate loans thus it makes sense to anticipate a lower net interest margin on average compared to the competition. This is because these types of loans generally carry lower risk and therefore yield lower returns compared to other loan categories. However, we should note that KeyCorp also has small exposure in consumer lending, which increases risk and the potential for net charge offs. Though since these loans make up a minor percentage of the loan book, the risk posed to the bank is also minor. As we can see below, over the decade KeyCorp has maintained a median net interest margin of 2.5%.
Image created by Bank Stock Insights with Data from WiseSheets
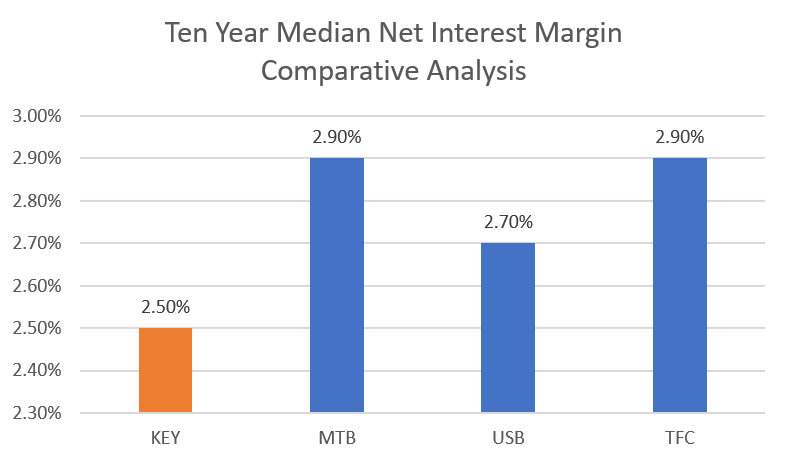
When we compare KeyCorp’s ten year interest margin with its competitors we find that MTB, USB and TFC each have a median net interest margin of 2.9%, 2.7% and 2.9% respectively. This places KeyCorp as the lowest, among these peers in terms of its decade median NIM performance.
Image created by Bank Stock Insights with Data from WiseSheets
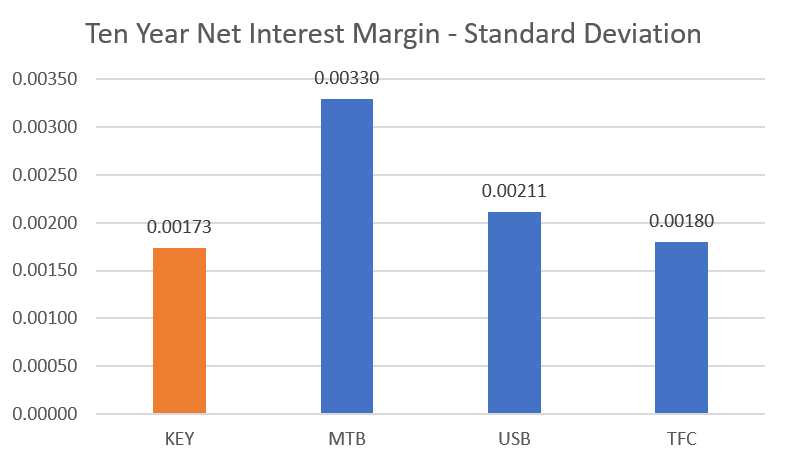
Another important factor worth considering is the consistency of the net interest margin over time. A stable NIM often indicates higher quality loans while a volatile NIM suggests lower loan quality making it harder to predict the banks future performance and increasing uncertainty. In the case of KeyCorp, their ten year deviation of NIM is 0.00173 which's actually the lowest standard deviation when compared against its peers.
Based on my understanding it seems that recently this company has made efforts to keep its interest margins stable compared to similar institutions. This is often an indicator of a prudent risk mitigation strategy employed by the management team and somewhat mitigates the weaker overall net interest margin.
Image created by Bank Stock Insights with Data from WiseSheets
Net Charge-Off Ratio
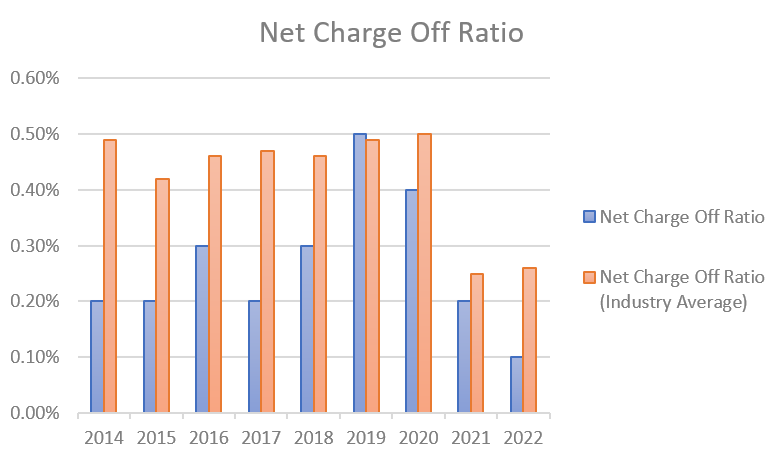
Another important measure to assess the quality of the loan portfolio is the charge off ratio. Looking at the data, from the decade KeyCorp has consistently maintained a net charge off ratio between 0.50% and 0.10%. When compared to the banking industry, KeyCorp’s net charge off ratio from 2014 to 2019 remained below the industry average indicating strong credit risk management in relation to its peers. We can see that there has been a decrease in the industry’s charge off ratio in 2021 and 2022 suggesting a broader trend towards lower credit losses (this is due to historically low interest rates and fiscal stimulus at the time). KeyCorp also reflected this trend with its decreasing ratios, remaining below industry averages .
Image created by Bank Stock Insights with Data from WiseSheets & FRED
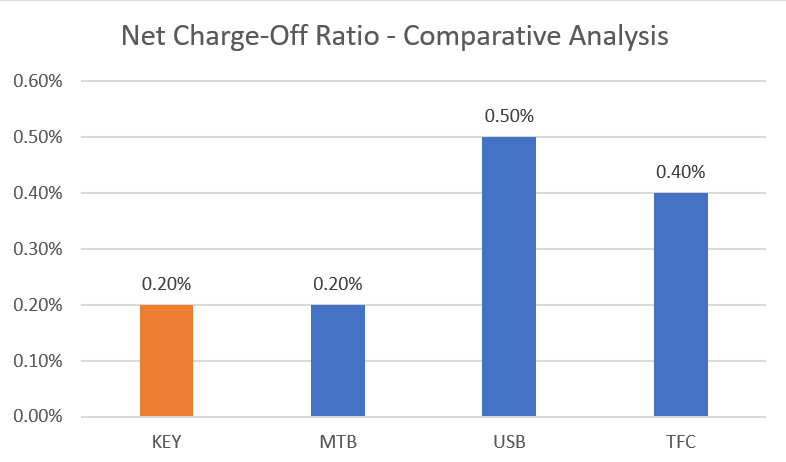
Based on my analysis of KEYs ten year net charge off ratio compared to other similar institutions, like MTB, USB and TFC it is evident that KEY holds the top position with MTB. Over the decade KEY has maintained a median NCO ratio of 0.20% which indicates a low level of risk in their loan portfolio.
Image created by Bank Stock Insights with Data from WiseSheets
Qualitatively, the net charge-off ratio shows that KEY's management team has successfully implemented risk mitigation measures through prudent loan selection to minimize credit risk resulting in strong credit performance and ensuring the long-term financial wellbeing of the company.
Leverage
When assessing the balance sheet risk of banks, I find leverage to be a useful indicator. Generally speaking, higher leverage can be acceptable if net charge offs are minimal. However, if a bank engages in loans such as credit, construction loans or auto loans I advocate for lower leverage.
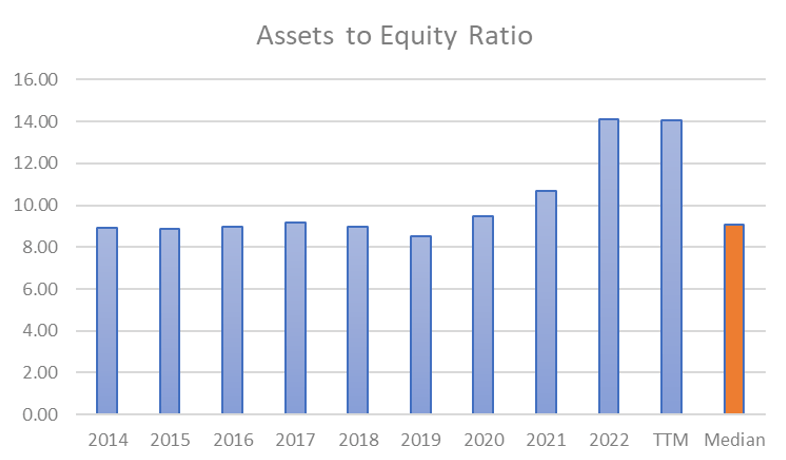
In the case of KeyCorp, their ten year asset to equity ratio stands at 9.1. It is worth noting that KeyCorp has experienced fluctuations in this ratio since 2014 when it was, at 8.91 and reached 14.11 by 2022. While KeyCorp has since a rise in the asset to equity ratio in recent years, this spike in leverage is mitigated by the low net charge off ratio.
Image created by Bank Stock Insights with Data from WiseSheets
Based on our observations KeyCorp has a fairly high level of leverage compared to its peers. Additionally considering that KEY also has a less than average net charge off ratio it indicates that the management team is capable of effectively managing the risk while still driving sufficient returns on equity.
Image created by Bank Stock Insights with Data from WiseSheets
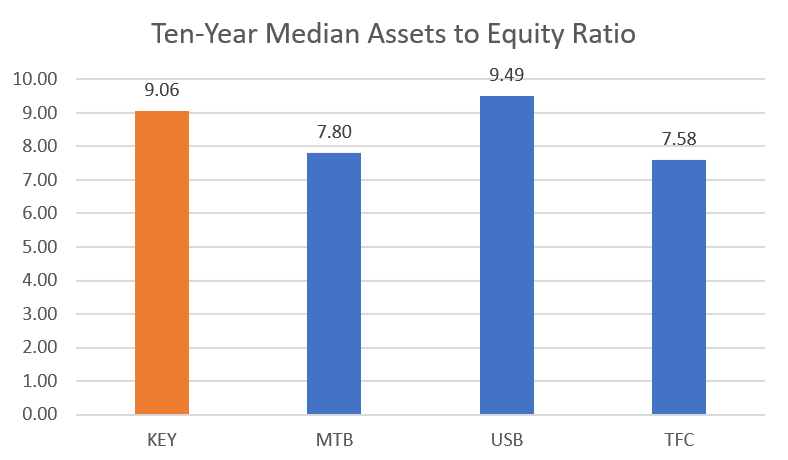
Efficiency Ratio
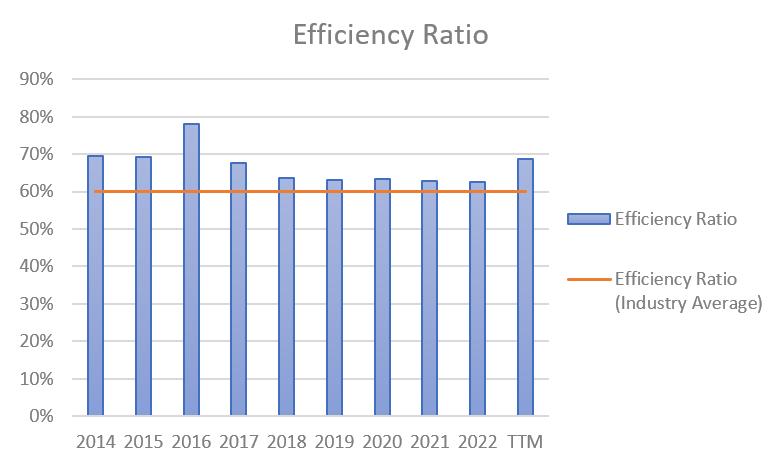
The efficiency ratio plays a role in evaluating how banks handles their operating expenses. Within the banking industry an efficiency ratio below 60% is often considered ideal . KeyCorp’s efficiency ratio started at 70%, in 2014, improving to 63% by 2019 showcasing improved efficiency. However, in the TTM period it increased to 69% due to declining revenues and non-interest expenses which stayed flat year over year.
Since 2014 KEY has failed to maintain an efficiency ratio, above 60% in zero of the years over the past decade. In my view, qualitatively this suggests that the management team could have done a better job in reducing expenses and increasing overall profitability.
Image created by Bank Stock Insights with Data from WiseSheets
When comparing KEYs ten year median efficiency ratio to its counterparts it becomes evident that MTB, USB and TFC each have ratios of charge offs at 57%, 56% and 61% respectively. This positions KEY as having the worst efficiency ratio among its peers. Based on my assessment there is room for the management team to reduce costs and improve earnings when compared to other banks.
Image created by Bank Stock Insights with Data from WiseSheets
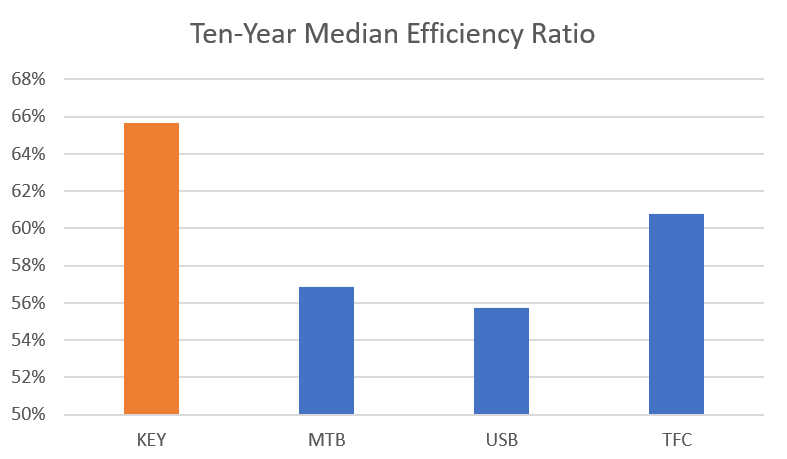
Deposits and Funding Sources
Examining deposits and funding sources is important, in understanding how costs impact a banks deposit profile and assessing the stability of these deposits. It is crucial to compare a bank’s deposits and funding sources with those of competing institutions. One central indicator I pay attention to is the loan to deposit ratio. It's ideal for this ratio to remain below 100% indicating that the bank doesn't rely on alternative funding methods, like Federal Home Loan Bank Advances. Looking at KeyCorp’s performance over the past decade they have consistently maintained a loan to deposit ratio below 100% in all ten years of the past decade. This shows that their bank deposits are strong, and they consistently have access to enough funds from deposits to service the loan demand. From a qualitative point of view, this highlights the importance of having a core deposit base, which signifies a stable funding source that is less susceptible, to fluctuations, in interest rates. This also shows that KEY has a liquidity position indicating that they have liquid assets to meet withdrawal demands even during challenging financial times.
Image created by Bank Stock Insights with Data from WiseSheets
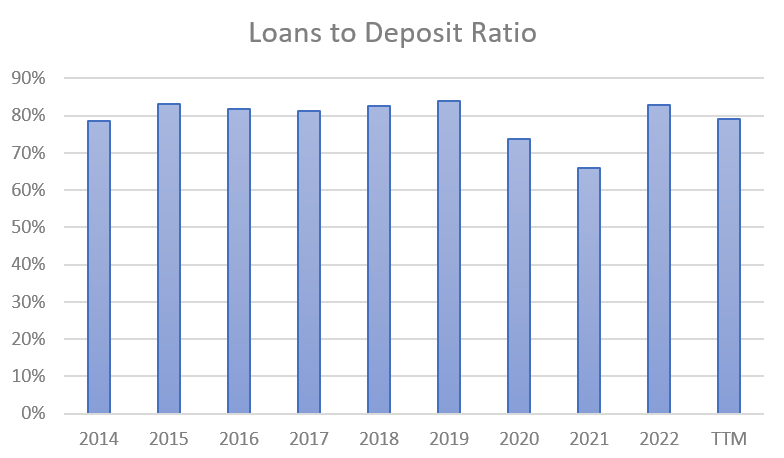
In the last 12 months non-interest bearing deposits have accounted for 22% of KEYs total deposits. It's evident that using interest bearing deposits as a source of funding leads to better net interest margins. However, in my opinion these types of deposits are not as stable because customers often withdraw their money when another bank offers a superior interest rate. On the other hand, interest-bearing deposits are more expensive for banks, as customers who deposit cash into interest bearing accounts usually park the money for longer term. Since 2021 KEY has experienced a decline of 39.0%, in interest bearing loans, which is a trend commonly observed in the banking industry. This decline can be attributed to increased interest rates and a general decrease in liquidity. Considering that this trend is prevalent across the industry in the short-term, when taking into account KEYs loan to deposit ratio I am confident that the bank’s deposits and funding sources are robust long-term.
Return on Assets and Return on Equity
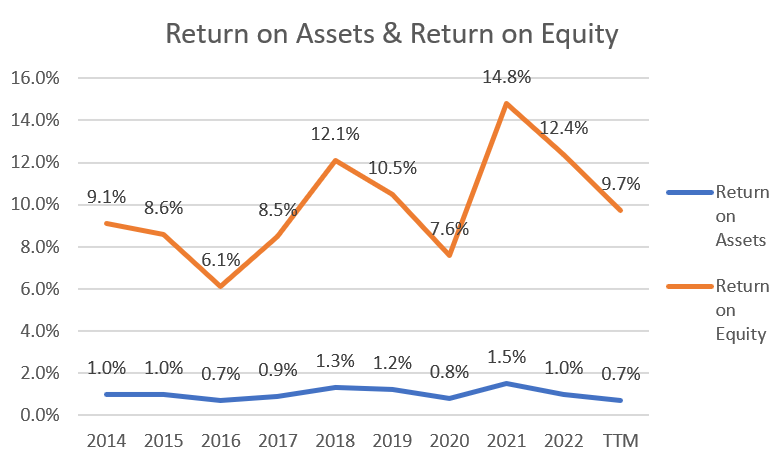
When examining KeyCorp’s performance over the past decade we find that they have consistently achieved a median return on assets of 1.0% and a median return on equity of 9.4%. However, both their return on assets and return on equity have displayed volatility from 2014 to date. The ROA reached its point at 1.5% in 2021. Subsequently dropped to 0.7% in the most recent 12 month period. Similarly, the ROE peaked at 14.8% in 2021 before declining to 9.7% in the TTM. These fluctuations indicate varying levels of growth in their assets and equity throughout this period.
Image created by Bank Stock Insights with Data from Tikr Terminal
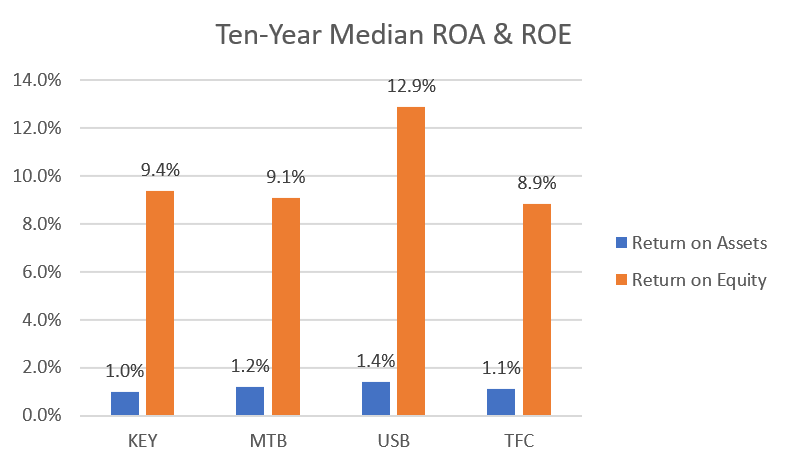
Comparing KEY with its industry peers over the ten years reveals that it ranks lowest in terms of return on assets and second highest for return on equity.
It's important to consider that a higher return on equity is not always better than a return on equity although it usually is. A savvy analyst should take into account the risk (such as leverage or riskier loans) that the bank may have taken to achieve those significant returns on equity. As we can note from earlier in the article, leverage at KeyCorp was high compared to peers, which then drive return on equity higher, that is how KEY can have the worst return on assets but have the second highest return on equity. Since the net charge off margins is also low, I deem these results as satisfactory.
Image created by Bank Stock Insights with Data from Tikr Terminal
Valuation
In the process of determining valuation for KeyCorp, I applied the following criteria:
- A normalized return on assets of 1.0% which constitutes the ten-year median spanning various market conditions.
- A normalized assets to equity ratio of 9.1 being the ten-year median assets to equity ratio.
- A normalized ten-year median payout ratio of 37%.
- A current price to book ratio of 1.27 and a projected five-year future price to book ratio of 1.13 which is derived from the ten-year median.
Image created by Bank Stock Insights with Data from WiseSheets & Tikr Terminal
Based on my analysis I anticipate that KeyCorp’s share price will grow 6.0% per year, over the next five years. This projection includes an expected book value growth of 5.7% per year, a contraction in multiple of -2.4% per year and an estimated annual dividend yield of 2.6% per year based on the mentioned payout ratio. Considering the share price of $14.59 I recommend keeping KeyCorp as a hold.
Risks
I think that when it comes to investing in KeyCorp stock like any stock investment there are various risks that potential investors should carefully consider. One important factor to take into account is the efficiency ratio, which's a measure, in the banking industry. A higher efficiency ratio suggests lower profitability because it indicates that a larger portion of the banks revenue is being spent on operating expenses. For KeyCorp specifically if this ratio worsens it could indicate operational inefficiencies that might decrease investor confidence and lead to a drop in the stock value.
Moreover as a financial services company KeyCorp is naturally influenced by market cycles. In my opinion, during periods of downturns or financial instability its stock value may decline due to factors such as an increase in loan defaults, decreased loan demand and narrower interest margins.
Market competition also poses a risk, for KeyCorp. Failing to maintain customer loyalty could result in a loss of market share which I believe represents a risk. As we saw in 2023, many smaller regional lost customer deposits due to the ' bank run ' crisis that occurred. We saw many customers in these smaller bank flee to larger more established brand name banks.
Conclusion
In summary, KeyCorp demonstrates moderate fundamentals compared to its peers. The net interest margin is quite low, though this is common among banks with high amounts of real estate loan exposure. On the other hand, the bank has a superior net charge off ratio compared to industry peers highlighting strong credit risk management. On the cost front there is room for improvement, in cost management as indicated by the efficiency ratio.
Moreover, it's worth noting that KeyCorp has maintained a strong level of funding over time and does not need alternative funding to meet loan demand. Taking all this into account, I anticipate a 5 year annual return of 6%. Based on these factors I recommend KeyCorp as a hold.
For further details see:
KeyCorp: A Stable Bank But A Hold At Current Valuations