VNQ - Kimco Realty: A Solid Buy In Shopping Center REITs
2023-08-15 09:00:00 ET
Summary
- Shopping Center REITs have seen near-zero new development and positive net store openings, leading to high occupancy rates and pricing power.
- Shopping Center REITs reported strong earnings in Q2, and most of them raised guidance for the full year.
- This article examines growth, balance sheet, dividend, and valuation metrics to consider the case for investing in Kimco Realty, the largest of the Shopping Center REITs.
Back in April, I published an article, pointing out 3 bargains in Shopping Center REITs. To my surprise, very few people bothered to read it. That's okay.
Let me start by showing you what you missed. The three REITs in question were:
Here is how those three picks have performed since the article was published:
| Ticker |
| Price 4/13 |
| Price 8/7 |
| Gain |
| Days |
| APR |
| REG |
| $60.00 |
| $66.64 |
| 11.1% |
| 87 |
| 46.43% |
| KRG |
| $20.28 |
| $23.64 |
| 16.6% |
| 87 |
| 69.51% |
| SITC |
| $11.81 |
| $14.27 |
| 20.1% |
| 87 |
| 87.39% |
| VNQ |
| $82.47 |
| $84.07 |
| 1.9% |
| 87 |
| 4.28% |
Source: Seeking Alpha Premium, Market Watch, and author calculations
Those three picks have all gained double digits in share price, while the average REIT as represented by the Vanguard Real Estate ETF (VNQ) inched along at 1.9%. Annualized, the VNQ gained at a 4.28% pace, while the three Shopping Center REITs highlighted in the April article raced along at an annual pace of 46.43%, 69.51%, and 87.39% respectively (I wish all my picks worked out that well).
Now I'm back to let you know about a similar opportunity in the same sector.
But before I do, maybe you think Shopping Center REITs are not a good sector for investment at present. If so, please consider the following three points, courtesy of Hoya Capital, the leading source for REIT sector-level analysis.
- Near-zero new development of Shopping Centers coming out of the pandemic, plus positive net store openings since 2021, has driven occupancy rates to record highs, giving Strip Center REITs some long-awaited pricing power.
- This favorable property-level supply/demand landscape has led to impressive double-digit rent growth spreads since mid-2022 and the best earnings "beat rate" of any property sector during that time.
- Of the 14 Shopping Center REITs that have reported Q2 results thus far , 10 of the companies (71%) have raised guidance. All in all, with a mid-term grade of A- from Hoya Capital Income Builder, Shopping Center REITs rank as the second-best performing of the 18 REIT sectors in Q2 earnings up to now.
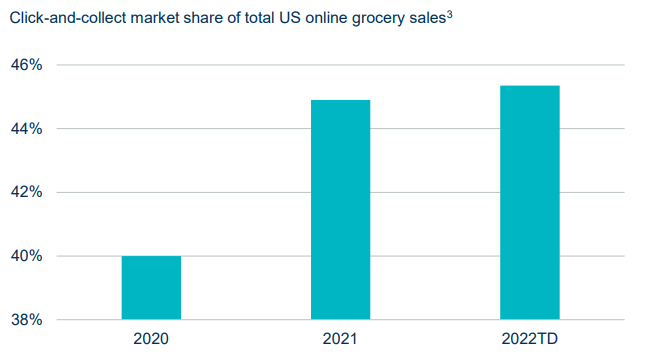
Please note also that we are talking about open-air Shopping Centers, as opposed to Regional Malls. Shopping Centers are closer to their customers, and enjoy higher trip frequency, especially if grocery-anchored. Shopping Centers are also benefitting from the WFH (work from home) trend, which drives more local shopping, and the BOPIS (buy online pickup in store) trend, both of which are here to stay.
Of the 16 Shopping Center REITs, two are especially appealing right now. This article focuses on the larger of the two.
Kimco Realty
Kimco Realty
The largest of the Shopping Center REITs, with a market cap of $12.6 billion, Kimco was founded in 1958, and went public as a REIT 32 years ago, in 1991. The company owns 528 properties totaling 90 msf (million square feet) of GLA (gross leasable area), across 12 U.S. states. The portfolio currently enjoys 95.8% occupancy, just 60 bps (basis points) below its all-time high, and 82% of the company's ABR (annual base rent) comes from grocery-anchored shopping centers, which are comparatively recession-resistant. The company also owns a portfolio of multifamily housing properties (8800 units), which it intends to grow to 12,000 units by 2025.
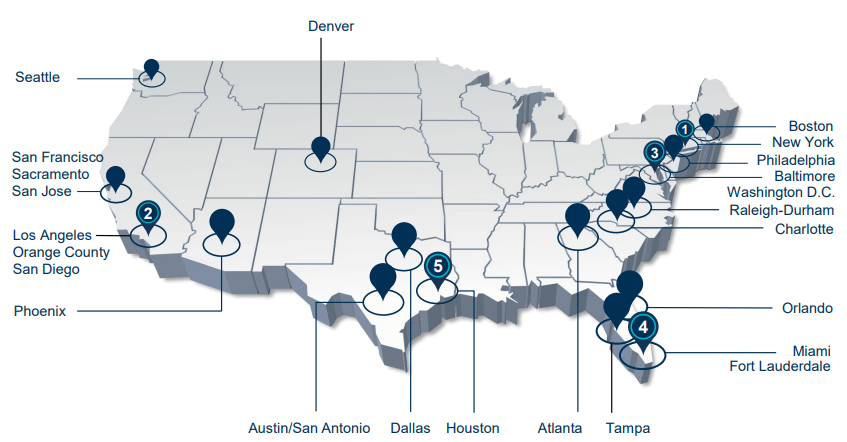
KIM derives 85% of its annual base rent from the 18 markets depicted in the map above, all of which are either Sunbelt or primary coastal markets, except for Denver (2%). The Sunbelt markets are projected to see 5-year population growth more than 60% above the U.S. average, while median household income in the coastal markets exceeds the U.S. average by 22%. KIM has successfully repositioned its brick-and-mortar stores as last-mile logistics hubs for e-commerce distribution and fulfillment.
KIM derives about 10% of its ABR from ground leases that enjoy a mark-to-market of 80%, implying strong future growth from that segment.
KIM's tenant base is well diversified, with the top tenant accounting for only 3.7% of ABR, and the top 10 tenants combining for less than 20%.
KIM investor presentation
The anchor stores account for 53% of KIM's total ABR, and the small shops 47%. The top 50 small-shop stores in the KIM portfolio are all national brands, and these 2000+ stores comprise 13% of KIM's ABR.
KIM investor presentation
Anchor stores are well diversified by business type. Only 31% of anchor store ABR comes from grocery stores and pharmacies. Discounters, hobby stores, home furnishings, medical and fitness, and others (including electronics and liquor/tobacco) make up 64% of anchor stores by ABR. Generating 82% of company ABR, the grocery-anchored centers are much more powerful customer draws than the others.
KIM investor presentation
The small shops are also highly diversified. Among the small-shop stores, restaurants lead the way at 33% by ABR, with medical/fitness accounting for 13%, personal services 11%, banks and business services 10%, and home, apparel and accessories 9%. The Other category (24%) includes dollar stores, electronics, and liquor stores.
KIM investor presentation
KIM also invests in mixed-use properties, combining multifamily with shopping, dining, and entertainment. This diversifies the company's cash flow and hedges against inflation, as the short residential leases allow for more frequent mark-to-market. Mixed-use properties also tend to grow revenues faster than retail-only properties. The close proximity of retail allows for higher rental rates on the apartments. Plus, mixed-use properties generally sell for higher prices later on.
KIM investor presentation
Accordingly, KIM has over 1000 apartment units in a 4-property mixed-use redevelopment pipeline, with numerous other opportunities across the country. The company expects to spend $150 - $175 million on redevelopment for the rest of this year.
Quarterly and First-Half Results
Rent per square foot reached an all-time high in Q2.
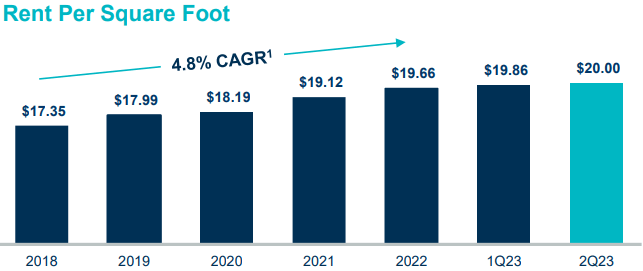
Comparable leasing spreads (which remained healthy during the pandemic at a low of 6.5%) came in at a healthy 9.9%, just 40 basis points down from Q1.
KIM investor presentation
Same-site NOI grew by 2.3% in Q2 and has remained positive every year except pandemic-stricken 2020.
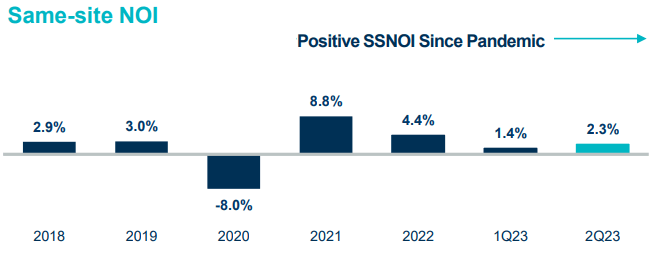
KIM Growth
Here are the 3-year growth figures for FFO (funds from operations) and TCFO (total cash from operations). KIM was hit hard by the pandemic but has come roaring back to new heights in revenue and cash flow.
| Metric |
| 2019 |
| 2020 |
| 2021 |
| 2022 |
| 3-year CAGR |
| FFO (millions) |
| $608 |
| $504 |
| $707 |
| $976 |
| -- |
| FFO Growth % |
| -- |
| (-17.1) |
| 40.3 |
| 38.0 |
| 17.1% |
| FFO per share |
| $1.47 |
| $1.17 |
| $1.38 |
| $1.58 |
| -- |
| FFO per share growth % |
| -- |
| (-20.4) |
| 17.9 |
| 14.5 |
| 2.4% |
| TCFO (millions) |
| $584 |
| $590 |
| $619 |
| $861 |
| -- |
| TCFO Growth % |
| -- |
| 1.0 |
| 4.9 |
| 39.1 |
| 13.8% |
Source: TD Ameritrade, CompaniesMarketCap.com, and author calculations
Meanwhile, here is how the stock price has done over the past 4 twelve-month periods, compared to the REIT average as represented by the Vanguard Real Estate ETF.
| Metric |
| 2019 |
| 2020 |
| 2021 |
| 2022 |
| 2023 |
| 4-yr CAGR |
| KIM |
| 2.16 |
| 35% |
| 6.2 |
| BBB+ |
Source: Hoya Capital Income Builder, TD Ameritrade, and author calculations
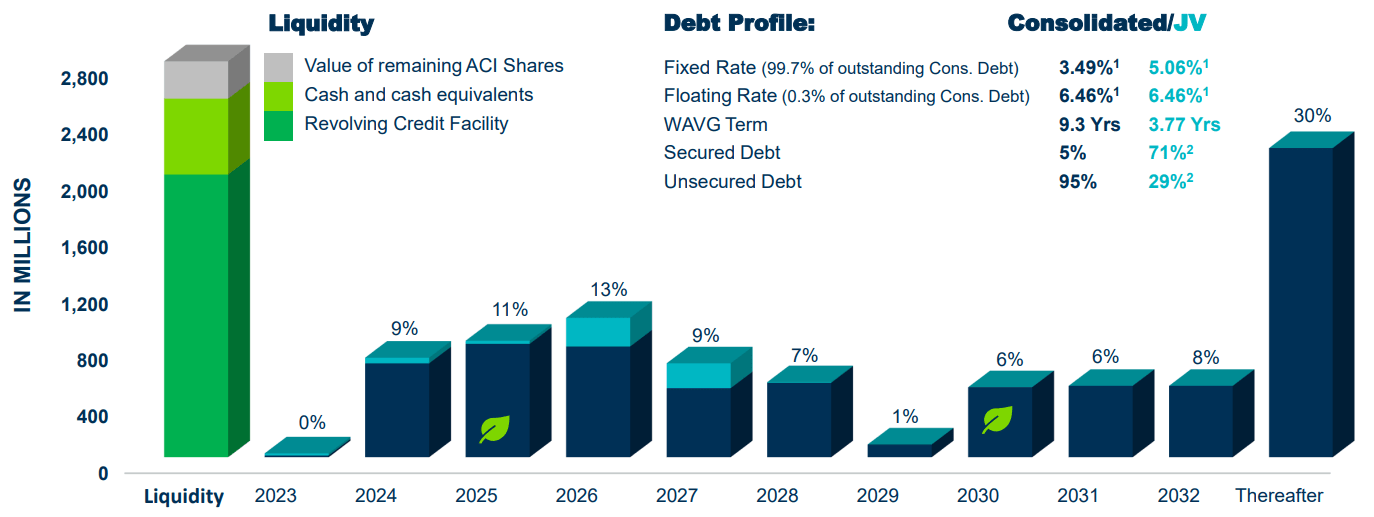
As of June 30, the company was holding $536 million against debts totaling $7.1 billion, with full availability of a $2.0 billion untapped revolver. KIM's average debt maturity is a whopping 9.3 years, and fixed-charge coverage stands at 4.4x. Of the company's portfolio, 481 properties (91%) are unencumbered by debt. Weighted average interest rate on fixed rate debts comes in at a commendable 3.49%, and variable rate debt is a mere 0.3% of the total.
KIM Dividend
KIM's current yield is above both the Shopping Center REIT average and the overall REIT average. During the pandemic, KIM drastically cut but has not quite restored its dividend. In the 5 years prior to the pandemic, KIM grew its dividend at a CAGR of 3.13%, and that is probably a better estimate of dividend growth going forward. If so, the dividend score would be an above-average 4.95. The 60% payout ratio rates a very safe B+ rating from Seeking Alpha Quant.
| Company |
| Div. Yield |
| 5-yr Div. Growth |
| Div. Score |
| Payout |
| Div. Safety |
| KIM |
| 4.00 |
| 13.1 |
| (-15.1)% |
Source: Hoya Capital Income Builder, TD Ameritrade, and author c alculations
Hoya Capital Income Builder views KIM shares as 20% undervalued currently.
What Could Go Wrong?
Construction costs and material shortages could adversely affect the company's redevelopment investments. After many years in the retail business, multifamily property management may prove challenging, and certainly adds a layer of complexity to management's task load.
Any looming possibility of civil war would be bad for all kinds of real estate. The next pandemic is just a matter of time in my opinion. Changes in local economic conditions in the Sunbelt and coastal markets where KIM's assets are located could affect tenant profitability and KIM's bottom line.
Bottom Line: KIM
KIM offers a safe, higher-than-average yield at a good price, in a healthy, gradually growing company with a rock-solid balance sheet, in a sector with significant macro tailwinds at their back. All in all, Kimco is a sound proposition for value investors, but less so for growth investors.
Seeking Alpha Premium
Of the 23 Wall Street analysts covering KIM, 12 advise a Buy or Strong Buy, and only 1 says Sell. The average price target is $23.20, implying about 14% upside.
The Street rates KIM a Buy, while TipRanks, Zacks, and Ford Equity Research rate the company a Hold.
As always, however, the opinion that matters most is yours.
For further details see:
Kimco Realty: A Solid Buy In Shopping Center REITs