VNQ - Kimco Realty Stock: Redeveloping A Core REIT Position
2023-05-23 12:59:20 ET
Summary
- Kimco Realty Corporation is the largest U.S. publicly traded owner and operator of open-air, grocery-anchored shopping centers, concentrated in the dense, high-income, first-ring suburbs of top markets.
- Regency Centers Corporation and Federal Realty Investment Trust are identified as ~ peer alternatives.
- An assessment of a currently overweight Kimco Realty position suggests redeploying 15% of these assets to Regency Centers, and 50% from shopping centers to the underweighted REIT infrastructure sector.
Investment Thesis
Kimco Realty Corporation ( KIM ) is a real estate investment trust ("REIT") that is the largest U.S. publicly traded owner and operator of open-air, grocery-anchored shopping centers, concentrated in the dense, high-income, first-ring suburbs of the top major metropolitan markets.
There are two fellow REIT peer competitors of similar scale, and arguably higher quality: Federal Realty Investment Trust (NYSE: FRT ), and Regency Centers Corporation (NYSE: REG ).
All three have provided negative total returns before inflation over the past 7 years, while CPI has increased 27%.
Assessing a currently overweight investment in KIM, my conclusion is to "redevelop" it, shifting 15% to REG and 50% to an infrastructure REIT. KIM will remain a market-weighted core REIT position for the long term.
I outline the analysis process supporting that decision. Investors may wish to consider a similar analysis for other holdings.
Introduction
I researched and wrote this article primarily to answer a question for myself: should I change my current KIM position? Considering that question requires some background.
We will touch briefly on asset allocation to REITs, sectors, individual positions, why I now own KIM stock, identification of potential alternatives, the premium shopping center space, grocery anchoring, redevelopment / development, summary of alternatives, performance analysis, risks, valuation, conclusions, and investor takeaways.
REIT Allocation
Nareit notes that "the optimal REIT portfolio allocation may be between 5% and 15% ," citing multiple studies. Nareit also has a discussion of REIT benefits - including competitive long term returns and limited correlation with other equities. It provides data for rolling 20-year returns, with REITs outperforming other stocks. Fellow analyst Paul Drake makes a detailed case in a 2021 Seeking Alpha article that:
By purchasing fully valued, blue-chip REITs one can expect to reap long-term total returns in the high single digits over very-long-term periods.
I'm convinced. My investment time horizon is 20+ years. My personal investable asset allocation plan targets 15% for REITs.
Sector and Individual Stock Allocation
I limit those investment to U.S. equity REITs. Within that universe, I quantitatively track my allocation by sector vs. the market cap data provided by Nareit. For example, I am significantly overweight industrials and very underweight office. Ideally, individual positions would be roughly equally weighted.
I am about 2x overweight in the shopping center sector. KIM is my second largest REIT position, my only position in the shopping center sector, and 3.0x my ideal position size. I have considered it a core holding.
Why I Now Own KIM Stock
About 75% of my KIM position is in a taxable account, acquired many years ago as Weingarten and converted to KIM with the August 2021 acquisition. My basis is $12.46. The other 25% I bought as KIM a few years ago in a Roth IRA, at the time largely to provide a second shopping center holding. My basis there is $16.47.
I was initially exposed to Weingarten when I attended college in Houston. They were still active in the grocery business, and I shopped at a store near campus. When I began investing, I bought several tranches of the Weingarten REIT, primarily because of their focus on the growing Texas market, and secondarily because of the still significant family ownership and involvement.
Neither the Texas focus, the family involvement, nor the diversification among shopping center REITs survived the acquisition.
With widespread prediction of a recession in the next few quarters, this seemed a good time to review this investment. My goal is to ensure that these funds are well positioned for the long term, i.e., as a 20+ year buy and hold investment.
Before starting the analysis, my expectation was a small change, +-25%, to my current KIM position.
Initial Screening
My initial screening criteria to identify the short list for this investment:
- scale (market cap, number of properties, leasable square feet)
- financial strength (S&P debt rating, conservative debt level)
- business model (grocery anchored by preference)
- performance (number 1 or 2 in sector, ideally).
Hoya Capital covered shopping center (they say Strip Centers) REITs in a January 2023 Seeking Alpha article here . Outstanding as usual, this article offers a wealth of detail on this sector.
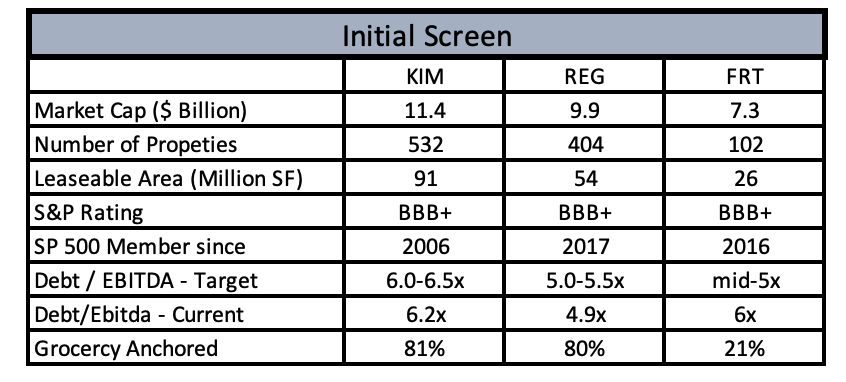
It confirmed my initial expectation that there were really three serious options: KIM, REG, and FRT. The three largest REITs by market cap are also the only three that are BBB+ rated by S&P. All have a material grocery element. All have long track records, and could probably be considered "blue chip" REITs.
Initial Shopping Center REIT Screen (Table by author. Market cap data SA 21 May; all other Company data.)
REG announced on 18 May 2023 that they planned to acquire in Urstadt Biddle Properties Inc. (UBA) in an all-stock transaction, with an estimated market cap of about $11 billion after the acquisition. UBP bills itself as "the premier grocery anchored shop center REIT in the New York Metro area." The acquisition will add 77 properties and 5 million square feet, yielding a combined portfolio of 481 total properties with 56 million square feet of gross leasable area. This will add about 10% to REG's scale.
The Shopping Center Sector
The Premium Shopping Center Space
Property Manager Insider defines 3 shopping center types that are relevant here. The International Council of Shopping Centers published data on the numbers of centers and gross leasable area ((GLA)) in 2017, which should be current enough of our purposes.
- Neighborhood centers : 30K-50K SF, 3 miles trade area, 50% grocery anchored, 35% drug store anchored. About 32,600 centers, 31% of industry GLA.
- Community centers : 100K-300K SF, 3-6 miles trade area, two anchors. REG is a large owner. About 9,800 centers, 25% of GLA.
- Power centers : 250K-600K SF, 5-10 miles trade area, 75%+ of space occupied by one or more anchors, often "category killers". KIM is a large owner. About 2,300 centers, 13% of GLA.
Not all of these are premium locations. We can make a rough estimate of the size of the premium shopping center space.
The St. Louis Federal Reserve estimated the U.S. median household income to be $70.8K in 2021. This 2022 Pew report classifies 21% of the adult population as living in upper income households, with a median income of $219.6K in 2020. Similarly, 50% of the population lives in middle income households, with a median income of $90.1K.
FRT reports ( Q1 2023 Investor Prevention ) 102 properties, with an average 177,000 population within 3 miles, and $108,000 median household income, compared with about $104K for REG, $90K KIM.
Back of the envelope, if we assume FRT, REG, KIM class properties require catchment area with a population of about 125,000 with about a $100K median household income, and about 40% of the population might have that income, we can estimate that a population of 1 million might support 1,000,000 / 125,000 x 40% = 3.2 catchment areas, supporting one (or perhaps more - we'll come back to this) properties.
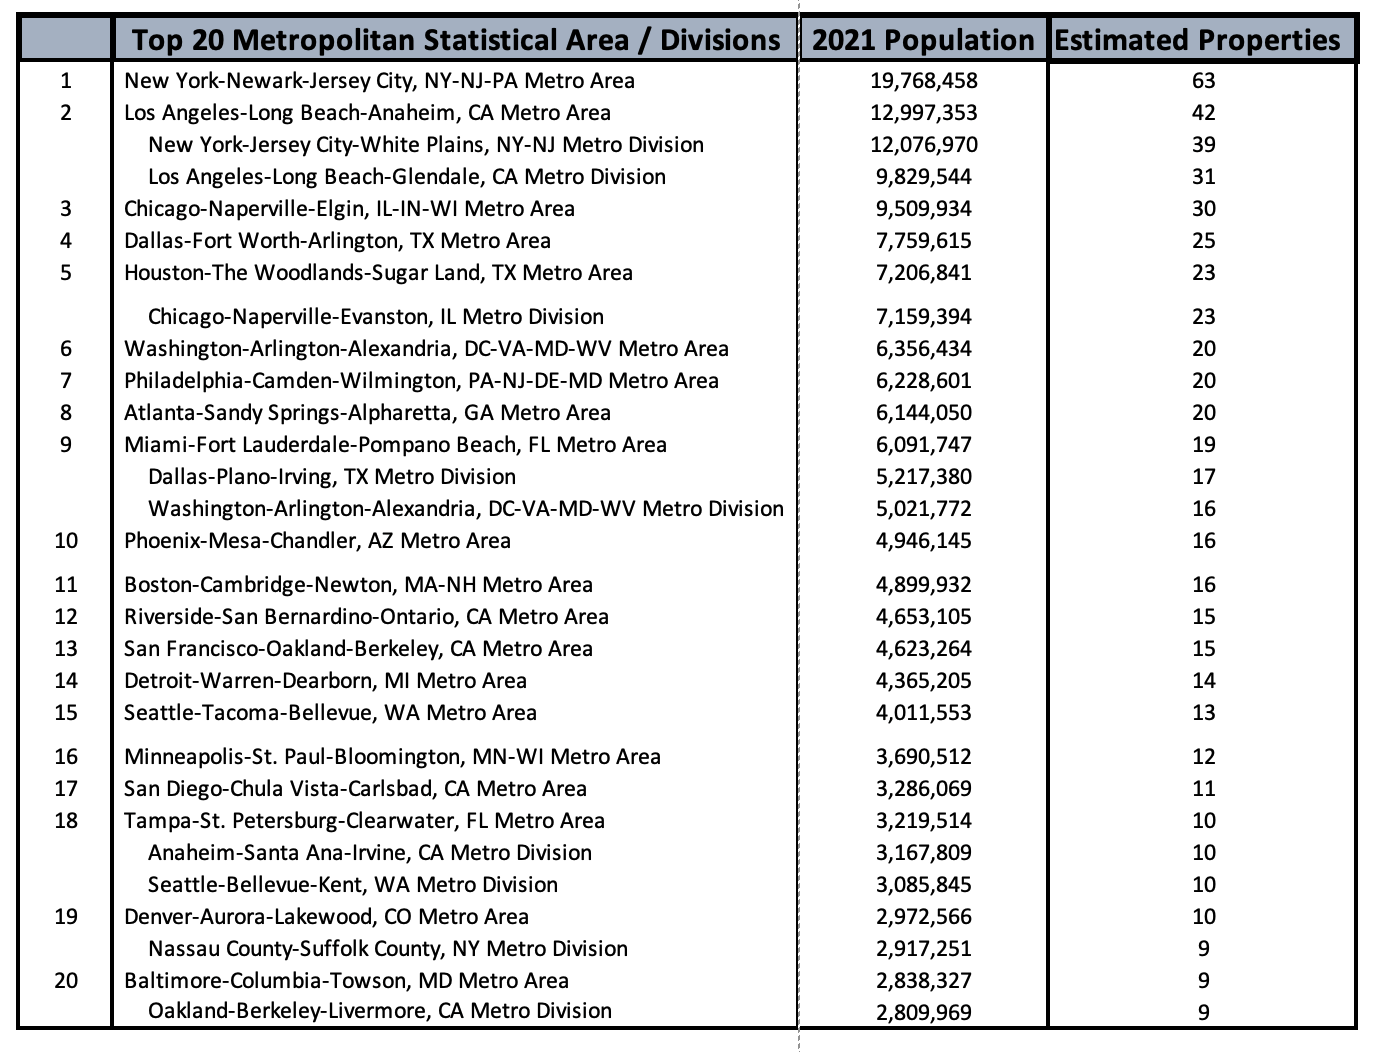
There are about 377 standard Metropolitan Statistical Areas ((MSA)) in the U.S. (see Census data here ). Data on eleven of the largest are also presented in 38 Divisions (shown indented in the table below). The median MSA falls at about Spartanburg, S.C., with an estimated population of 335,00 in 2021.
Putting that together, we can estimate the minimum number of premium shopping centers that each MSA might support (at one center per catchment area). For the top 20 below, the total is 402.
It's fairly easy to see why these REITs invest where they do, even before taking into account relative affluence between MSAs.
Top 20 MSA Potential Analysis (Data from Census, company publications. Analysis by author,)
On a national level, about 286 million people live in MSAs. That suggests a minimum capacity for about 915 premium shopping centers in the U.S.
Between them, FRT, REG, and KIM have about 1,000 properties today.
However, many catchment areas will support multiple centers. For example, REG owns a The Kroger Co. (KR)-anchored shopping center, claiming a 80,000 population within 3 miles, which includes my house. Also within 3 miles are shopping centers anchored by Whole Foods, a large regional grocery, and Target, a standalone Walmart and Costco, and a Lowe's-anchored power center. That's 7 shopping centers with more or less overlapping catchment areas. I've shopped at all of them.
This area, which would probably be considered a third ring suburb, was largely farmland 30 years ago, but is almost entirely built out now.
It's a rough estimate, but it suggests that there may not be a lot of room to add new properties in the "dense, high-income, first-ring suburbs of the top major metropolitan markets." One can see this as one driver for growth via redevelopment.
Grocery Anchored
A grocery store-anchored retail center is "a multi-tenant commercial property where a grocery store/supermarket leases the majority of the retail space." Perhaps the key attribute is resilient demand. A 2015 USDA survey (the most recent I could find) found that the average household traveled 3.8 miles to their primary grocery store.
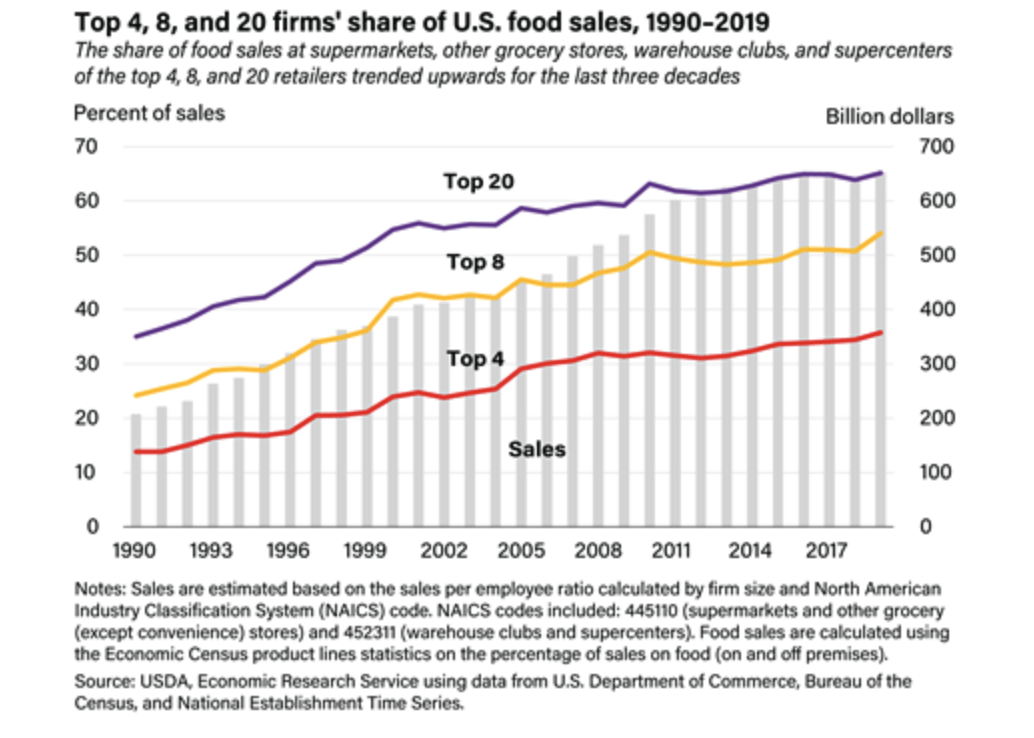
The chart below demonstrates that market share (left axis) has been steadily concentrating for 3 decades.
Market Share Increasingly Concentrated (US Department of Agriculture)
Food Industry reports that the top 10 grocery businesses in 2021 were, by revenue: Walmart (5300 stores; Walmart, Sam's), Amazon (662 stores; Whole Foods, Amazon Go), Costco (564 stores), Kroger (2726 stores; Kroger, Harris Teeter, Smith's), Albertsons (2278 stores; Safeway, Albertsons, Vons), Ahold Delhaize (2048 stores; Food Lion, Shop & Stop, Food Lion, Giant), Publix (1293 stores), HEB (420 stores), Meijer (258 stores), and Target.
Publix (employee-owned) owns 280 shopping centers anchored by their stores. (That sounds like a really interesting M&A opportunity.)
In October 2022, Kroger announced an agreement to acquire Albertsons Companies, Inc. (ACI). Supermarket New reports in April 2023 that Kroger may be required to divest more than the planned 250-300 stores to gain anti-trust approval.
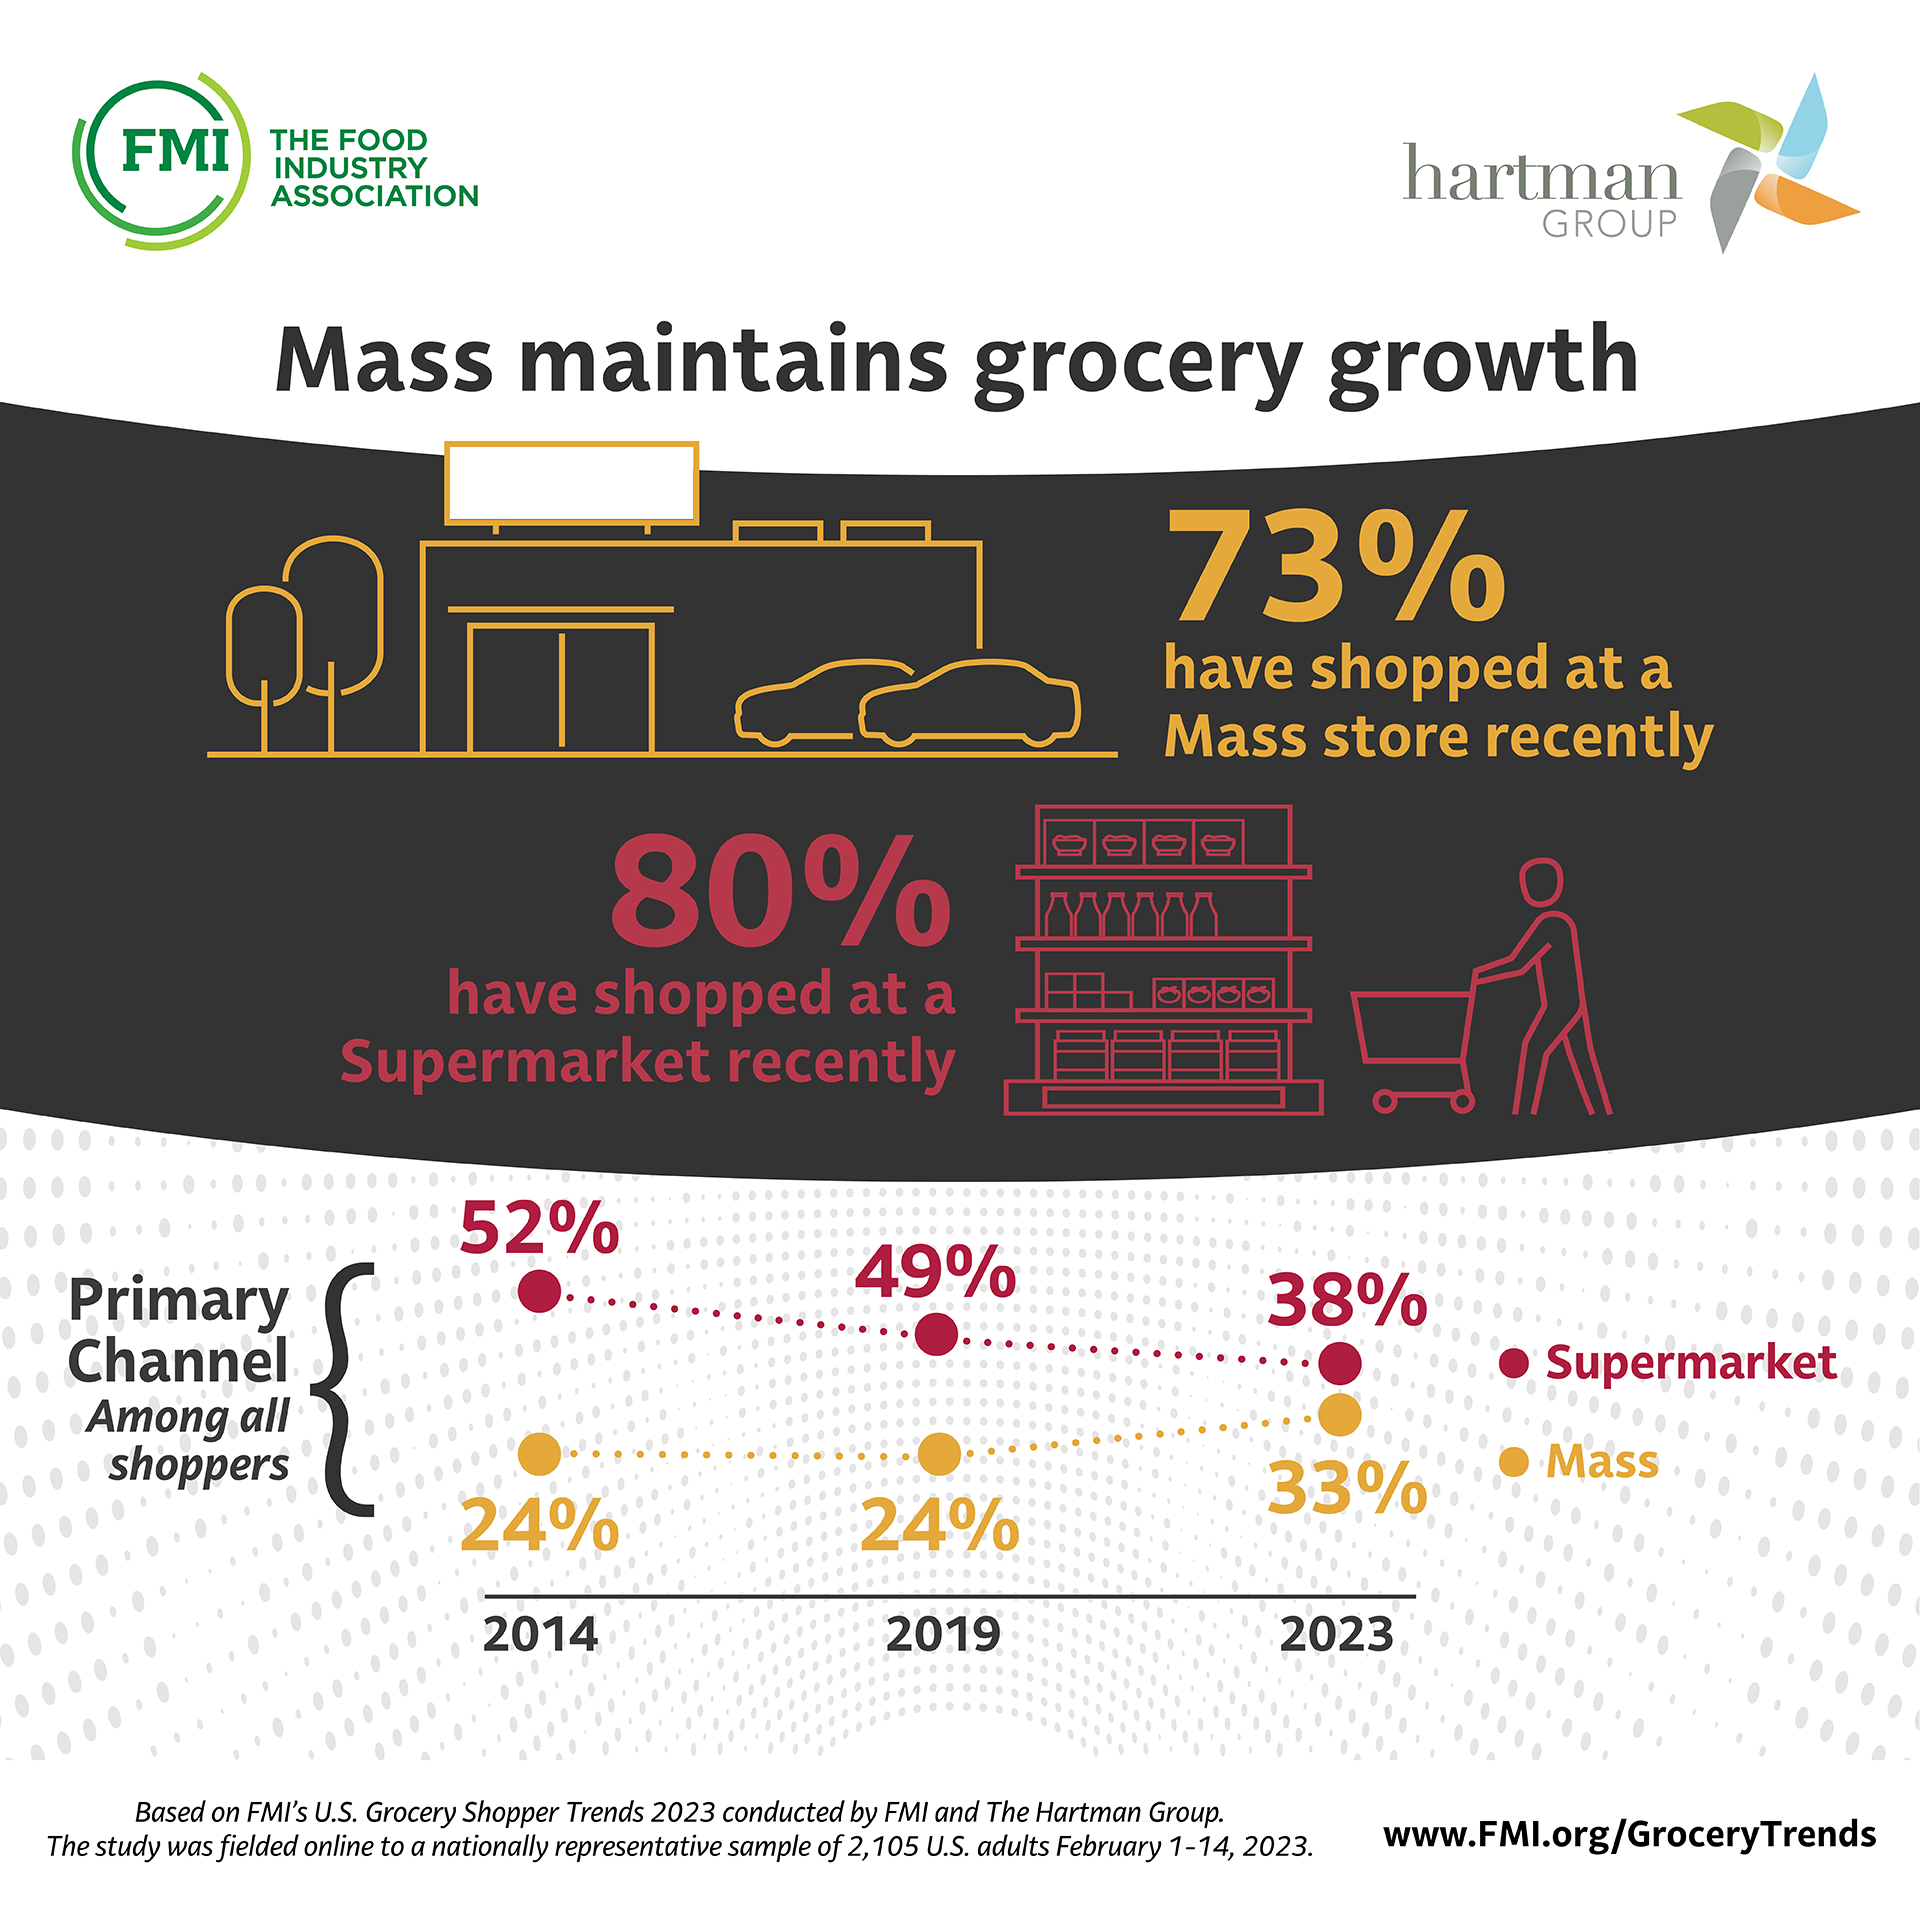
The US Grocery Shopping Trends 2023 report note that the primary channel for food shopping has continued to shift from grocery stores to mass market stores, with a 52% to 24% advantage in 2014 dropping to 38% to 33% in 2023. The shift away from traditional grocery stores appears more pronounced for younger shoppers.
Redevelopment / Mixed Use Development
Redevelopment include both routine tune-ups, often as required to re-tenant a space, and a literal handful of major efforts. The major redevelopment focus outside the traditional shopping center context seems to be multi-family residential units, done in the context of a mixed use retail/residential, rather than as standalone residential.
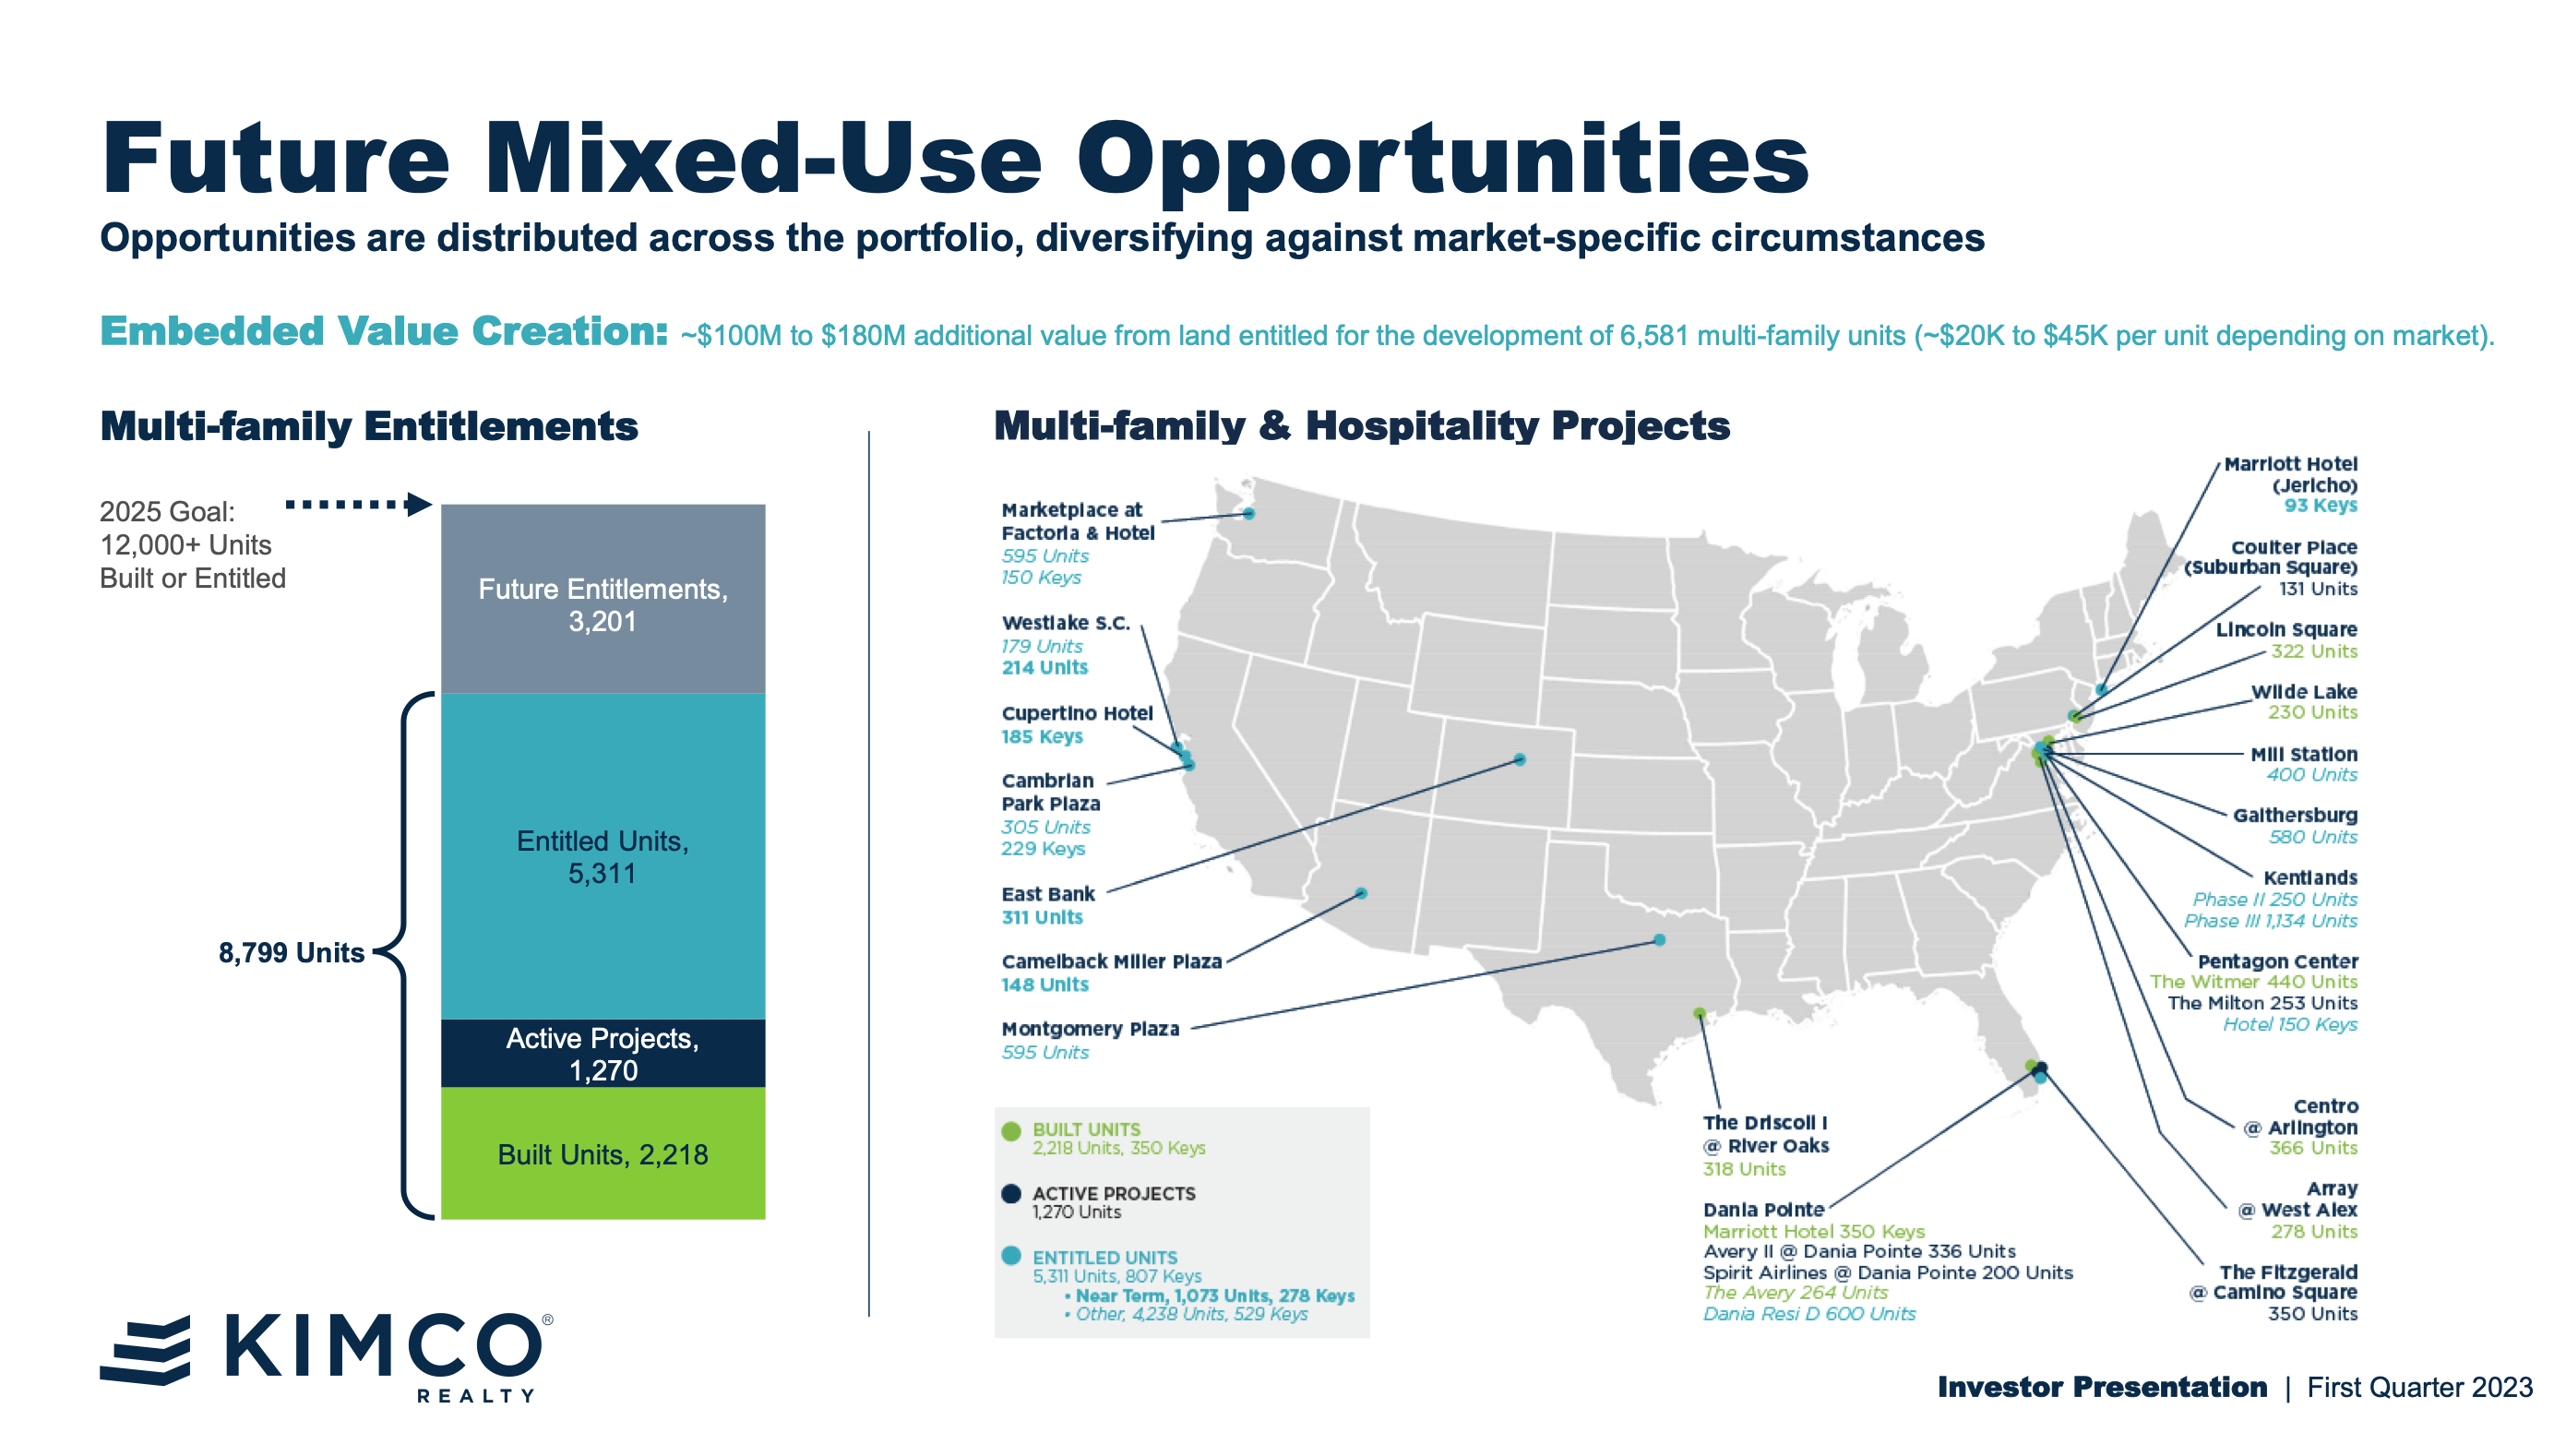
KIM has a significant effort in multi-family, with plans to grow from 2,200 units to potentially 12,000.
REG currently has 2 ground-up developments under construction, and six redevelopments in process. One redevelopment - Town and Country Center in Los Angeles, CA - includes new retail space and approximately 300 luxury mid-rise apartments; a leading multifamily developer will construct the apartments on a ground lease.
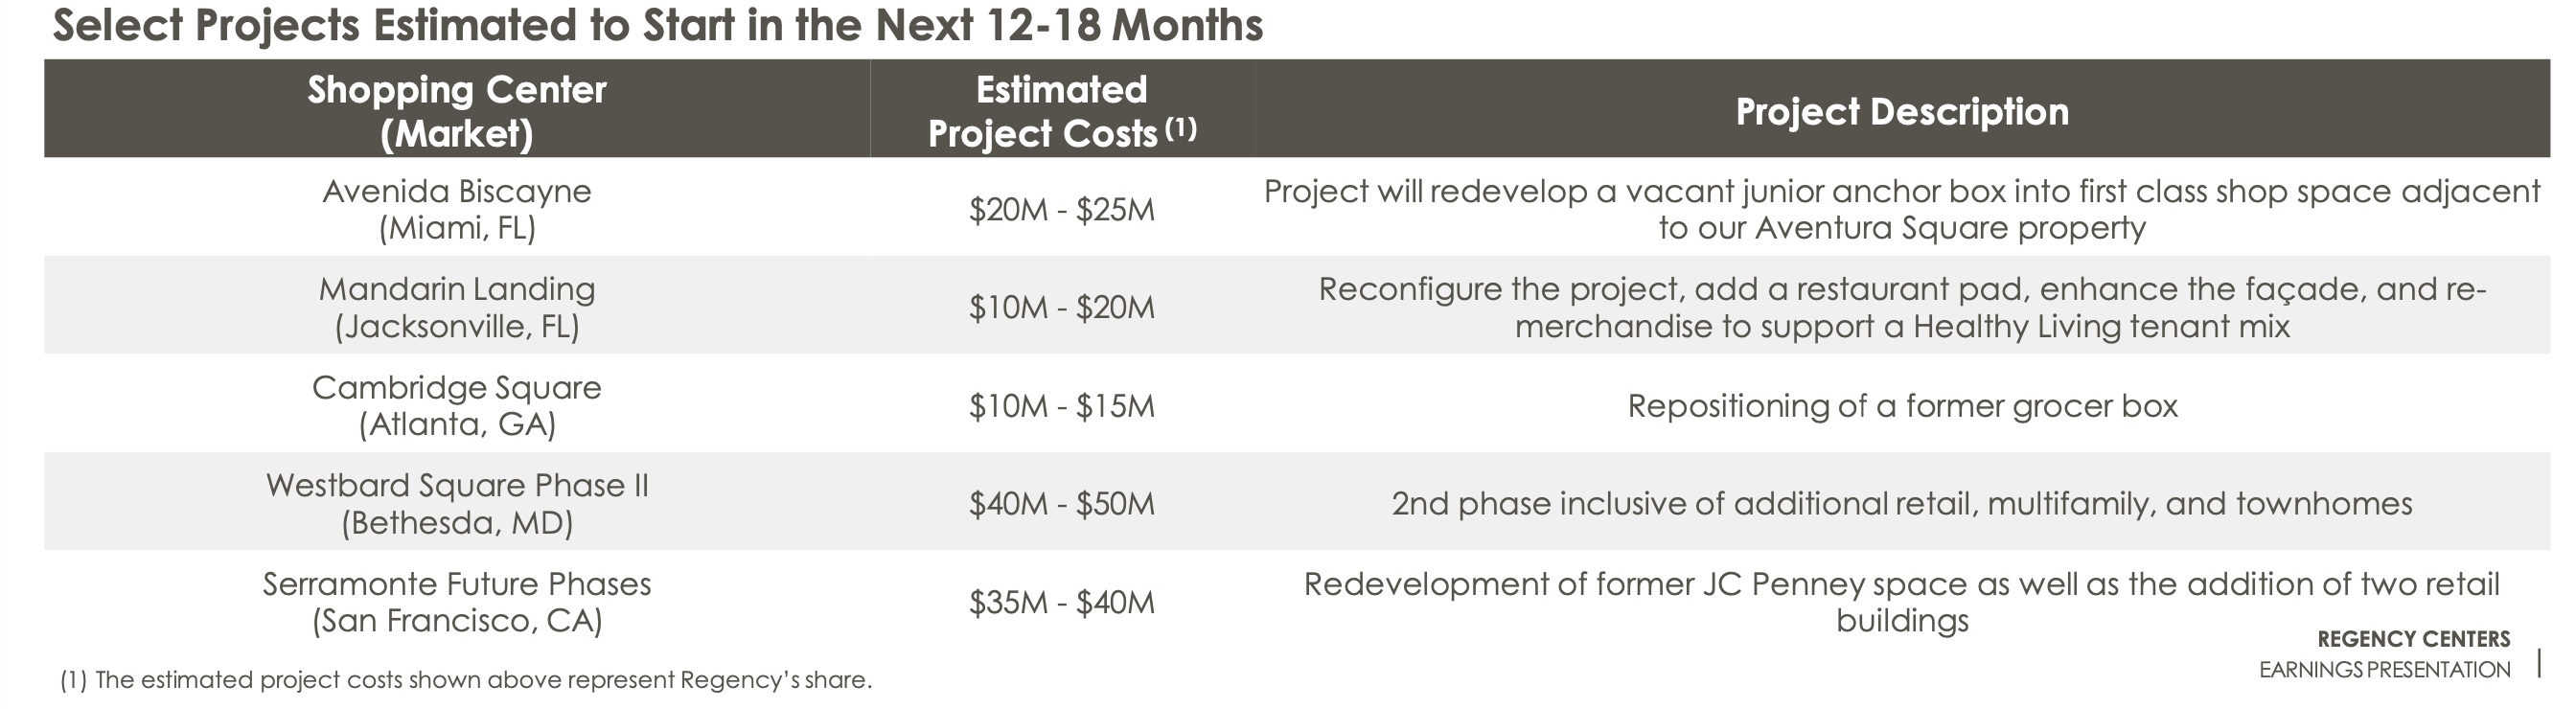
Here are planned future redevelopments in REG's Q1 Investor Presentation :
FRT currently has about 3,200 residential units and has entitlements in process for about 4,000 more.
FRT's Darien Commons provides an example, detailed in this February 2023 article , of a mixed-use redevelopment of a grocery-anchored shopping center in a New York City first ring suburb. The decade-long $115 million effort delivered 122 residential units, and an upgraded retail venue.
Summary of Alternatives - KIM, REG, FRT
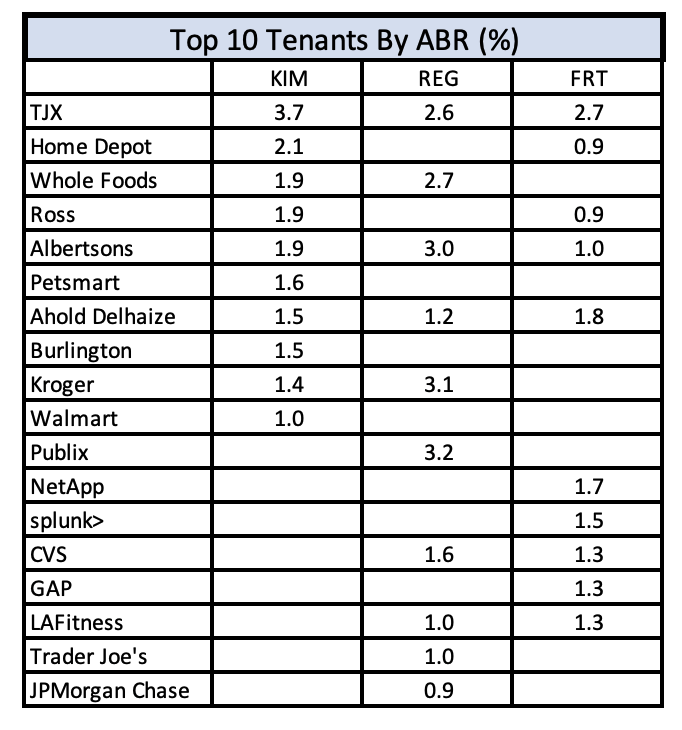
All three of these REITs target the dense, high income suburbs, often described as "first ring suburbs." Within those markets, all declare an emphasis on grocery anchors. The Top 10 Tenants by ABR (annualized base rent), table below - showing REG with 15% from grocers, KIM with 8%, and FRT with 3% - might suggest that the emphasis is stronger with some than others.
These are all large, mature, fairly stable companies with experienced management. Growth rates on most metrics tend toward the low-mid single digits.
Kimco Realty
KIM's goal is to "own and operate open-air, grocery-anchored shopping centers and mixed-use assets located in the high barrier to entry, first-ring suburbs of top major metropolitan sun belt and coastal markets."
Strategic goals include increasing mixed use ABR from 13% to 15%, increase 2,200 current residential units to 12,000 built or entitled, and earning a S&P A- credit rating.
KIM had a very challenging Great Recession experience, and has sold over 400 properties since 2010 to improve its portfolio quality. KIM's August 2021 acquisition of Weingarten increased scale by about 40% , and arguably further improved portfolio quality. They are also in the process of monetizing a large stake in Albertsons grocery, selling 14.1 million shares for $282 million in 2023, with further sales planned in 2024.
Today KIM has a broad range of properties, with 86% of ABR in 19 markets . California and Florida account for 31% of ABR, with New York, Texas, and the D.C area adding another 34%.
Examples include River Oaks in Houston (formerly a Weingarten property), with 200,000 people with $120,000 median household incomes within 3 miles, and including a Kroger anchor and the new 318 unit 30 story Driscoll luxury residential apartments (as I recall from Weingarten presentations a few years ago, they had plans for 3 or 4 more residential towers there). And Franklin Park in Spokane Washington, with 128,000 people with $53K median income within 3 miles, and including a Trader Joe's.
This 4-minute Nareit video interview with Conor Flynn, CEO of KIM, from November 2022, provides some interesting comments - impact of limited new shopping center supply, and the positive impact on the balance sheet of their monetizing Albertson's stake.
Regency Centers
REG's stated goal is to:
"own and manage a portfolio of high-quality neighborhood and community shopping centers primarily anchored by market leading grocers and principally located in suburban trade areas in the most desirable metro areas in the United States."
California and Florida account for 47% of ABR, adding Texas and New York accounts for 61%.
Previously to the UBA acquisition announced in May 2023, REG acquired Equity One, Inc . in March 2017, increasing scale by about 25% and leading to immediate entry into the S&P 500 (SP500).
Federal Realty
FRT's focus is to:
"own, manage, and re/develop urban mixed-use properties and high-quality open air retail properties located in drivable first ring suburbs of 9 major metropolitan markets."
FRT claims best-in-class demographics - density and household income. FRT's property count is only about 25% of KIM or REG, and incudes a different mix of tenants, including office and hotel, with 3,200 residential units. While 75% of properties have a grocery component, only 21% of income is from grocery anchored centers. About 37% of income is from mixed use/urban properties, 12% from office, 12% residential.
Kimco Realty Vs Regency Centers Vs Federal Realty - Performance Analysis
Historical Performance Period Selection
I would generally expect the performance of investments of this type to change rather slowly. Absent major M&A or significant financial upset, year N+1 should look a lot like year N, and looking back at 10 years of historical performance should be reasonable.
In this case, 10 years includes KIM's major M&A in 2021, and the conclusion of their major portfolio overhaul, but starts after the 2008 era financial crisis. So I stared with a 10-year historical performance period.
However, as I began the analysis, I noted an anomaly, which caused me to revisit the period duration and eventually redo the charts.
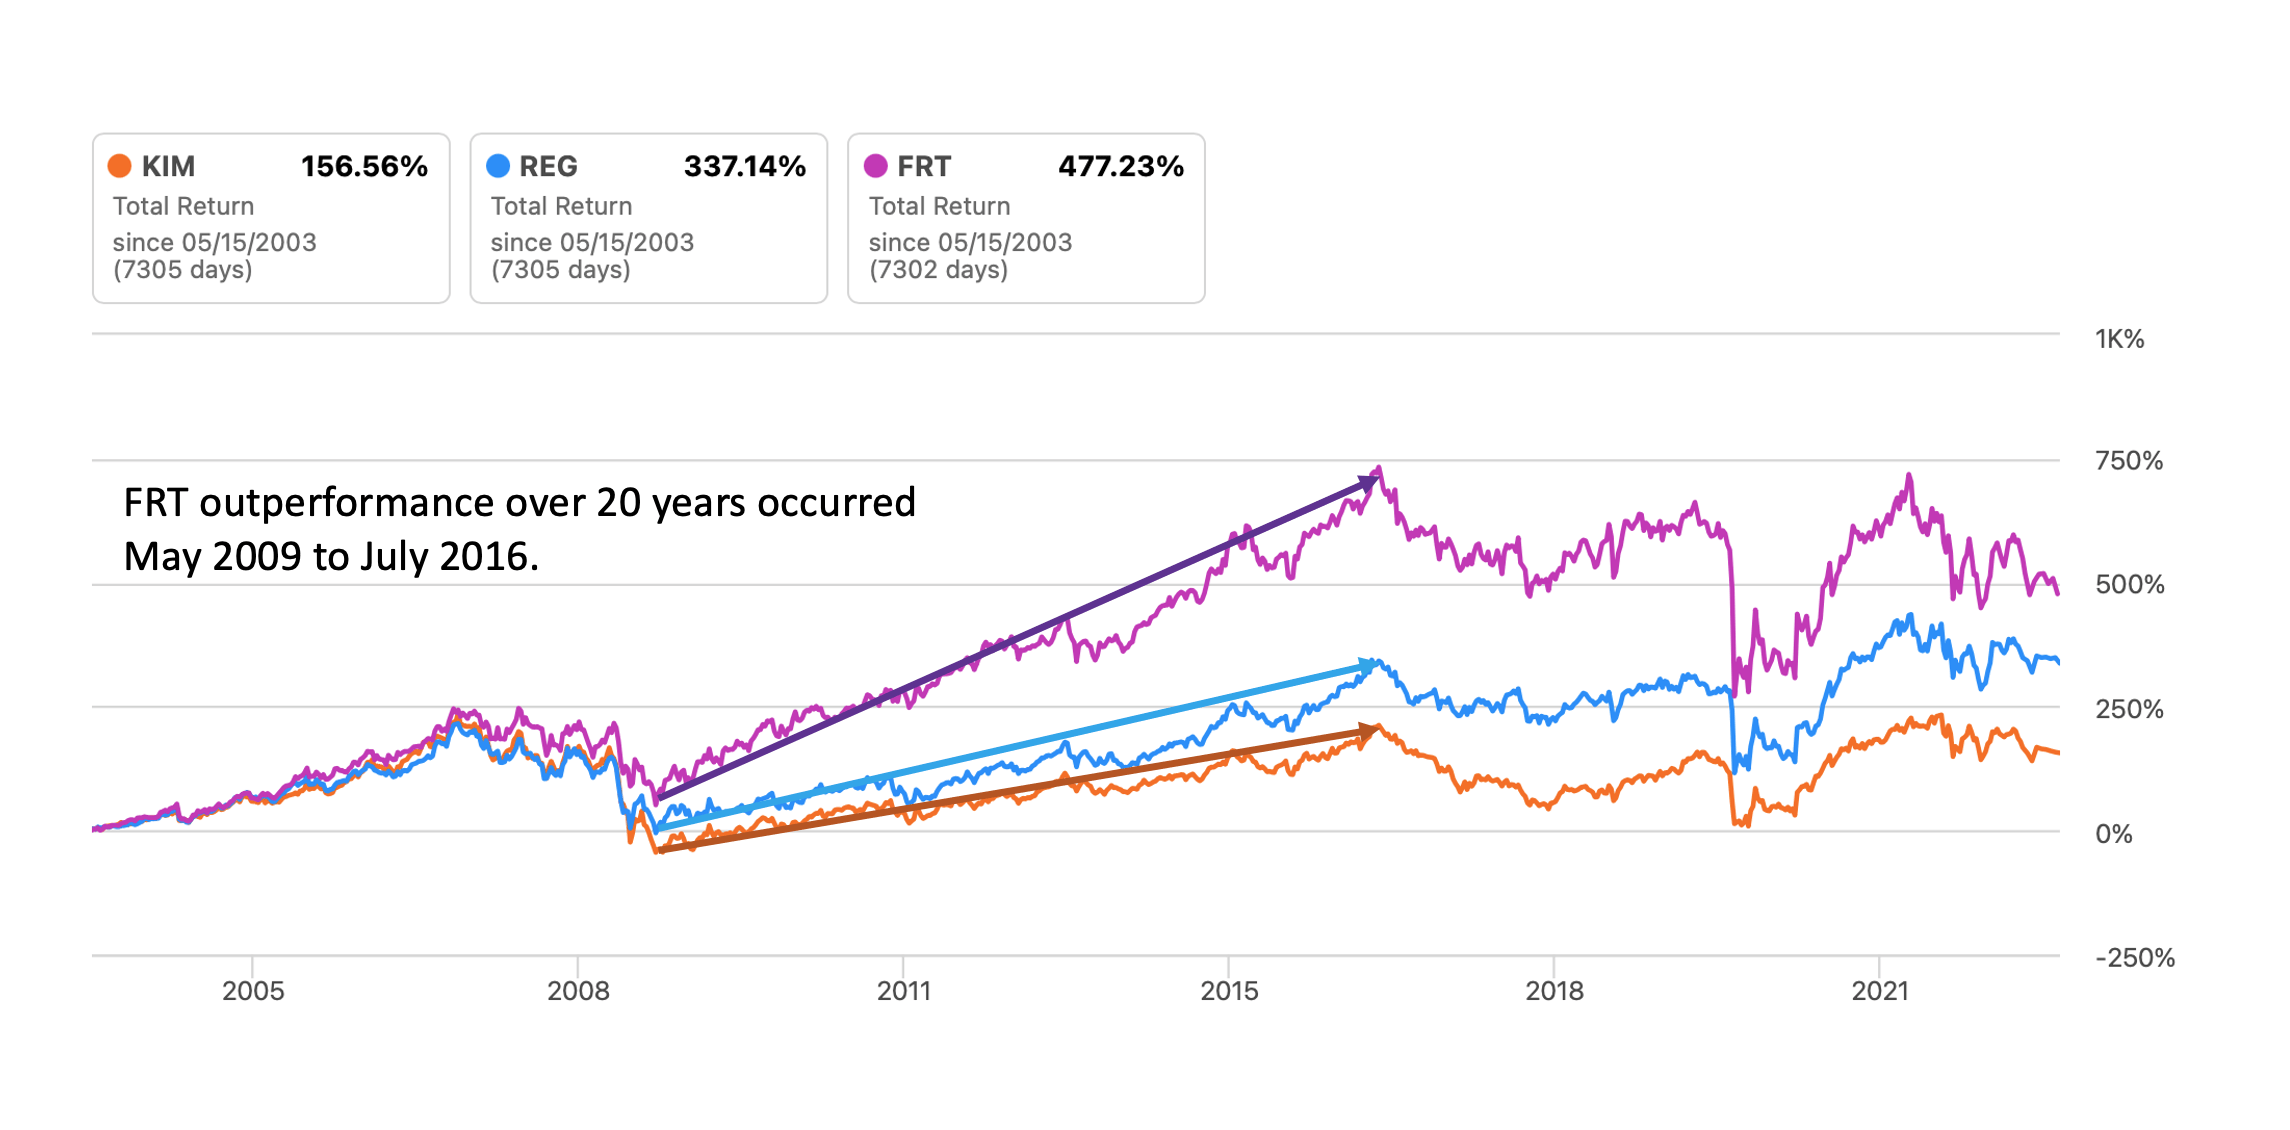
FRT analysis often uses performance over the last 20 years, which makes FRT look very good. But an examination of the 20-year chart below suggests that FRT's outperformance (clearly indicated by the added slope markers) occurred during the Great Recession recovery period starting about May 2009, but ending about July 2016. REG and KIM show the same effect, but with visibly lower growth rates.
Something changed in 2016; the peak in evident in all three stocks. Whatever provided that sustained outperformance appears to have been absent for the last 7 years.
2016 Performance Discontinuity (Chart by Seeking Alpha. Annotations by author.)
I would argue that a longer performance period is better suited to evaluating larger aggregates, e.g., Total Stock Market vs. Total Bond Market. The noise in individual components doesn't significantly distort the aggregate signal.
At the level of individual stocks, a shorter time frame is more appropriate. In this case, given the discontinuity in 2016, I would argue that a 7-year historical performance period is a better choice for assessing relative past performance, and perhaps informing expectations for tomorrow.
We thus will use a 7-year historical performance period for the charts in the remainder of this analysis.
Inflation
While inflation degrades returns across the board, for investors seeking preservation of value, it's useful to keep in mind how large a hurdle that can be.
The Bureau of Labor Statistics ((BLS)) provides a CPI calculator here , which reports a 27% increase over the last 7 years, from April 2013 to April 2023. A 27% gain would be required just to match inflation.
Tax Consequences
There would be current year tax consequences of selling KIM shares in a taxable account. Back of the envelope, a 2023 15% long term capital gain tax rate , applied to a $6 per share gain, would cost ~5% of the asset value in my case. Material, but not prohibitive.
Historical Performance
OK, we have now described the background for an analysis, and can take a look at historical performance.
The first chart show our shopping center candidates KIM, REG, and FRT vs. the Vanguard Real Estate Index Fund ETF Shares ( VNQ ).
This was an interesting chart, and frankly a bit surprising on at least two points: the VNQ Index outperformed all three individual stocks, and FRT significantly underperformed among the three. It was the initial 10-year version of this chart that motivated me to look further into FRT outperformance claims, and shift to the 7-year period.
This data doesn't encourage an increase in an already overweight shopping center allocation.
The next chart focuses in on just our three candidate REITs. FRT is distinctly unimpressive, delivering the worst total returns. Recall that CPI over this period increased 27%.
If we just look at share price, the results are fairly stark. KIM is down from $27 to $19, REG from $77 to $58, FRT from $150 to $90.
Dividends mitigated but were insufficient to offset share price losses. Dividend growth was unimpressive, with only REG keeping up with CPI. KIM has still not recovered to pre-Covid dividend levels.
In table format:
7 Year Dividend Growth (Seeking Alpha data, table by author.)
We can also take a look specifically at the Covid Era. The chart below starts 01 January 2020, shortly before Covid. KIM has the sharpest decline, lasting for a few months, and then recovered to match REG. BLS computes inflation over this period as 18%.
And finally, considering a possible shift from KIM to REG, we can take a look at the relative price movement in KIM and REG over the last year.
Risks
Most of the risks apply to all of the members of the peer group. All have a roughly similar business strategy.
As with other retail real estate, e-commerce poses long term challenges. Their client mix is shifting to e-commerce resistant businesses, and in several cases (e.g., Target) moving to providing distribution from their shopping center locations.
Perhaps the biggest risk is slow growth vs. inflation. None have provided a store of value sufficient to counteract inflation in recent years.
KIM Vs REG Vs FRT - Valuation and Ratings
Seeking Alpha's Wall Street valuation consensus projects an upside of 26% for KIM, 20% for REG, and 30% for FRT. From that perspective, they are all on sale.
Seeking Alpha also provides a convenient rating summary, shown here.
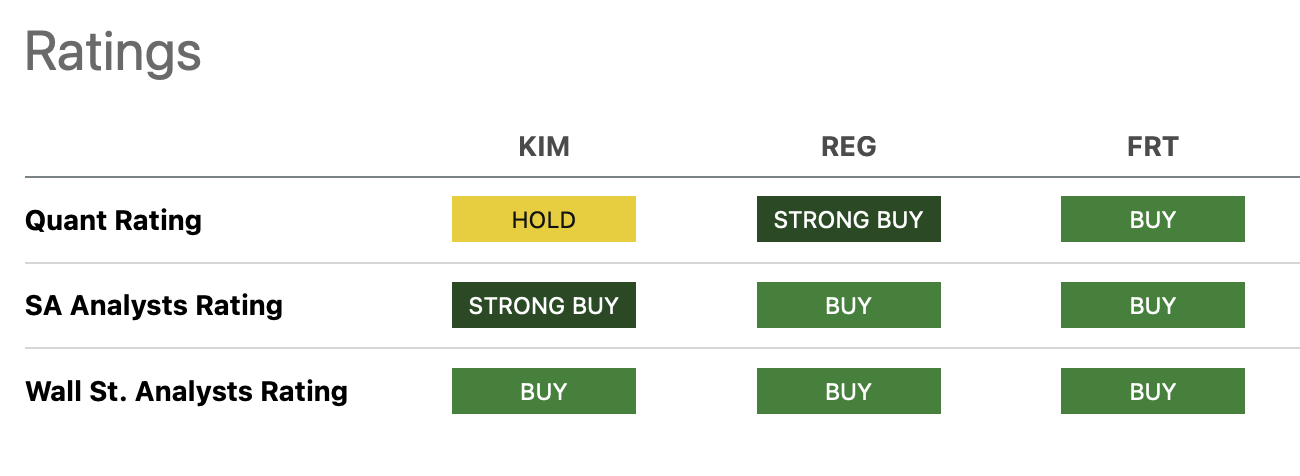
All three of these REITs are targeting basically the same market - dense, high income suburbs. It's a competitive market (with minor exceptions), and none have sufficient share to dominate a local market. Mergers may be accretive and reduce G&A, but don't appear to yield transformative financial performance. Its largely a game of incremental success.
Summary Conclusions
I would offer the following general conclusions:
- A 15% allocation to REITs is reasonable.
- A market weight allocation to shopping centers is reasonable for long-term diversification, but a 2x allocation is probably not justified.
- The strongest candidates for a long-term core position in the shopping center sector are KIM, REG, and FRT.
- None of these shopping center REITs has performed very well over the past 7 years; all have negative total returns before inflation. None has increased share price, and only REG has increased dividends enough to match a 27% increase in CPI.
- Within the shopping center sector, it would be prudent to spread the investment between two REITs, to diversify management, strategy, and execution.
- Based on current valuations and performance history, REG and KIM appears to be better choices than FRT.
In my particular case, based on this analysis, I made the following decisions and took the following actions:
- Reduce my shopping center allocation from 2X overweight to 1X weight.
- Divide the remaining shopping center allocation between KIM and REG.
- Invest the funds that are freed up in the REIT infrastructure sector, which is currently very underweight. The selection here is Crown Castle, Inc. (NYSE: CCI ) which has been on my watch list for some time.
- Sold 50% of KIM and bought CCI on 23 May 2023.
- Sold 15% of KIM and bought REG on 23 May 2023.
Investor Takeaways
Personally, I sold 65% of my Kimco Realty Corporation position, and am holding 35%. I would rate KIM stock a Hold under the Seeking Alpha rating system. Kimco Realty Corporation stock has, I believe, more room to improve than Regency Centers Corporation or Federal Realty Investment Trust. I am particularly encouraged by their explicit goal of earning an A rating from S&P, which may encourage good management decisions, and their substantial multi-family development plans.
Investors considering initiating or expanding a position in REITs may wish to consider the analysis in this article. I would highlight three points:
- Quantify the extent to which you are overweight or underweight in a sector versus the Nareit market cap benchmark.
- Define a position size target.
- The performance timeframe chosen for analysis may hide or highlight importance information. It may be useful to run the charts for a range of timelines to see what, if anything, turns up.
I hadn't done a dive into the fundamentals of the shopping center space before. The consolidation in the grocery business, for instance, surprised me. It's interesting to peel the onion, but it also makes clear that as investors, we are often making decisions on very incomplete knowledge.
The conclusion I ended up with here was not the outcome that I anticipated when I started the article. I've been reading, looking at data, and thinking about it, for a couple of weeks. Investors are seldom on a short clock.
For further details see:
Kimco Realty Stock: Redeveloping A Core REIT Position