KGC - Kinross: Valuation Less Attractive Following Recent Rally
Summary
- Kinross released its Q3 results this week, reporting quarterly production of ~529,200 ounces (continuing operations) and ~541,300 ounces attributable, an improvement from the year-ago period.
- While this represented a 12% increase year-over-year, the company was up against easy year-over-year comps, and production is down sharply on a three-year basis (Q3 2019: ~608,000 ounces).
- From a margin standpoint, Kinross saw continued margin compression, impacted by inflationary pressures and a weaker gold price on a year-over-year standpoint.
- While I see some upside for Kinross to a fair value of US$5.00, I don't see a low-risk buy point for the stock currently after a 40% plus rally from its July lows.
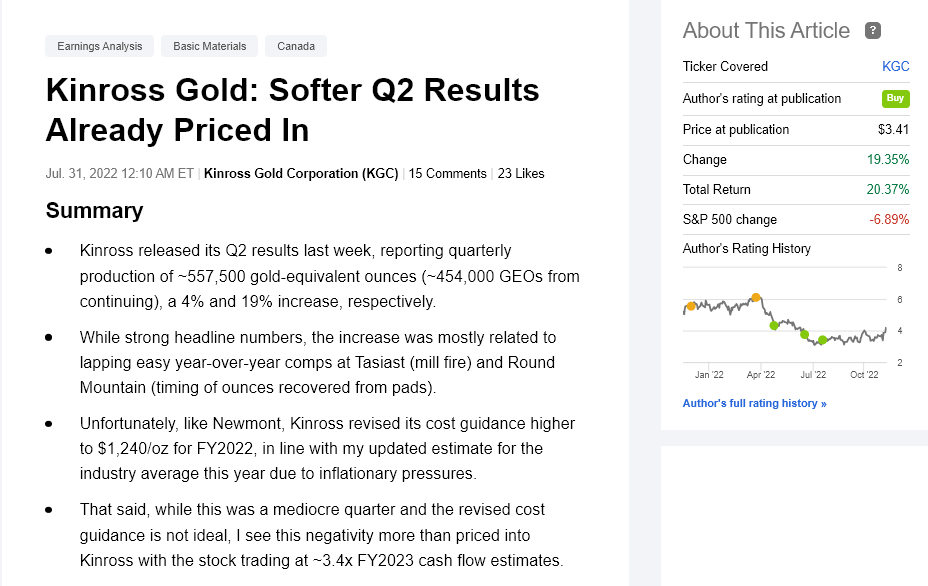
Just over three months ago, I wrote on Kinross ( KGC ), noting that while I was clearly early in my view that the stock had bottomed out above $4, the stock was very attractively valued after its Q2 results, and they already were priced into the stock at $3.40. This is because the stock was trading at just ~3.4x FY2023 cash flow estimates and well below 0.80x P/NAV with what looked to be peak costs at ~$1,300/oz in Q2. Since then, the stock has risen more than 20% and significantly outperformed the Gold Miners Index ( GDX ), benefiting from an attractive relative value proposition and an enhanced buyback program .
However, Kinross' relative value has decreased after the 20% rally in the stock vs. sluggish share-price performance from peers like Barrick Gold ( GOLD ), especially given that names like Barrick have much stronger balance sheets and should trade at a premium to names like Kinross. So, while I see Kinross as a decent buy-the-dip candidate below $3.60, given its aggressive buyback program/reasonable valuation, I think there are currently more attractive bets elsewhere in the sector. Let's take a look at the Q3 results below:
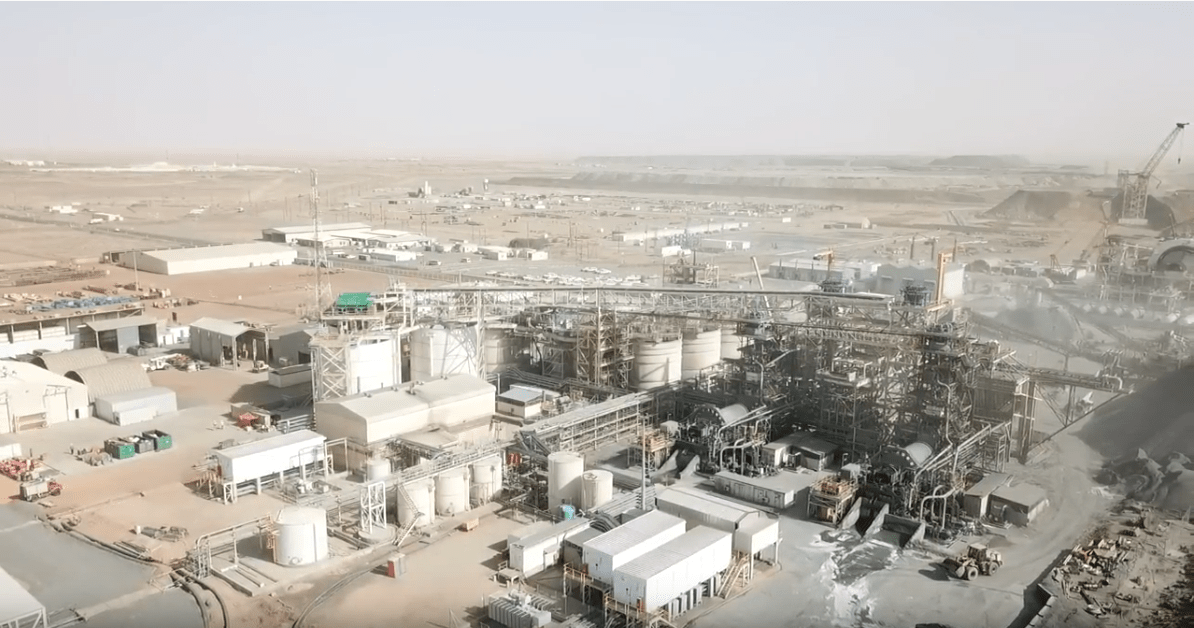
Tasiast Operations (Company Website)
Q3 Production and Sales
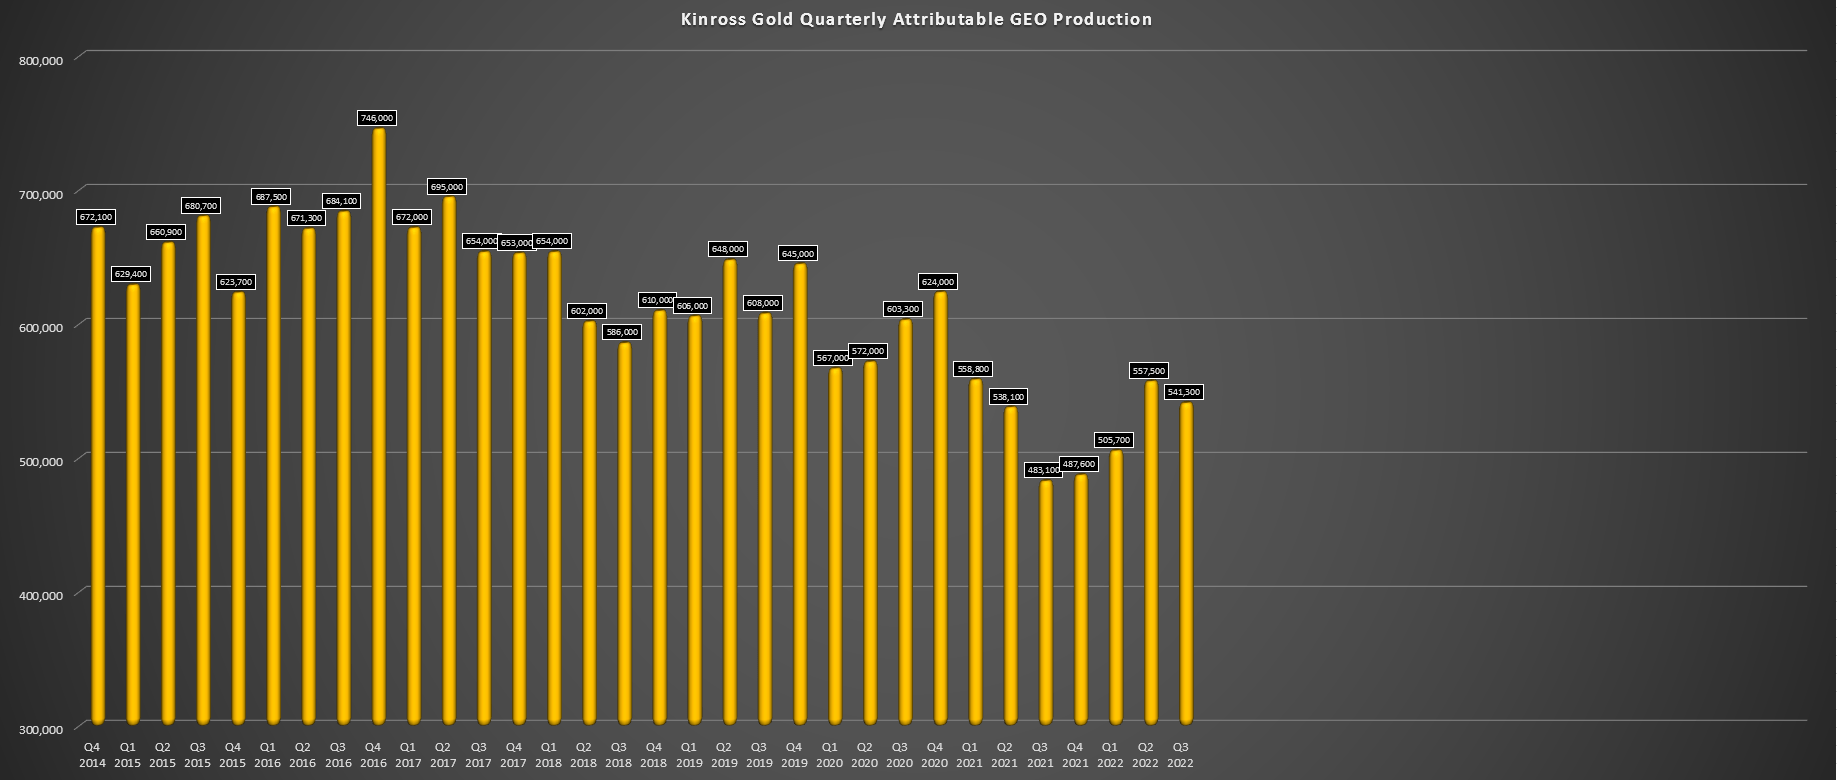
Kinross released its Q3 results this week, reporting quarterly production of ~529,200 ounces (continuing operations) and ~541,300 ounces attributable, an improvement from the year-ago period. While this represented a 12% increase year-over-year, the company was up against very easy year-over-year comps due to the suspension of Tasiast milling operations ( mill fire ), and production is down sharply on a four-year basis (Q3 2018: ~654,000 ounces). Obviously, this is partially related to the company's divestment of its Russian and Ghanian assets (Kupol/Chirano), but this is still a disappointing production trend relative to some of its peers like Agnico Eagle ( AEM ), especially from a production growth per share standpoint.
Kinross - Quarterly Attributable GEO Production (Company Filings, Author's Chart)
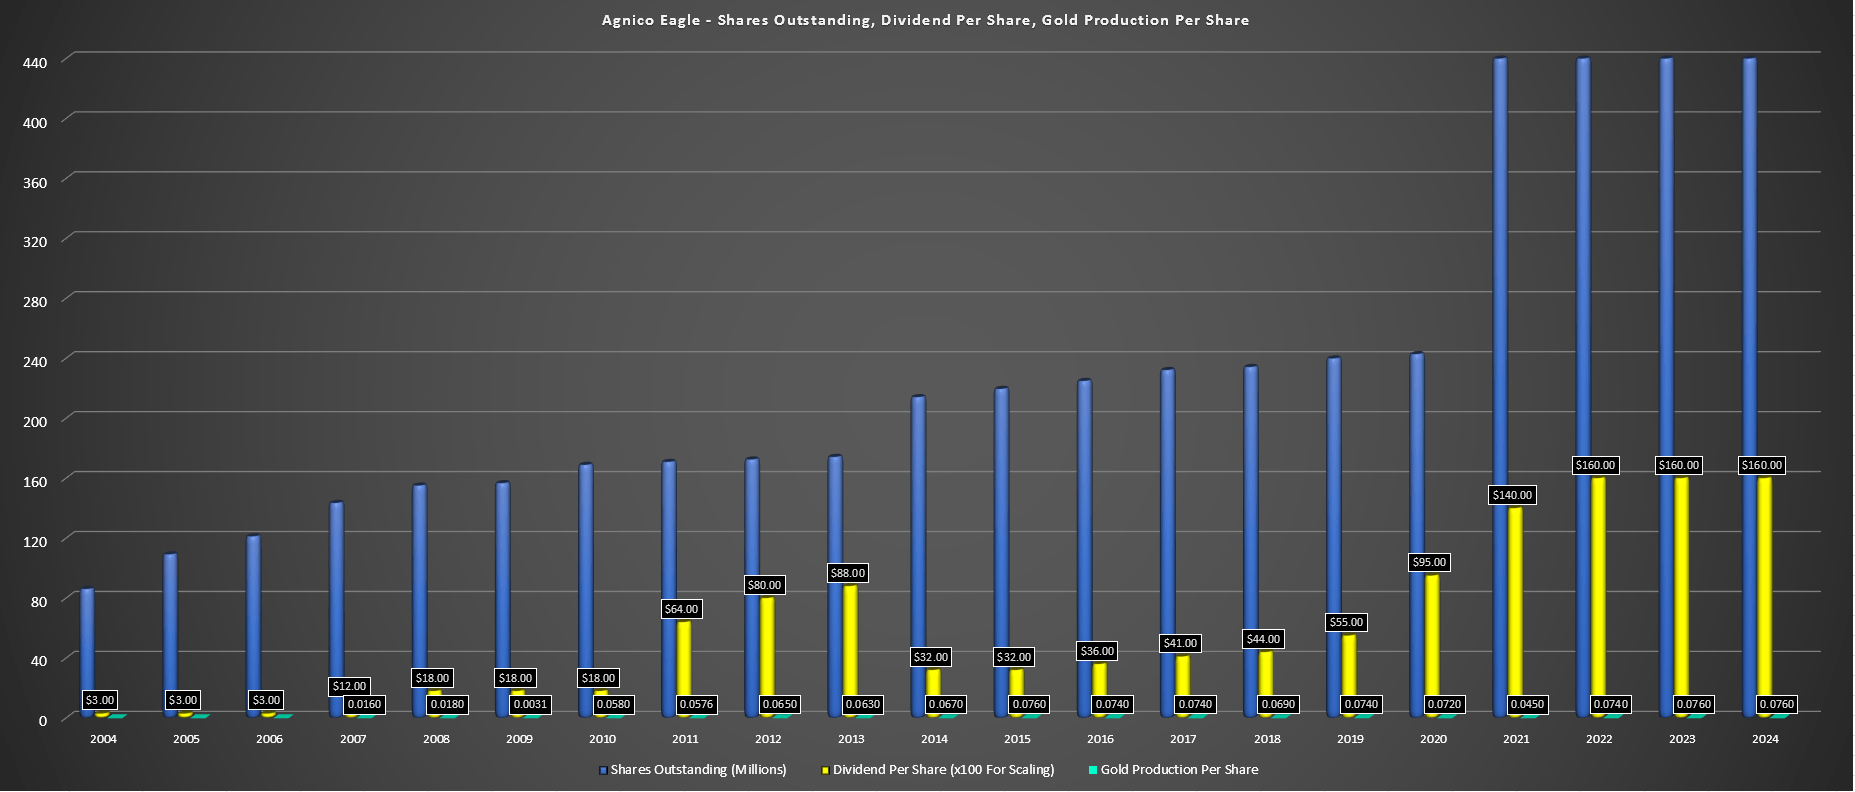
Agnico Eagle - Dividend Growth, Shares Outstanding, Production Per Share (Company Filings, Author's Chart)
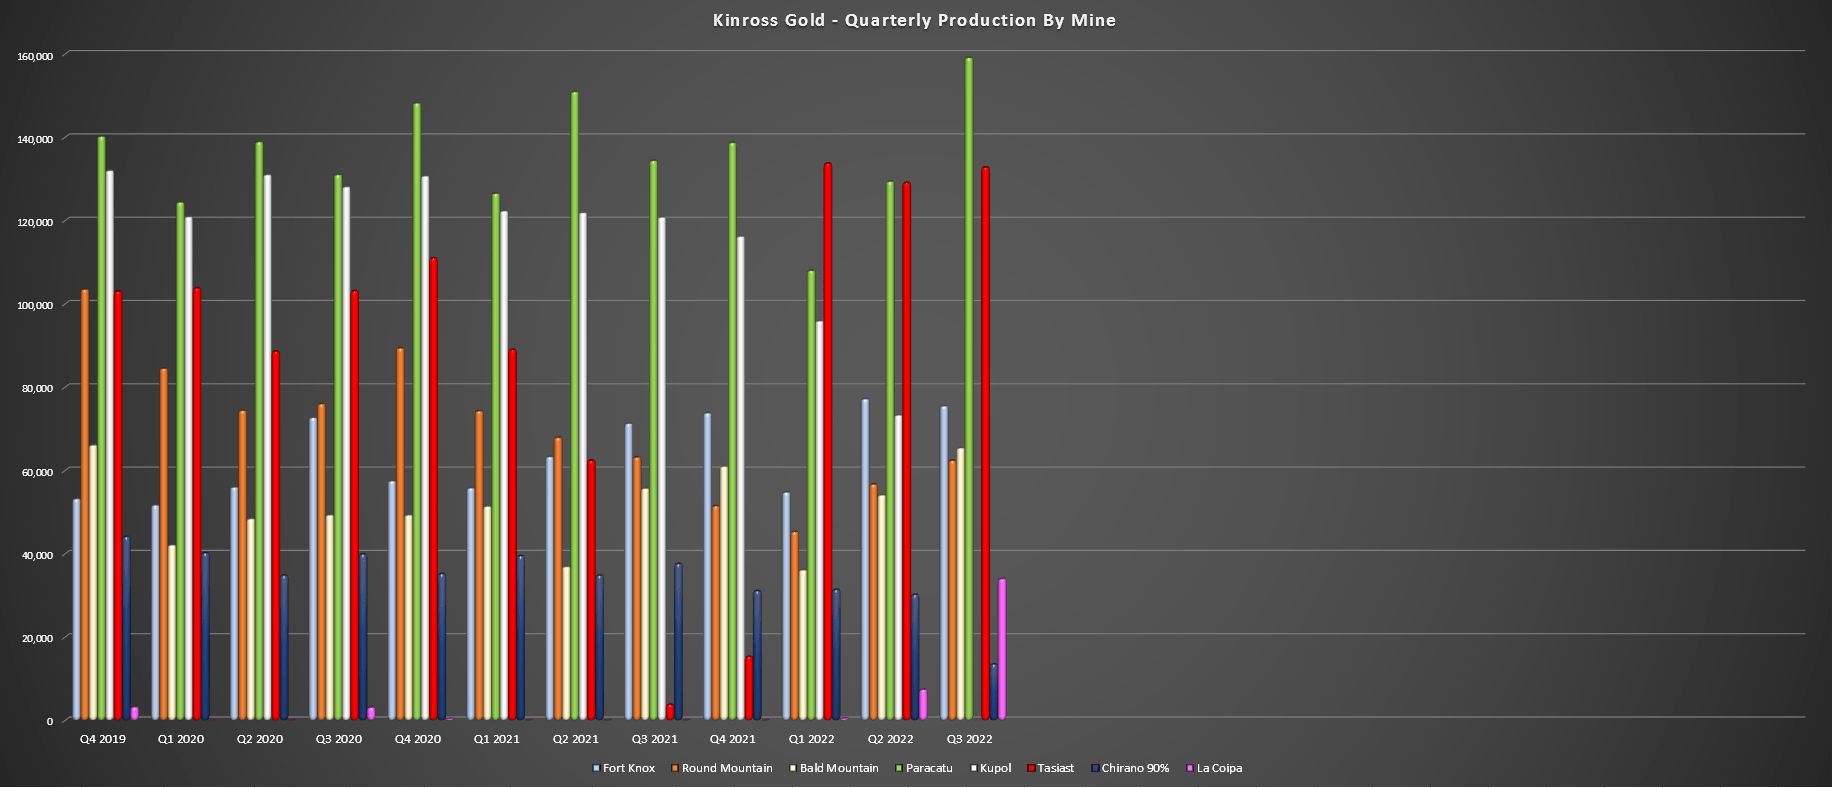
Digging into the quarter a little closer, production was higher at nearly all of Kinross' continuing operations, with the stand-out performers being Tasiast and Paracatu, which combined for ~292,000 ounces in the quarter, a significant increase from ~138,000 ounces in Q3 2021. As noted above, this was largely related to the restart of milling operations at Tasiast after just 4,000 ounces were produced in Q3 2021 and a very strong quarter from Paracatu on the back of higher grades (0.45 grams per tonne of gold) and recovery rates. From a development standpoint, Tasiast 24K remains on track for mid-2023, while the solar plant that will supplement 20% of Tasiast's power is on track for H2 2023, reducing fuel consumption.
Kinross - Quarterly Production by Mine (Company Filings, Author's Chart)
Moving to Kinross' smaller operations, Fort Knox and Bald Mountain saw higher production year-over-year, offset by a slight dip in production at Round Mountain. Meanwhile, at Kinross' newest contributor, La Coipa, production was up sharply on a sequential basis (~34,000 ounces vs. ~7,400 ounces), with issues with the pumps and the availability of spare parts due to supply chain headwinds. Kinross noted that mill throughput improved to 9,500 tonnes per day in October with multiple days at design capacity (13,000 tonnes per day), and the mill is expected to sustain these rates by the end of Q1 2023, providing a nice lift to production starting next year.
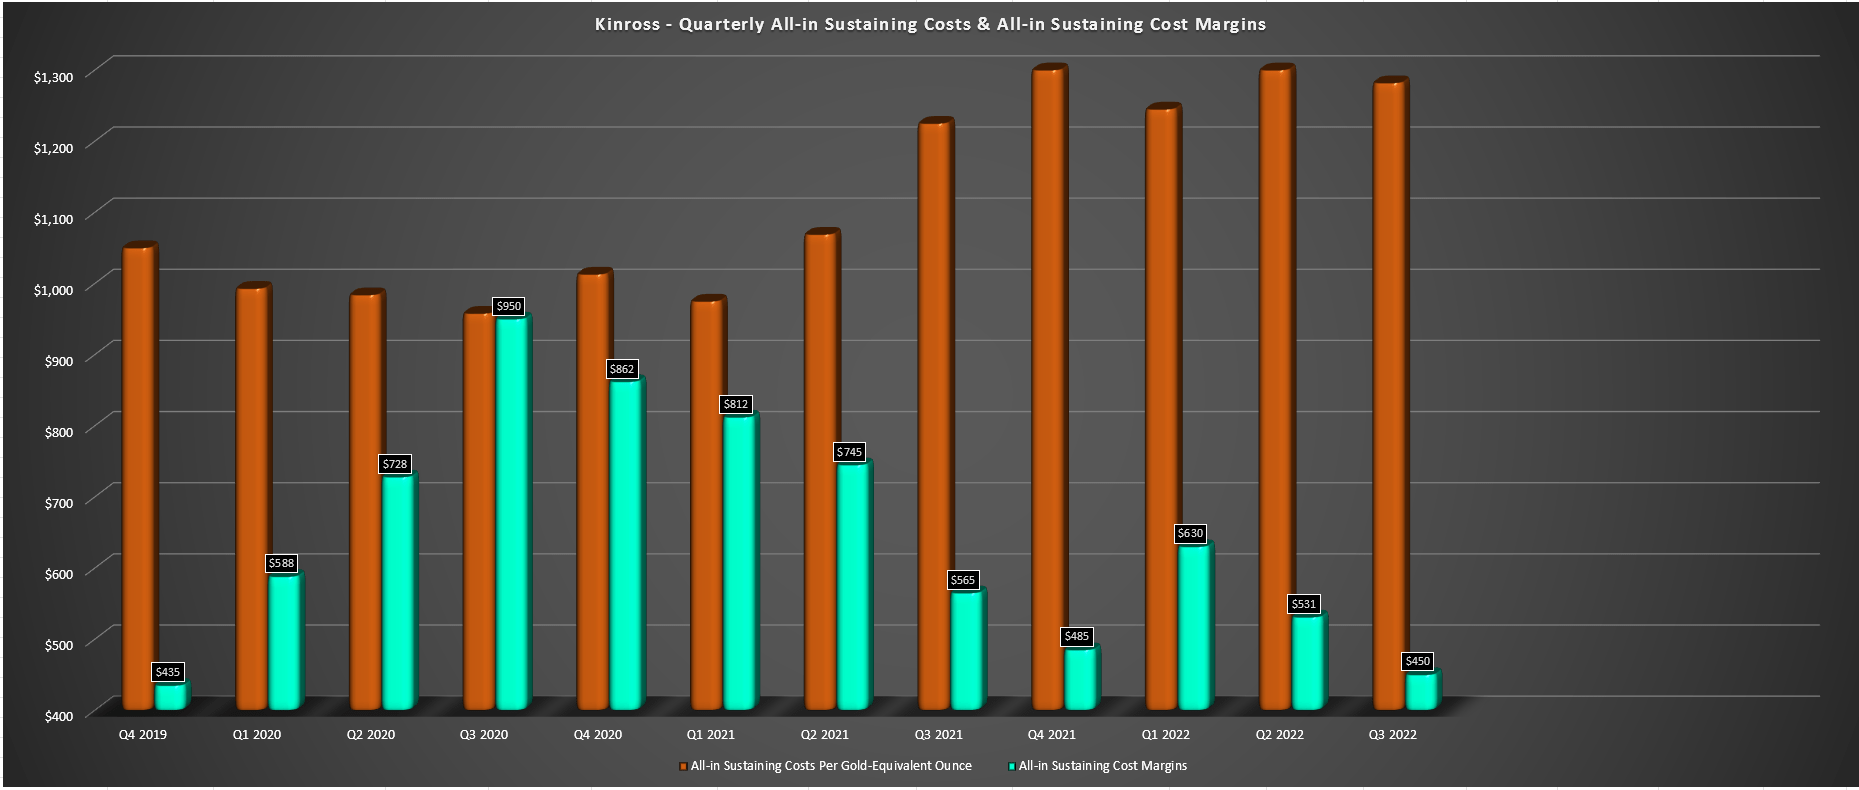
Unfortunately, while the increased production certainly helped from a revenue standpoint, given the increase in attributable ounces sold (~494,400 vs. ~325,100 GEOs), its cost performance left much to be desired. While this wasn't much of a deviation from the rest of the industry, where inflationary pressures and supply chain headwinds have impacted operating costs, Kinross is expected to see a significant jump in all-in-sustaining costs [AISC] year-over-year to $1,240/oz. Meanwhile, its production cost of sales is likely to exceed $900/oz. This would represent a 26% increase from FY2020 levels ($987/oz) on AISC, with its production cost of sales up approximately 25% as well. Let's take a closer look below:
Margins and Financial Results
Looking at the chart below, we can see that Kinross' AISC increased to $1,282/oz in Q3 2022, up from $1,225/oz last year and $958/oz in Q3 2020. The company noted that it had seen higher labor, contractor, fuel, maintenance, and reagent costs, and it hasn't helped that its lower-cost Kupol mine is no longer in the portfolio, which was a cash cow (FY2021 operating earnings: ~$442 million). Combined with a lower average realized gold price of $1,732/oz in Q3 2022 (Q3 2021: $1,792/oz), AISC margins dipped to $450/oz vs. $565/oz in the year-ago period.
Kinross - AISC & AISC Margins (Company Filings, Author's Chart)
Fortunately, commentary in the Q3 Earnings Season suggests that inflationary pressures may have peaked, and there has been some moderation in some areas already. This doesn't mean that costs will drop off a cliff, but it suggests that we may have seen peak costs for most producers in Q2/Q3 2022 and that we could see easier year-over-year comps in 2023. Meanwhile, with the gold price in the doldrums most of the year, it's possible that producers could get some help in this department as well, setting many of them up for margin expansion in H2 2023 vs. H2 2022 and on a sequential basis as most miners prepare for strong finishes to the year. To summarize, while inflationary pressures are negative, we look to be past the peak with better days ahead.
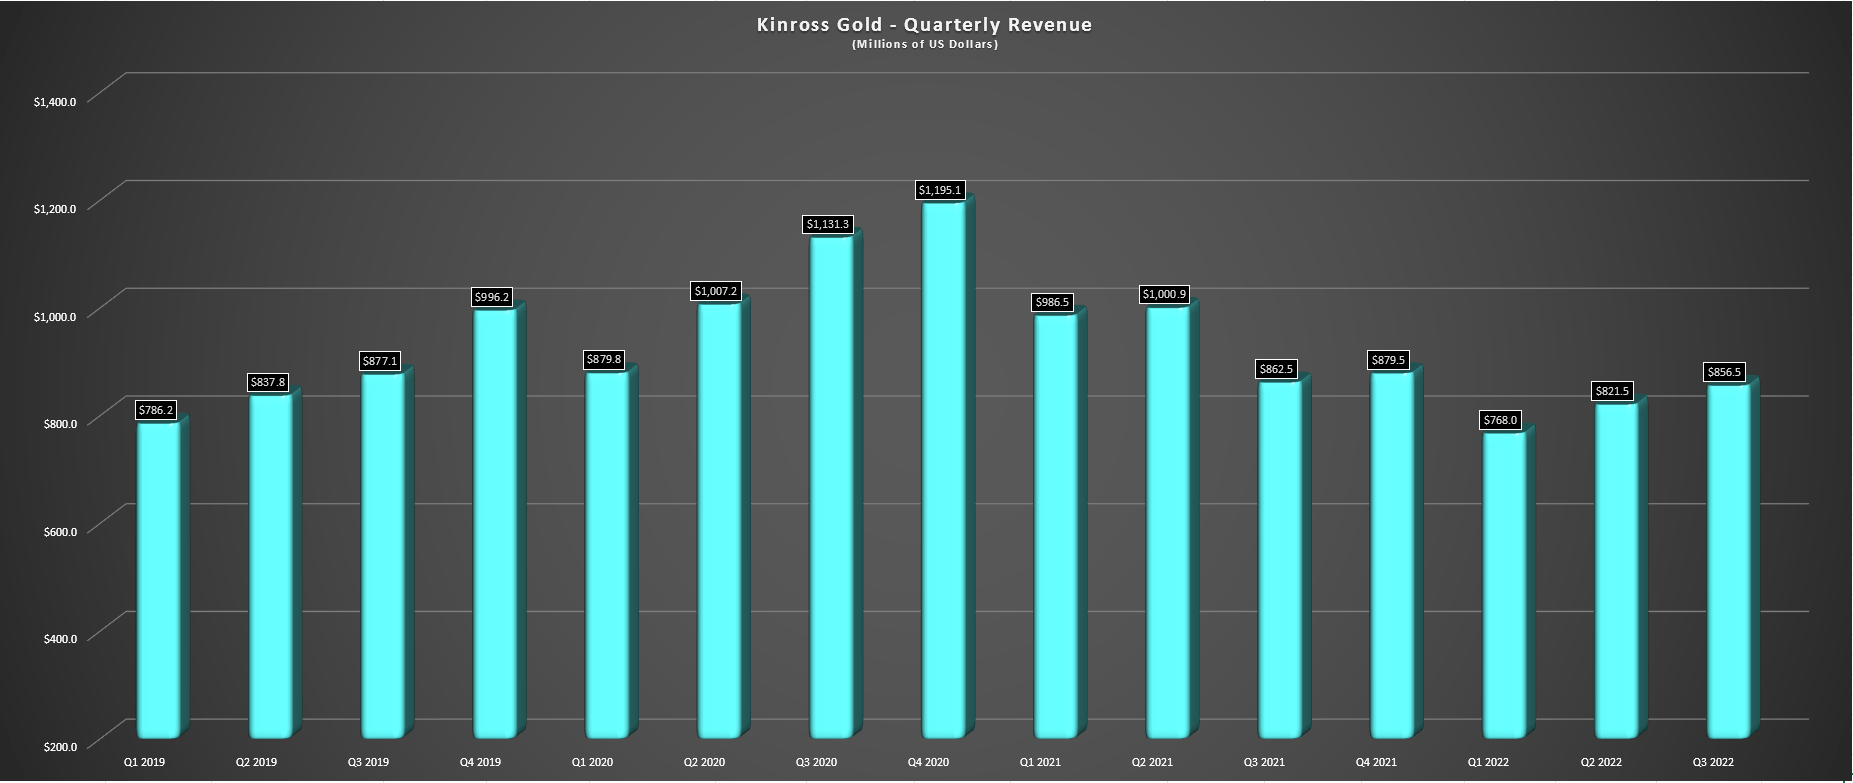
Kinross - Quarterly Revenue (Company Filings, Author's Chart)
Moving to quarterly revenue, Kinross reported sales of $856.5 million, translating to a 47% increase on a year-over-year basis. This was related to the lack of sales from its second-largest operation, Tasiast, and the benefit of higher production from most of its other assets. Unfortunately, free cash flow was still negative, with an outflow of $24.1 million, and trailing twelve-month free cash flow is in negative territory vs. $1.02 billion in trailing-twelve-month free cash flow in Q4 2020. This is mainly due to the weaker gold price, higher operating costs, and higher capital expenditures in the period. However, Kinross has done a great job taking advantage of its weak share price to retire a portion of its float, with ~$180 million in repurchases out of a total of $300 million. The result is that its share count is down over 3% from Q1 2022 levels.
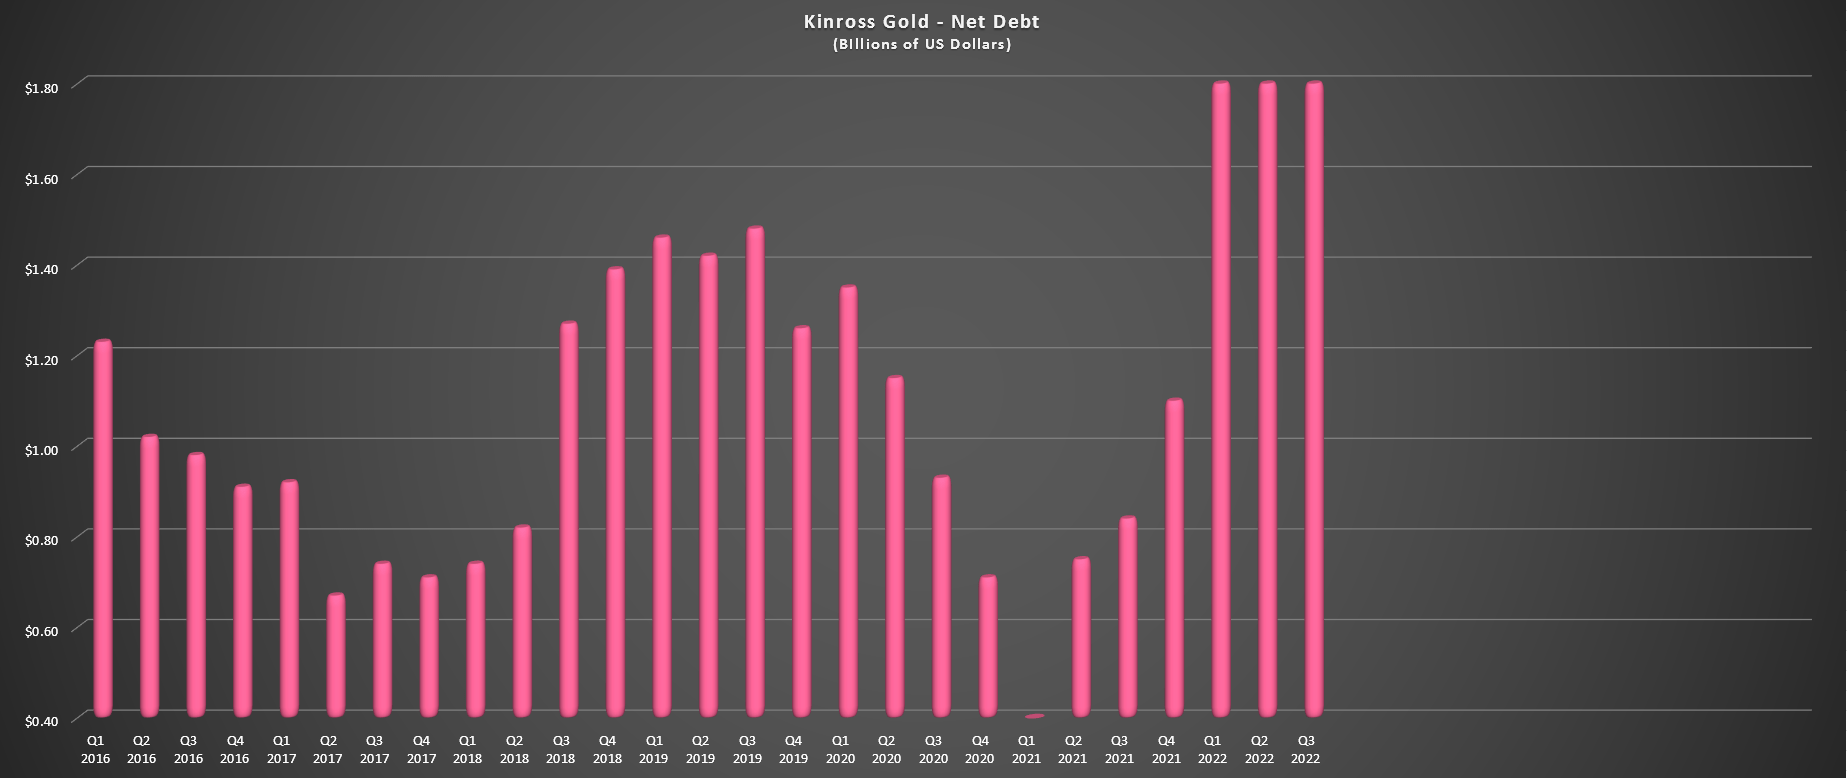
Kinross - Net Debt (Company Filings, Author's Chart)
Finally, Kinross' balance sheet shows the company is certainly not in nearly as good of a position as its peers. While Barrick is sitting with a net cash position, Kinross has ~$2.0 billion in net debt, even if it does have $2.0 billion in available liquidity. This means that while Barrick can continue to take advantage of buying back shares, paying out generous dividends, and even doing opportunistic M&A if gold were to fall further and hit new lows, this would be a lot more difficult for Kinross, given its weaker balance sheet. So, while I don't think Kinross' debt levels are alarming by any means, I think the largest producers with the best balance sheets could thrive if gold prices head below $1,550/oz for some reason, while Kinross would be in a position more to survive. Let's take a look at the valuation:
Valuation and Technical Picture
Based on an estimated ~1235 million shares outstanding (year-end 2022) and a share price of US$4.40, Kinross trades at a market cap of ~$5.43 billion and an enterprise value of ~$7.4 billion. This leaves the stock trading at approximately 0.99x P/NAV vs. an estimated net asset value of $5.50 billion. From a cash flow standpoint, and even assuming conservative cash flow per share estimates of $0.91 in FY2023, Kinross trades at just ~4.8x forward cash flow per share vs. what I believe to be a fair multiple of 5.6, with this figure being a 20% discount to its historical multiple (~7.0x cash flow).
If we assign a P/NAV multiple of 1.10x to Kinross to derive fair value and a fair cash flow multiple of 5.6, we arrive at a price target of US$4.88 and US$5.10, respectively. After weighting 60% to the P/NAV price target and 40% to the P/CF price target, I see a fair value for Kinross of ~US$5.00 per share. So, while the stock was significantly undervalued at my last update in late July, where I had a bullish view on the stock, I have since exited my position at US$4.25, given that the recent rally left the stock only 15% undervalued. This doesn't mean that KGC won't go higher, but with some growth stories trading at deep discounts to net asset value, I see more attractive bets elsewhere.
Kinross Article - July 31st (Seeking Alpha Premium)
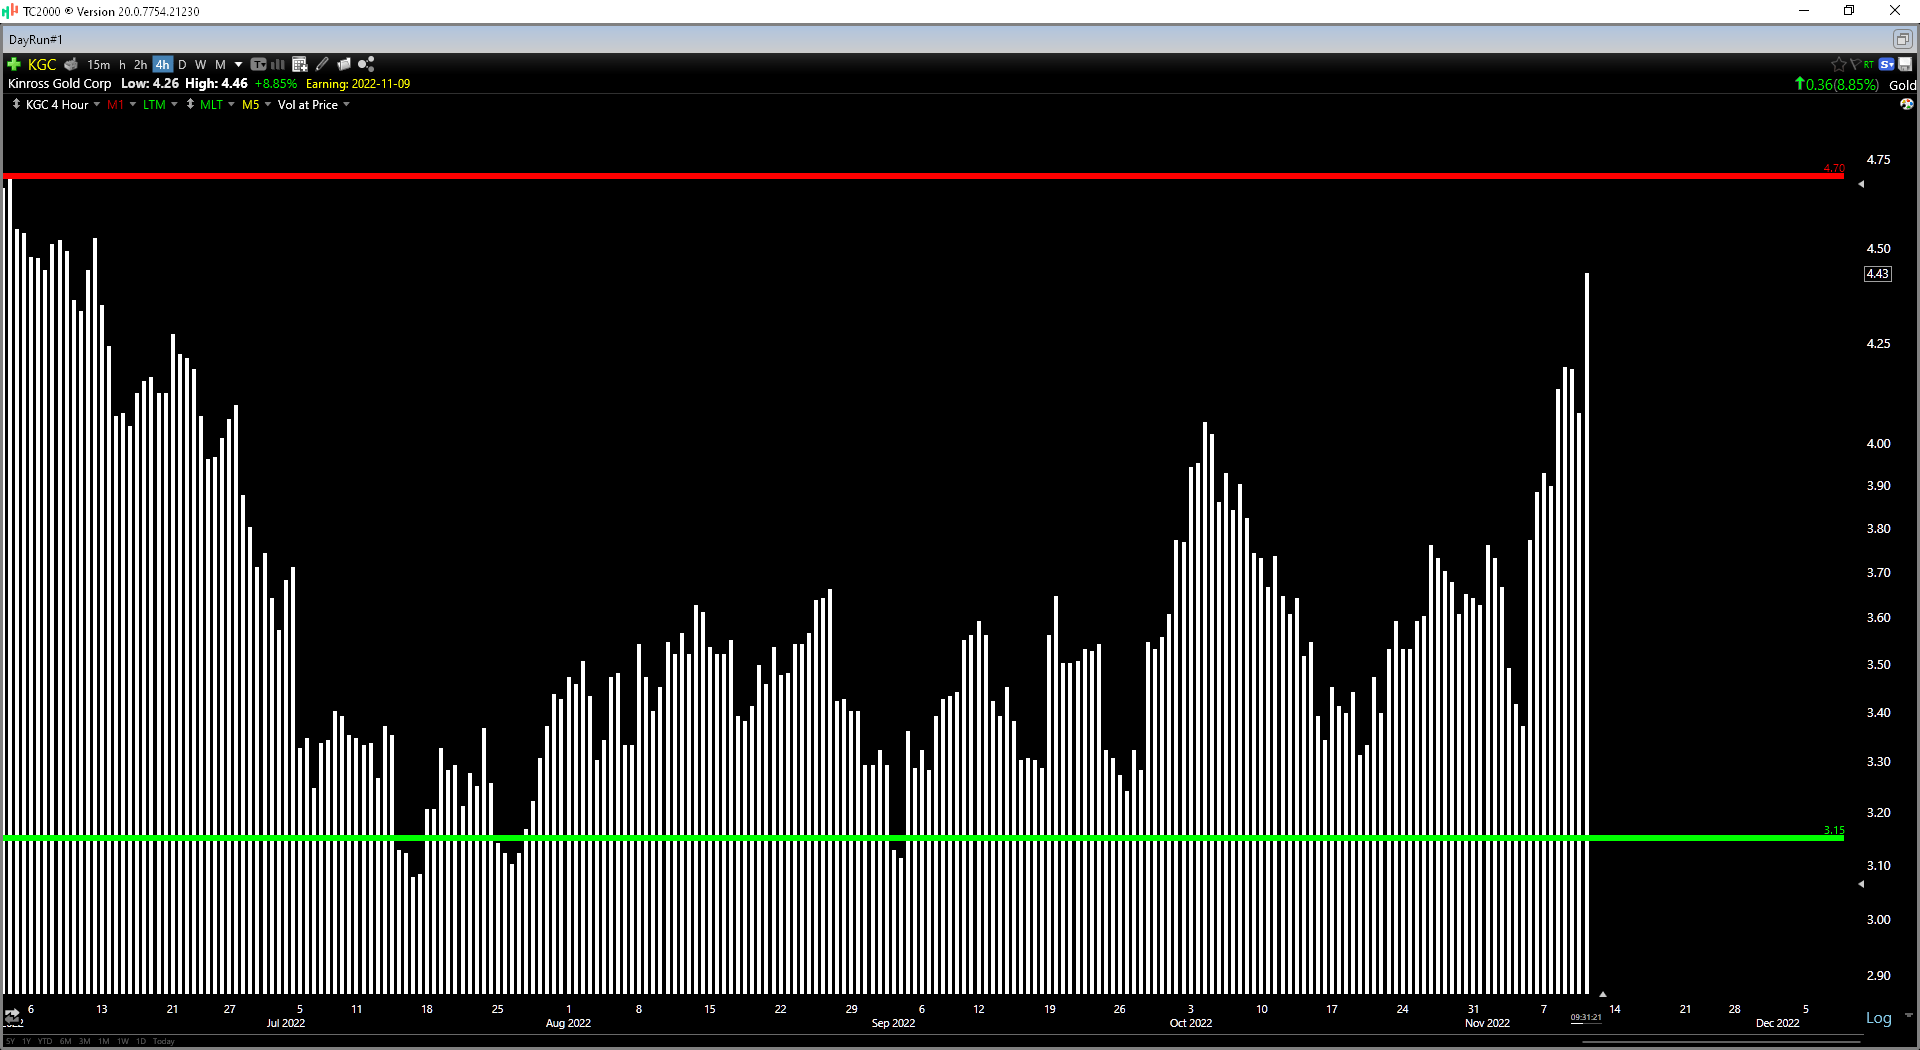
Moving to the technical picture, Kinross' recent rally has pushed it to the upper end of its expected trading range ($3.15 support vs. $4.70 resistance), with the stock currently having a reward/risk ratio of 0.24 to 1.0. Generally, I prefer a minimum 5.0 to 1.0 reward/risk ratio to justify entering new positions, so Kinross is nowhere near a low-risk buy point currently above $4.40. As pointed out above, this doesn't mean the stock can't keep climbing since a rising gold price will lift all boats. That said, if I were looking to put new capital to work in the gold sector, I wouldn't be rushing to buy KGC above $4.40 per share.
KGC Daily Chart (TC2000.com)
Summary
Kinross saw strong improvement in its production on a year-over-year basis, but this was primarily due to lapping easy year-over-year comps, and the company expects to see production come in below its guidance of ~2.15 million GEOs. Meanwhile, if we look out over the next three years, it looks like we'll see limited growth in annual production, with FY2023, FY2024, and FY2025 estimates sitting at 2.1, 2.1, and 2.0 million GEOs, respectively. This means that Kinross will rely reliant on the gold price to grow cash flow and earnings per share than peers, and some growth stories like i-80 Gold ( IAUX ) and Agnico Eagle have considerably more upside to fair value, in my view. So, if I were looking to put new capital to work, I favor these two names in the small-cap and large-cap space.
For further details see:
Kinross: Valuation Less Attractive Following Recent Rally