SITC - Kite Realty: Get It While It's Hot
2023-09-07 09:00:00 ET
Summary
- Kite Realty Group Trust has outperformed the average REIT, with a nearly double-digit gain in share price since April.
- Shopping Center REITs have seen record-high occupancy rates and double-digit rent growth, making them a good sector for investment.
- KRG has a strong balance sheet, impressive growth metrics, and an attractive valuation, making it a solid buy for investors.
Back in April, I published an article, pointing out 3 bargains in Shopping Center REITs. To my surprise, very few people bothered to read it. That's okay.
Let me start by showing you some of what you have missed so far. One of those three REITs was Kite Realty Group Trust ( KRG ), the subject of this article.
Here is how that pick has performed since the article was published:
| Ticker |
| Price 4/13 |
| Price 9/5 |
| Gain |
| Days |
| APR |
| KRG |
| $20.28 |
| $22.09 |
| 8.9% |
| 153 |
| 21.2% |
| VNQ |
| $82.47 |
| $81.56 |
| (-1.1)% |
| 153 |
| (-2.62)% |
Source: Seeking Alpha Premium, Market Watch, and author calculations
Kite Realty has gained nearly double digits in share price, while the average REIT as represented by the Vanguard Real Estate ETF ( VNQ ) has inched backward. Annualized, the VNQ slid at a (-2.6)% pace, while KRG raced along at an annual pace of +21.2% (If only all my picks worked out that well).
Now I'm back to let you know the party isn't over, and it's not too late to get in.
But before I do, maybe you think Shopping Center REITs are not a good sector for investment at present. If so, please consider the following three points, courtesy of Hoya Capital, the leading source for REIT sector-level analysis.
- Near-zero new development of Shopping Centers coming out of the pandemic, plus positive net store openings since 2021, has driven occupancy rates to record highs, giving Strip Center REITs some long-awaited pricing power.
- This favorable property-level supply/demand landscape has led to double-digit rent growth spreads since mid-2022 and the best earnings "beat rate" of any property sector during that time.
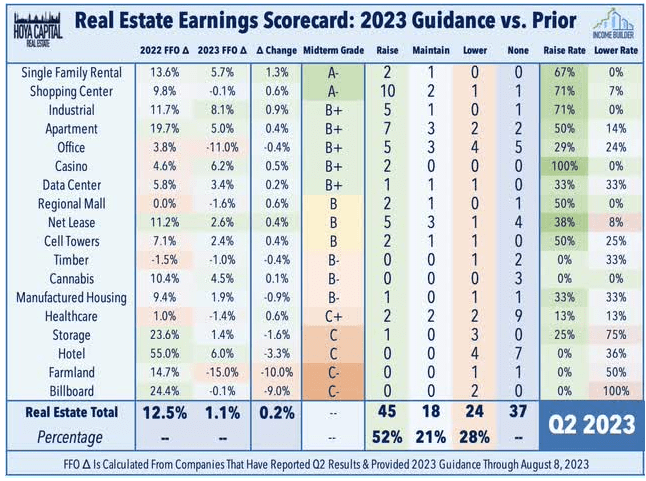
- Shopping Center REITs were notable standouts in Q2 earnings season. Of the 14 Shopping Center REITs, 10 of the companies (71%) raised guidance, and only one (7%) lowered. All in all, with a mid-term grade of A- from Hoya Capital Income Builder, Shopping Center REITs rank as the second-best performing of the 18 REIT sectors in Q2 earnings up to now.
In a recent article , Hoya Capital added,
Kite Realty was the upside standout, reporting cash leasing spreads of 14.8%, which drove a 130 basis point upward revision to its same-store NOI outlook and a 160 basis point boost to its FFO outlook . . . The versatility and larger footprint of the strip center format have been a winning formula. With 'embedded' dividend growth and solid positioning for a variety of economic scenarios, shopping center REITs remain one of our favorite value-oriented REIT sectors.
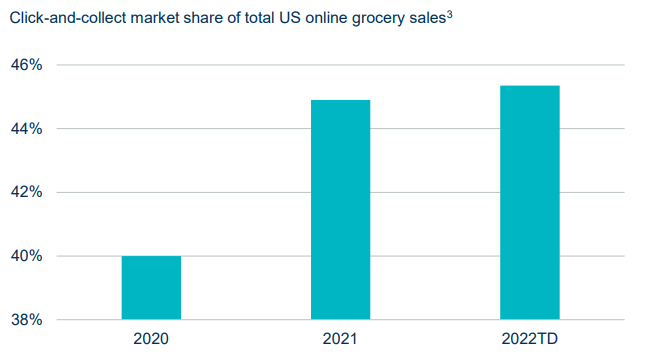
Please note also that we are talking about open-air Shopping Centers, as opposed to Regional Malls. Shopping Centers are closer to their customers, and enjoy higher trip frequency, especially if grocery-anchored. Shopping Centers are also benefitting from the WFH (work from home) trend, which drives more local shopping, and the BOPIS (buy online pickup in store) trend, both of which are here to stay.
Meet the company
Kite Realty Group
Founded in 1971 and headquartered in Indianapolis, Kite Realty ( KRG ) went public as a REIT in 2004, and currently owns 181 open-air shopping centers and mixed-use assets in the U.S., totaling approximately 29 million square feet of gross leasable space. Of the portfolio,
- 94.2% is occupied, (with 96.5% of anchor stores occupied, and 89.4% of other shops),
- 76% of ABR (annual base rent) comes from centers with a grocery component, and
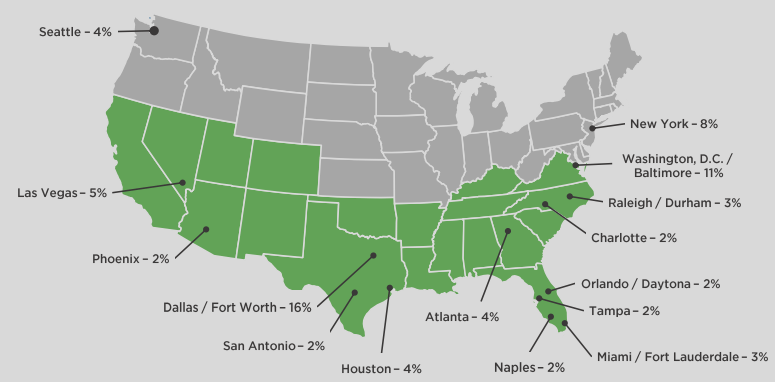
- 67% of ABR comes from assets in the Sunbelt.
Five U.S. states account for more than half the company's ABR:
- Texas at 26%
- Florida at 11%
- Maryland at 7%
- New York at 6%, and
- North Carolina at 6%
Of the company's total ABR,
- 60% comes from community/neighborhood shopping centers, 86% of which have a grocery component
- 20% from mixed-use/lifestyle shopping centers, 60% of which have a grocery component, and
- 19% from so-called power centers, with 66% having a grocery component.
The average size of these centers is 158,000 square feet, and within three miles of KRG properties, the average population is 103,000 people, with the average household income well above average at $117K.
Tenant diversification is exceptional, with the largest tenant contributing only 2.5% of ABR, and the top 15 together accounting for only 20.4%.
KRG investor presentation
Retail tenants are also diverse in their focus, with ABR split almost evenly between Essential Retail (31%) plus Restaurants (18%) on the one hand, and Other Retail (51%) on the other hand.
KRG investor presentation
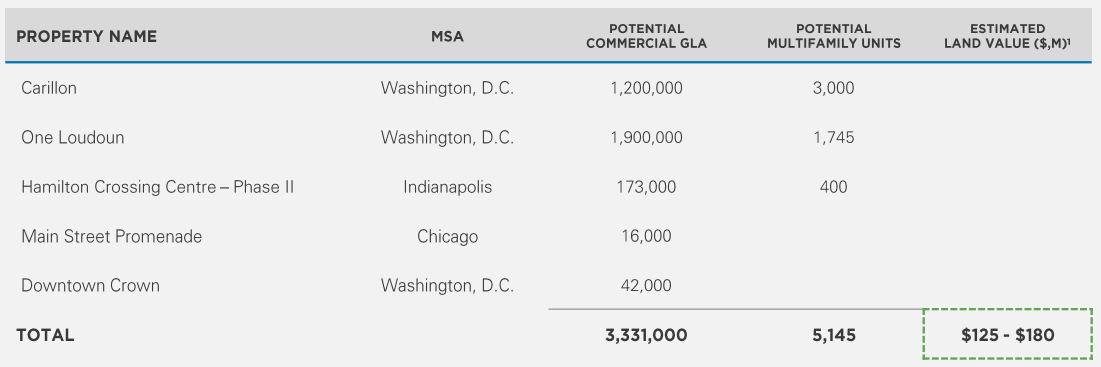
The company also owns 5 land parcels, valued somewhere between $125 and $180 million, that could support over 5,000 new multifamily units or 3.3 msf of additional commercial space.
KRG is increasing its multifamily exposure, with a major new mixed-use/lifestyle 50/50 joint venture development called The Corner underway. With anticipated stabilization in Q4 of next year, it includes 285 multifamily units and 24,000 square feet of ground floor retail. KRG's share of the total project cost is expected to be nearly $32 million, with a projected cash yield north of 6%, and no equity required of KRG.
Since 2016, the company has reduced its net debt to adjusted EBITDA from 7.0x to 5.0x.
KRG investor presentation
Simultaneously, KRG has grown its ABR per square foot from $15.53 to $20.19.
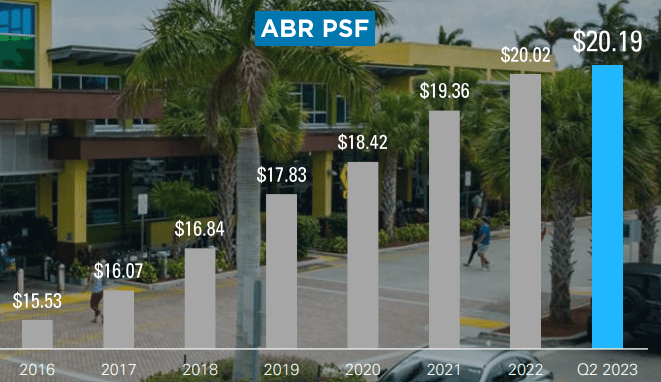
The company has also been successful in building in more CPI protection and fixed rent bumps of at least 3% into their leases this year.
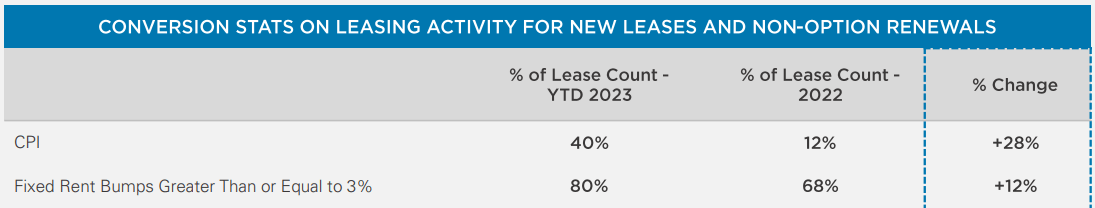
Quarterly Results
- Quarterly FFO of $0.51 outperformed the FactSet consensus by 3 cents (6.25%) per share.
- Same property NOI increased 5.7% YoY (year over year), driven by increased occupancy, overage rent, and lower bad debt.
- Blended cash leasing spreads of 12.5%, unheard of in this sector for the past several years.
- 200 bps (basis points) of spread between leases and occupied space, meaning $27 million in NOI will come online, with about two-thirds of that total realized by the end of this year.
KRG is proud of its operating platform, which they believe drives superior efficiency and operating margins. There is evidence for that in the Q2 results, as retail NOI margin (74.4% versus 70.5%), retail recovery ratio (87.4% versus 77.3%), and blended cash spreads (12.5% versus 9.7%) are higher for KRG than the peer average, and G&A expense as a percentage of total revenue is lower.
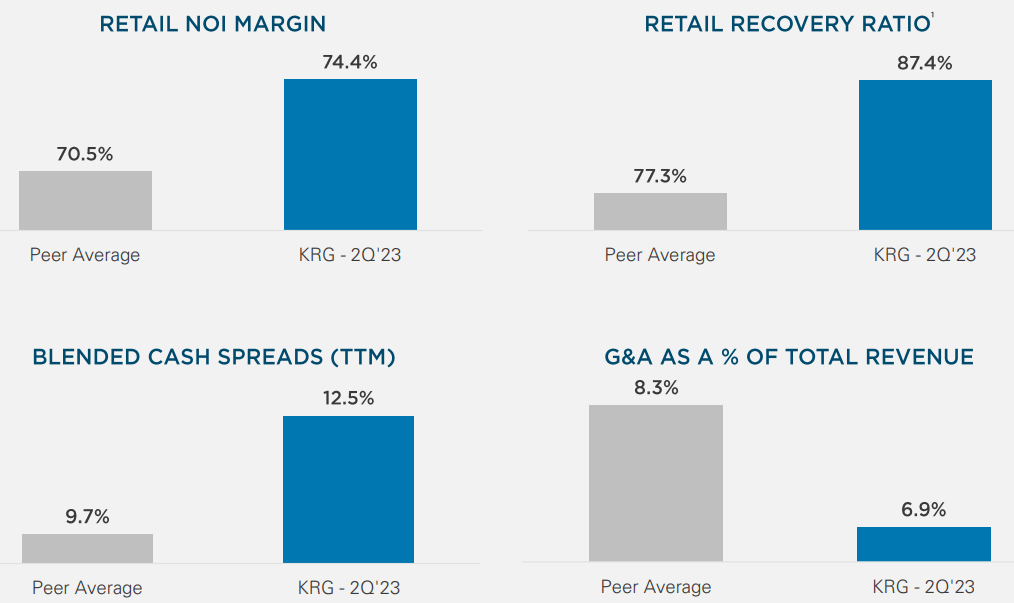
That peer group includes:
- Acadia Realty ( AKR ),
- Brixmor Property Group ( BRX ),
- Federal Realty Trust ( FRT ),
- Kimco Realty ( KIM ),
- Phillips Edison & Company ( PECO ),
- Regency Centers ( REG ),
- Retail Opportunity Investments ( ROIC ), and
- SITE Centers ( SITC )
Growth metrics
Here are the 3-year growth figures for FFO (funds from operations), and TCFO (total cash from operations).
| Metric |
| 2019 |
| 2020 |
| 2021 |
| 2022 |
| 3-year CAGR |
| FFO (millions) |
| $128 |
| $106 |
| $86 |
| $426 |
| -- |
| FFO Growth % |
| -- |
| (-17.2) |
| (-18.9) |
| 395.3 |
| 49.3% |
| FFO per share |
| $1.52 |
| $1.26 |
| $1.50 |
| $1.93 |
| -- |
| FFO per share growth % |
| -- |
| (-17.1) |
| 19.0 |
| 28.7 |
| 8.8% |
| TCFO (millions) |
| $138 |
| $96 |
| $100 |
| $379 |
| -- |
| TCFO Growth % |
| -- |
| 69.6 |
| 4.2 |
| 279.0 |
| 40.0% |
Source: TD Ameritrade, Hoya Capital Income Builder, and author calculations
Thanks to a massive 395% leap in 2022 (caused in part by timely share issuance) that reversed a 3-year pandemic-induced downward trend, total FFO for KRG has grown at a jaw-dropping annual rate of 49.3%.
The company's cash flow and FFO/share began turning around in 2021, and have proceeded at similarly impressive annual growth rates of 40.0% and 8.8% respectively.
Meanwhile, here is how the stock price has done over the past 3 twelve-month periods, compared to the REIT average as represented by the Vanguard Real Estate ETF ( VNQ ).
| Metric |
| 2020 |
| 2021 |
| 2022 |
| 2023 |
| 3-yr CAGR |
| KRG share price Sept. 5 |
| $12.59 |
| $20.78 |
| $20.78 |
| $22.09 |
| -- |
| KRG share price Gain % |
| -- |
| 65.1 |
| 0.0 |
| 6.3 |
| 20.6% |
| VNQ share price Sept. 5 |
| $81.90 |
| $110.92 |
| $91.88 |
| $81.56 |
| -- |
| VNQ share price Gain % |
| -- |
| 35.4 |
| (-17.2) |
| (-11.3) |
| (-0.1)% |
Source: MarketWatch.com and author calculations
The last two 12-month periods have been tough for REITs, with the VNQ flat as a pancake at (-0.14)%, while KRG investors have been treated to an impressive average annual return of 20.6% on share price alone. If you bought KRG during the depths of the pandemic, you cleaned up. Kudos to Seeking Alpha analyst Julian Lin for being the first to call this.
Balance sheet metrics
Here are the key balance sheet metrics. In a sector where the balance sheets are still a bit more distressed than average, KRG's investment-grade balance sheet liquidity ratio and Debt/EBITDA stand out from the crowd. Although its debt ratio is a bit high, the Debt/EBITDA ratio suggests they can earn their way out of that mild problem.
| Company |
| Liquidity Ratio |
| Debt Ratio |
| Debt/EBITDA |
| Bond Rating |
| KRG |
| 2.06 |
| 40% |
| 5.1 |
| BBB- |
Source: Hoya Capital Income Builder, TD Ameritrade, and author calculations
The company reports $1.2 billion in liquidity as of June 30, over against $3.02 billion in long-term debts, held at a weighted average interest rate of 4.35%, and only 2.4% of the debt held at variable rates.
Debt maturities are favorable, with relatively small payments due this year and next, and maturities exceeding 15% of the total outstanding debt in only one year of the next 8 (2026).
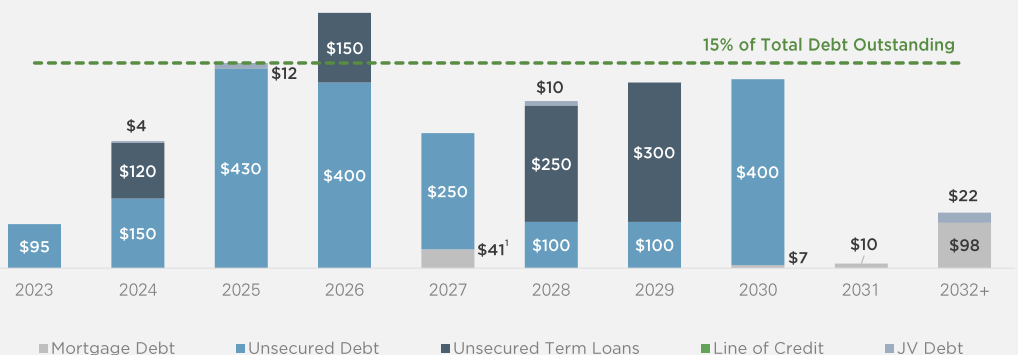
Dividend metrics
As a dividend payer, KRG presents a mixed picture. Its current yield is typical of Shopping Center REITs as a whole, but after cutting deeply during COVID, the company has not yet fully restored the dividend to its 2018 level of $0.3175 per share. In fact, even before COVID, KRG had cut its dividend significantly, to $0.2061 per share, restoring it only briefly before the crisis.
| Company |
| Div. Yield |
| 5-yr Div. Growth |
| Div. Score |
| Payout |
| Div. Safety |
| KRG |
| 4.35% |
| (-4.8)% |
| 3.75 |
| 50% |
| -- |
Source: Hoya Capital Income Builder, TD Ameritrade, Seeking Alpha Premium
Dividend Score projects the Yield three years from now, on shares bought today, assuming the Dividend Growth rate remains unchanged.
Seeking Alpha Premium does not assign a Dividend Safety grade to KRG, for reasons that are not clear to me, but with a conservative payout ratio of 50% and excellent 5.1x Debt/EBITDA, there is no reason to suspect a dividend cut is on the horizon.
Valuation metrics
Despite its strength and recent appreciation in share price, KRG still sells at a mere 11.1x FFO '23, far below the REIT average. The company's (-18.2)% discount to NAV is typical of REITs as a whole.
| Company |
| Div. Score |
| Price/FFO '23 |
| Premium to NAV |
| KRG |
| 3.75 |
| 11.1 |
| (-18.2)% |
Source: Hoya Capital Income Builder, TD Ameritrade, and author calculations
What could go wrong?
Increasing leasing spreads and profitability will eventually attract a wave of new development, and KRG competes with more than a dozen publicly-traded REITs for existing opportunities and market share.
In my opinion, the lurking shadow of a likely civil war in the U.S. is a risk all investors should pay attention to. Open-air shopping centers would be highly vulnerable to looting and vandalism in the event of widespread social instability.
Investor's bottom line
Strong balance sheet, stellar quarterly results, sturdy if unspectacular growth prospects, and an attractive price, make KRG a very tempting proposition for value investors, and not a bad bet for growth investors. I rate the company a solid Buy.
Seeking Alpha Premium
I generally enjoy being a contrarian voice, but I am marching in step with other Seeking Alpha analysts and the Wall Street consensus on this one, as well as the Seeking Alpha Quant ratings system. The average Wall Street analyst price target for KRG is $25.45, implying 9.3% upside.
Meanwhile, The Street, TipRanks, Zacks, and Ford Equity Research all advise a Hold.
But I'm here to remind you, the opinion that matters most is yours.
For further details see:
Kite Realty: Get It While It's Hot